
The market is struggling and is very weak based on the lack of scan results from my favorite scans, including the Diamond PMO Scan. It also tells me that I need to continue to keep my exposure low and "mine" from sectors and industry groups that are showing the most relative strength.
To that end, I opted to look at stocks within the "Industry Group to Watch" from last Friday's Recap. That group is Coal. I found one that looks promising that we've not covered here before.
Next I ran my High Yielder's scan only within the Energy sector. I found Shell (SHLX) and liked both the daily and weekly charts.
The third candidate today was actually a request in this morning's DP Free Trading Room. While I'm not a huge fan of many of the big names in Pharma like MRNA and PFE, Merck is a totally different story with an incredibly bullish daily chart. It had to be presented today!
Today's "Diamonds in the Rough": CNX, MRK and SHLX.
"Stocks to Review": AINV, EFC, AVT, UGI, TRP, ATCO and BPMP.

RECORDING LINK (1/14/2022):
Topic: DecisionPoint Diamond Mine (1/14/2022) LIVE Trading Room
Start Time: Jan 14, 2022 09:00 AM
Meeting Recording Link.
Access Passcode: Diamond@14
REGISTRATION FOR 1/21 Diamond Mine:
When: Jan 21, 2022 09:00 AM Pacific Time (US and Canada)
Topic: DecisionPoint Diamond Mine (1/21/2022) LIVE Trading Room
Register in advance for this webinar HERE.
Save the registration confirmation email with login instructions in case Zoom doesn't notify you in time.

Free DP Trading Room (1/3) RECORDING LINK:
Topic: DecisionPoint Trading Room
Start Time: Jan 18, 2022 09:00 AM
Meeting Recording Link.
Access Passcode: January@18
For best results, copy and paste the access code to avoid typos.
Welcome to DecisionPoint Daily Diamonds, wherein I highlight ten "Diamonds in the Rough" per week. These are selected from the results of my DecisionPoint Scans, which search for stocks that could benefit from the trend and condition of the market. Remember, these are not recommendations to buy or sell, but are the most interesting of the stocks that surfaced in my scans. My objective is to save you the work of the initial, tedious culling process, but you need to apply your own analysis to see if these stocks pique your interest as well. There are no guaranteed winners here!
Predefined Scan Results are taken from the StockCharts.com Scan List.
CNX Resources Corp. (CNX)
EARNINGS: 1/27/2022 (BMO)
CNX Resources Corp. is an independent natural gas exploration, development and production companies, with operations centered in the major shale formations of the Appalachian basin. The company deploys an organic growth strategy focused on responsibly developing its resource base. The firm operates through the Marcellus Shale, and Coalbed Methane segments. CNX Resources was founded in 1864 and is headquartered in Canonsburg, PA.
Predefined Scans Triggered: New 52-week Highs.
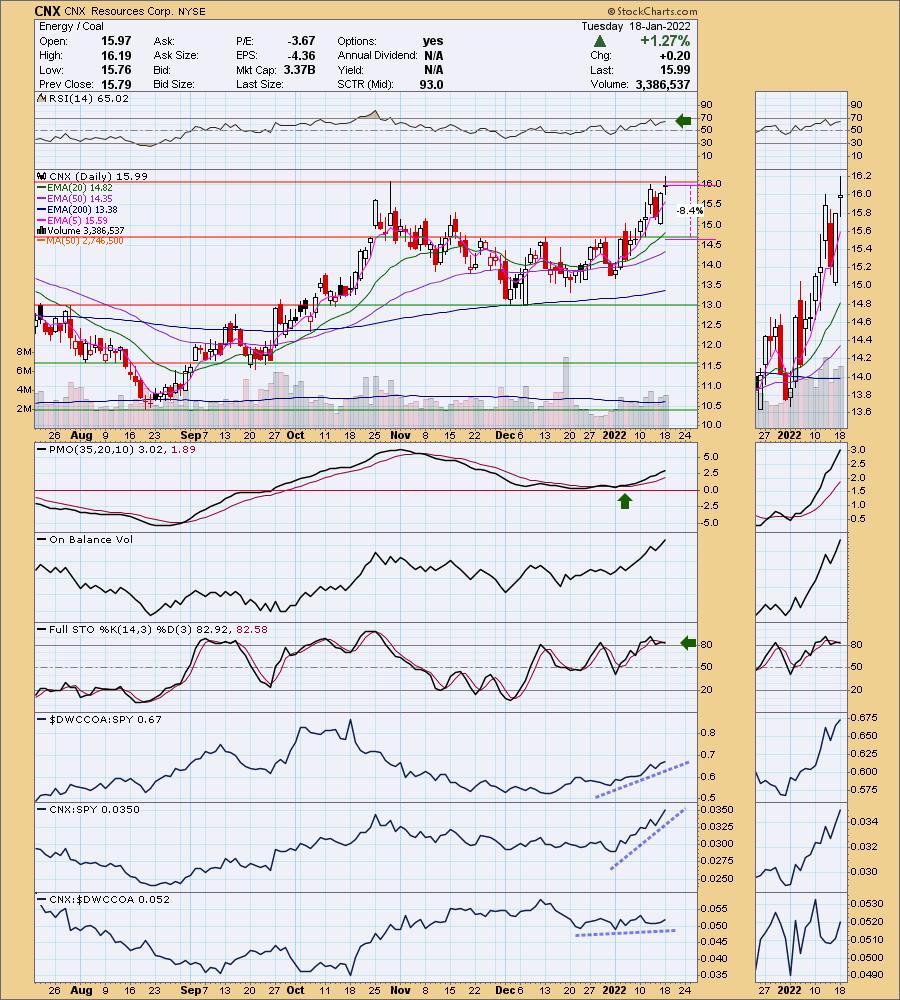
CNX is up +0.13% in after hours trading. I covered CNX back on June 9th 2020 (the stop triggered and the position is closed). As noted in the predefined scan that was triggered today, CNX is hitting new 52-week highs. This group is still very bullish as shown in the relative performance against the SPY. CNX is not necessarily outperforming its group, it is staying inline with it and as long as the group itself is performing well, so will CNX. The RSI is positive and not overbought. The PMO is on a crossover BUY signal and is continuing to rise higher. It is not at all overbought. The OBV is confirming the rally and Stochastics are oscillating above 80, indicating internal strength. The stop is set below the December tops.
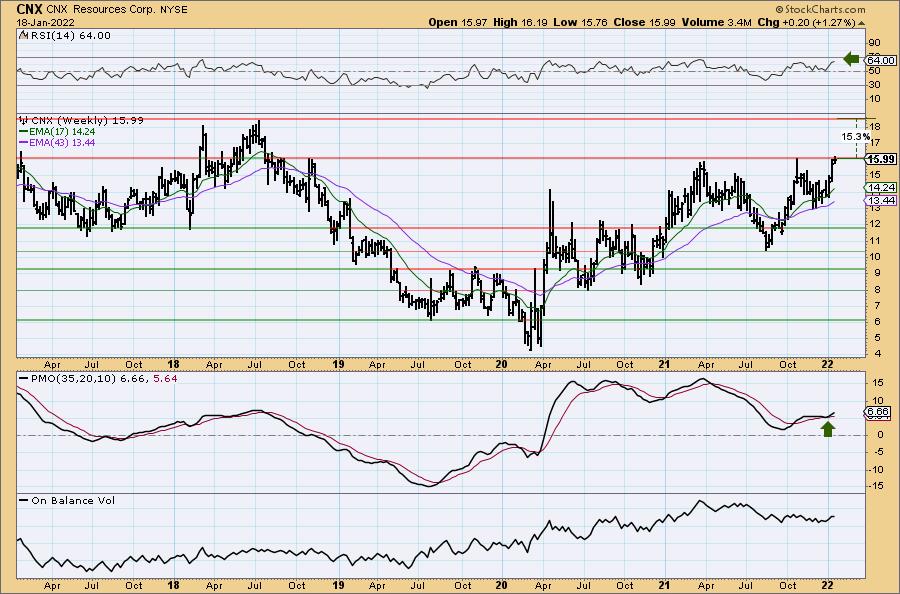
The weekly chart shows us that CNX is up against long-term resistance at the 2021 highs, but that weekly PMO is very bullish having bottomed above the signal line. The RSI is positive and rising. Upside potential is at least 15%, if not more on a breakout.
Merck & Co., Inc. (MRK)
EARNINGS: 2/3/2022 (BMO)
Merck & Co., Inc. engages in the provision of health solutions through its prescription medicines, vaccines, biologic therapies, animal health, and consumer care products. It operates through the following segments: Pharmaceutical, Animal Health, and Other. The Pharmaceutical segment includes human health pharmaceutical and vaccine products. The Animal Health segment discovers, develops, manufactures, and markets animal health products, such as pharmaceutical and vaccine products, for the prevention, treatment and control of disease in livestock and companion animal species. The Other segment consists of sales for the non-reportable segments of healthcare services. The company was founded in 1891 and is headquartered in Kenilworth, NJ.
Predefined Scans Triggered: P&F Low Pole.
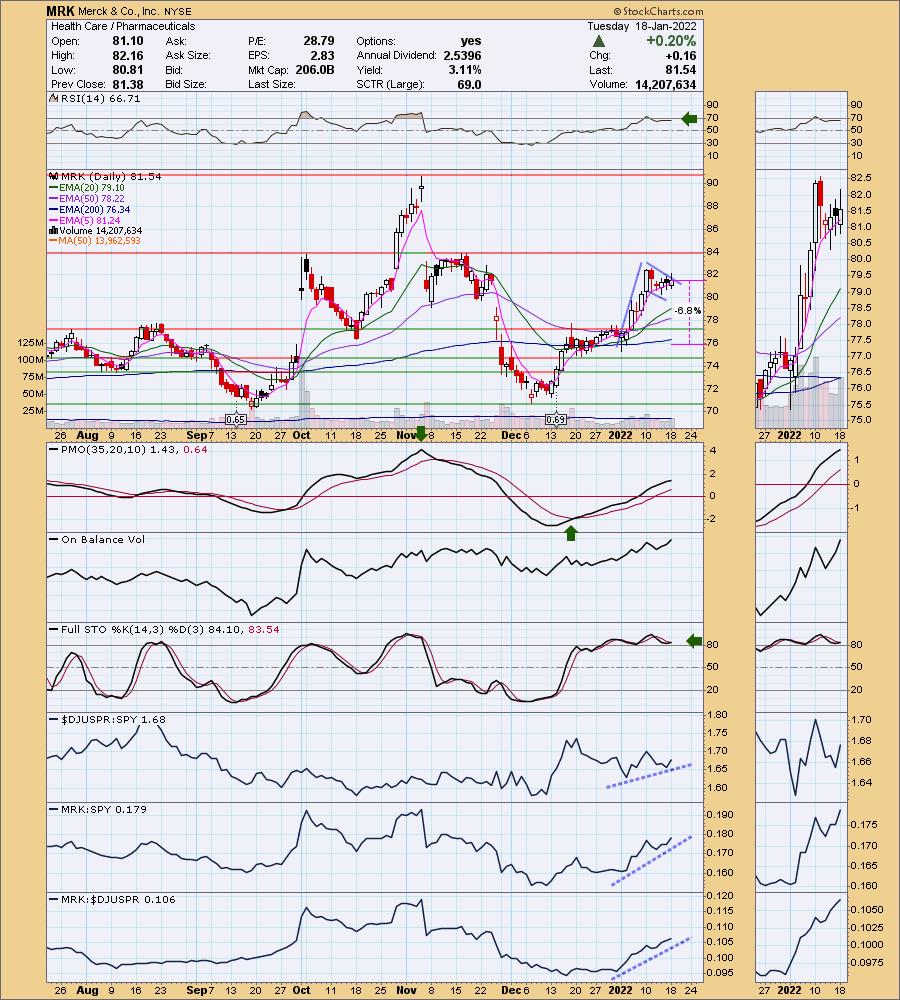
MRK is down -0.53% in after hours trading. Price came close to testing resistance at the early October top, but pulled back. That's okay as price has formed a bull flag in the process of consolidating the early January rally. The PMO is rising and is not overbought. You can see in November it was above 4.00. The RSI is also positive and not overbought. Volume is coming in, but that could be the one thing I don't like about it. We have lots of volume based on the rising OBV, but notice that the OBV is making new highs while price is not. That is a reverse divergence. Despite higher volume, price isn't moving as it should. Price should always follow volume so that does make this slightly less favorable. Stochastics are oscillating above 80 which is bullish. Pharma is beginning to outperform again and MRK is showing leadership as it outperforms the group and the SPY. You can set your stops at varying levels. First a tight stop at the 50-day EMA or as I've done, a stop below the 200-day EMA or you could make it deeper and set it at the late December lows or even the August lows.
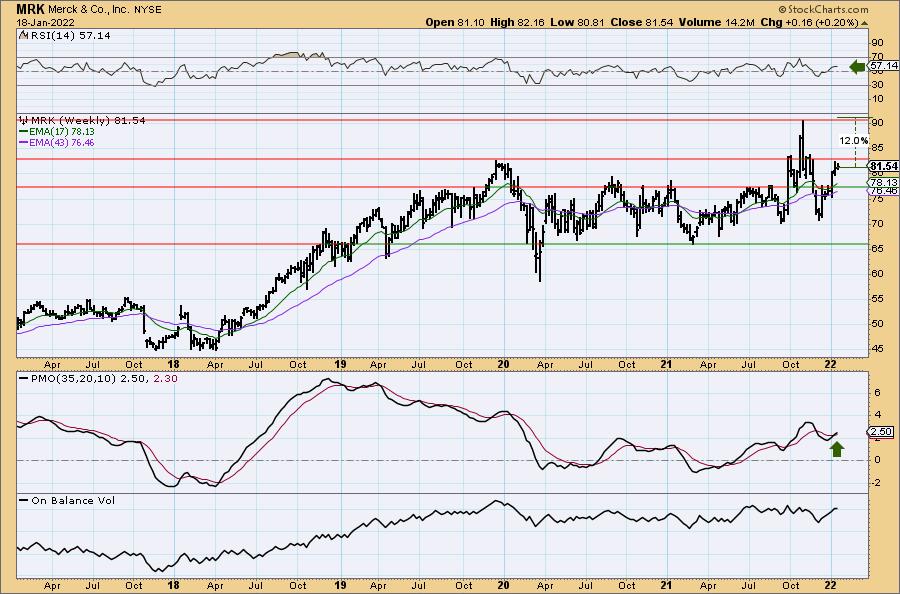
The weekly PMO just triggered a crossover BUY signal. The weekly RSI is positive. If it can get just above all-time highs, it would be a 12% gain, but I expect it to move higher than that.
Shell Midstream Partners, LP (SHLX)
EARNINGS: 2/18/2022 (BMO)
Shell Midstream Partners LP owns, operates, develops, and acquires pipelines and other midstream assets. Its assets consist of entities which hold interest in crude oil and refined products pipelines and a crude tank storage and terminal system. The company was founded on March 19, 2014 and is headquartered in Houston, TX.
Predefined Scans Triggered: P&F Double Top Breakout.
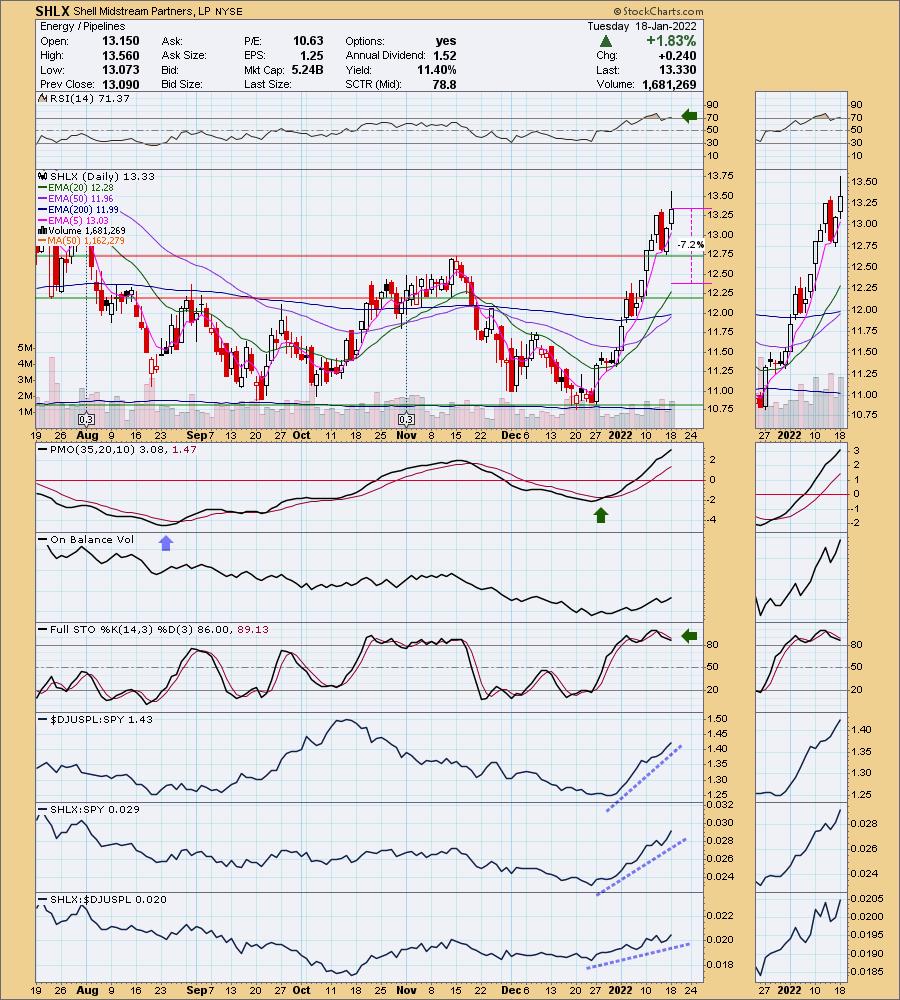
SHLX is down -0.98% in after hours trading. Put this in the category of "winners keep on winning". I wish I'd seen the chart on Friday after the successful bounce off prior resistance. The RSI is overbought, but I'll forgive it given the Pipelines industry group has been on fire for weeks. We also know that in a strong bull market for the stock, overbought conditions can persist. The PMO looks like it is overbought, but we know that the PMO fell to -4.0. The PMO range is then -4 to +4. It can move much higher. SHLX is nearing a "golden cross" which would trigger a LT Trend Model BUY signal. The "silver cross" occurred in the first week of January which gave us an IT Trend Model BUY signal. Stochastics have topped but remain above 80 suggesting internal strength. Relative strength is clearly very bullish. I've set the stop at the late August top.
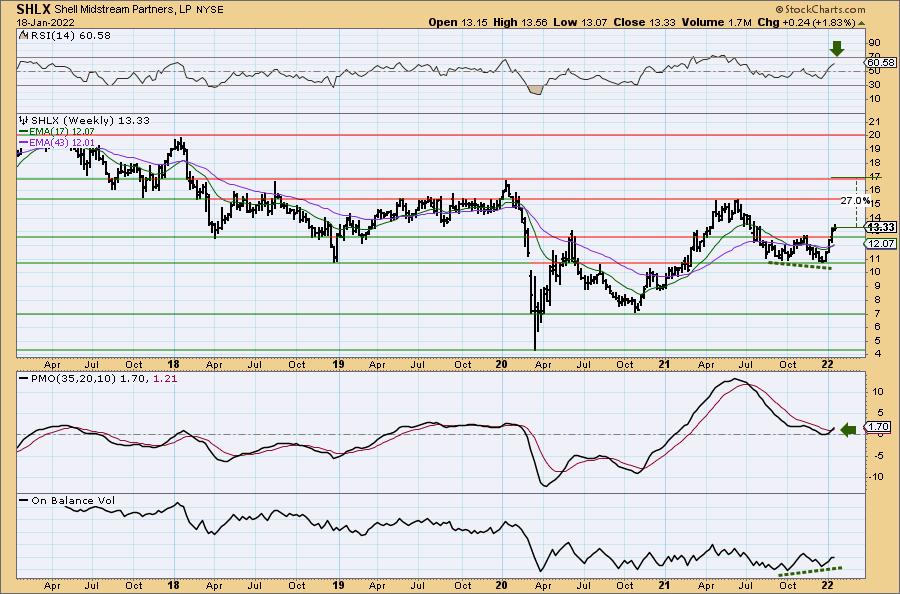
Definitely a very bullish weekly chart. The weekly RSI is positive and the weekly PMO just triggered a crossover BUY signal. Icing on the cake would be the positive OBV divergence (rising OBV bottoms, falling price bottoms). If it only were to make it to the 2021 top that would be about a 15% gain, but I would look for it to reach $17.
Don't forget, on Thursdays I look at reader-requested symbols, click HERE to shoot me an email. I read every email I receive and try to answer them all!
Current Market Outlook:
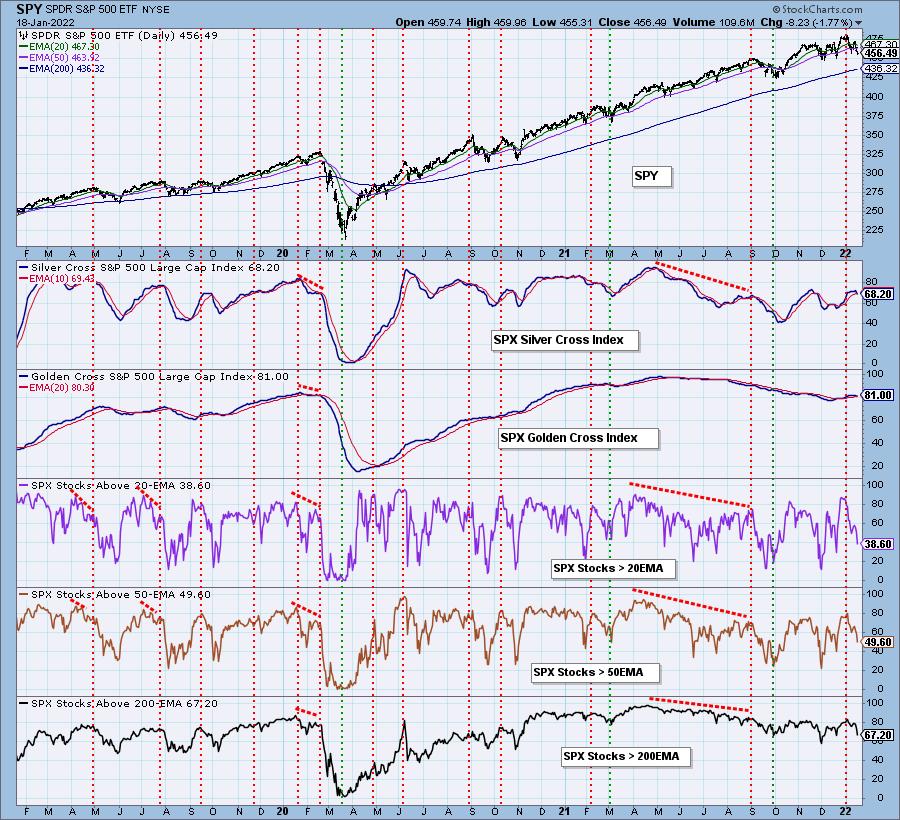
Market Environment: It is important to consider the odds for success by assessing the market tides. The following chart uses different methodologies for objectively showing the depth and trend of participation for intermediate- and long-term time frames.
- The Silver Cross Index (SCI) shows the percentage of SPX stocks on IT Trend Model BUY signals (20-EMA > 50-EMA)
- The Golden Cross Index (GCI) shows the percentage of SPX stocks on LT Trend Model BUY signals (50-EMA > 200-EMA)
Don't forget that as a "Diamonds" member, you have access to our GCI/SCI curated ChartList on DecisionPoint.com. You'll find it under "Members Only" links on the left side on the Blogs and Links Page.
Here is the current chart:
Full Disclosure: I'm 30% invested and 70% is in 'cash', meaning in money markets and readily available to trade with.
I'm required to disclose if I currently own a stock and/or may buy it within the next 72 hours.
Happy Charting!
- Erin
"Technical Analysis is a windsock, not a crystal ball." - Carl Swenlin
(c) Copyright 2022 DecisionPoint.com
Watch the latest episode of DecisionPoint with Carl & Erin Swenlin on Mondays 7:00p EST or on the DecisionPoint playlist on the StockCharts TV YouTube channel here!
NOTE: The stocks reported herein are from mechanical trading model scans that are based upon moving average relationships, momentum and volume. DecisionPoint analysis is then applied to get five selections from the scans. The selections given should prompt readers to do a chart review using their own analysis process. This letter is not a call for a specific action to buy, sell or short any of the stocks provided. There are NO sure things or guaranteed returns on the daily selection of "Diamonds in the Rough."
Helpful DecisionPoint Links:
DecisionPoint Shared ChartList and DecisionPoint Chart Gallery
Price Momentum Oscillator (PMO)
Swenlin Trading Oscillators (STO-B and STO-V)
For more links, go to DecisionPoint.com