
Another day of zero scan results. Today was particularly bad as I went through scan after scan and it returned charts that weren't "Diamond in the Rough" material. There was a "theme" today and that was Gold Miners. However, I feel I've beat the drum hard enough on that group and have definitely shared plenty of symbols. I do note that last week's Gold Fields (GFI) was up +12.8% today (I own it so I'm pleased), but a caveat is that the 7.5% stop was nearly triggered yesterday on a test of the 200-day EMA.
With results limited to mostly Gold Miners today, I decided to use the DecisionPoint ETF Tracker ChartList** to 'mine' for charts. I used a CandleGlance to look at all 104 charts and I can tell you that nearly all of them have falling momentum. It was quite shocking.
I don't have any "Stocks to Review" today, there just weren't any good candidates. I may have to start looking for shorting opportunities.
Today's "Diamonds in the Rough": DBA, GSG, SLV and WEAT.
** The ETF Tracker is available for free to StockCharts EXTRA & PRO members as part of the DP Trend and Condition ChartPack. If you go to "Your Account" on StockCharts and click on "Manage ChartPacks", you'll find that ChartPack among others that are free from DecisionPoint. If you aren't a member, I've put the list of ETFs at the bottom of this blog article and you can use them in whatever charting program you wish. There are 104 of them that cross all of the primary industry groups we follow as well as international ETFs.

RECORDING LINK (1/14/2022):
Topic: DecisionPoint Diamond Mine (1/14/2022) LIVE Trading Room
Start Time: Jan 14, 2022 09:00 AM
Meeting Recording Link.
Access Passcode: Diamond@14
REGISTRATION FOR 1/21 Diamond Mine:
When: Jan 21, 2022 09:00 AM Pacific Time (US and Canada)
Topic: DecisionPoint Diamond Mine (1/21/2022) LIVE Trading Room
Register in advance for this webinar HERE.
Save the registration confirmation email with login instructions in case Zoom doesn't notify you in time.

Free DP Trading Room (1/18) RECORDING LINK:
Topic: DecisionPoint Trading Room
Start Time: Jan 18, 2022 09:00 AM
Meeting Recording Link.
Access Passcode: January@18
For best results, copy and paste the access code to avoid typos.
Welcome to DecisionPoint Daily Diamonds, wherein I highlight ten "Diamonds in the Rough" per week. These are selected from the results of my DecisionPoint Scans, which search for stocks that could benefit from the trend and condition of the market. Remember, these are not recommendations to buy or sell, but are the most interesting of the stocks that surfaced in my scans. My objective is to save you the work of the initial, tedious culling process, but you need to apply your own analysis to see if these stocks pique your interest as well. There are no guaranteed winners here!
"Predefined Scans Triggered" are taken from the StockCharts.com using the "Symbol Summary" option instead of a "SharpChart" on the workbench.
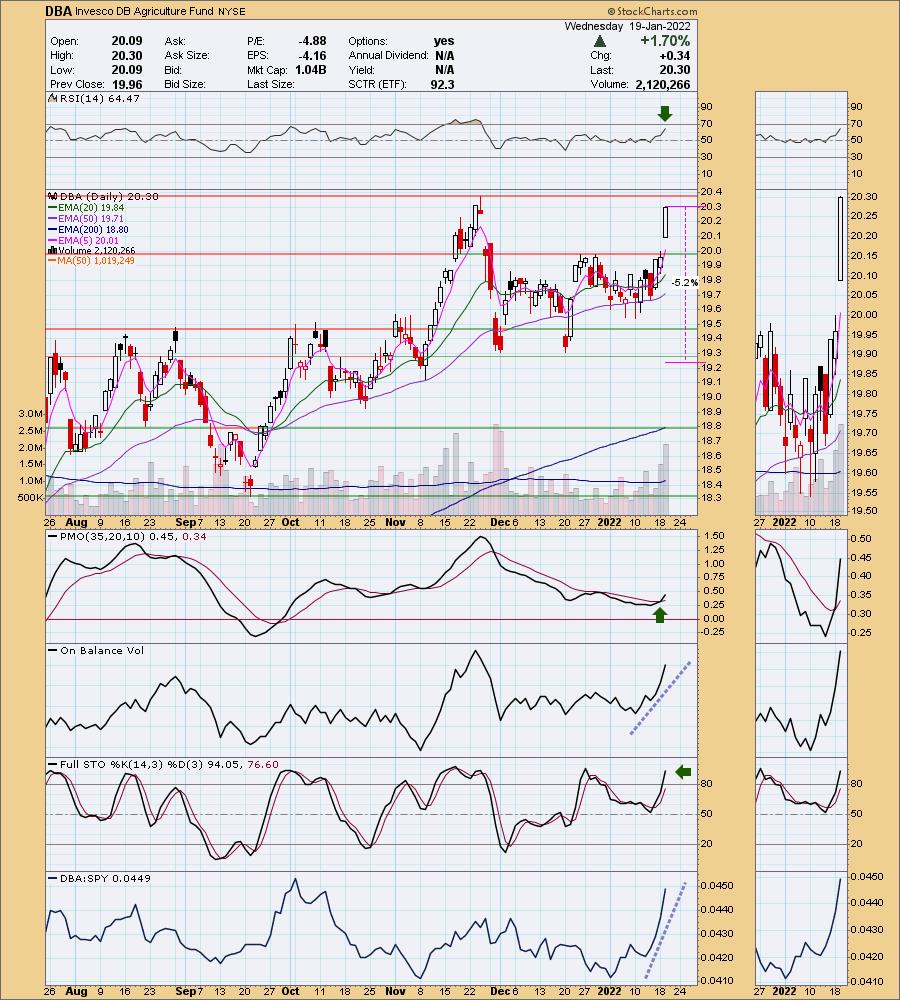
Invesco DB Agriculture Fund (DBA)
EARNINGS: N/A
DBA tracks an index of 10 agricultural commodity futures contracts. It selects contracts based on the shape of the futures curve to minimize contango. Link with portfolio information from Invesco HERE.
Predefined Scans Triggered: Moved Above Upper Keltner Channel, Moved Above Upper Bollinger Band, Moved Above Upper Price Channel, P&F Double Top Breakout and P&F Bearish Signal Reversal.
DBA is up +0.05% in after hours trading. I've covered DBA twice before on February 19th 2020 (position stopped out) and August 6th 2020 (position is still open and is up +43.6%). This isn't a "sexy" investment. In fact, DBA is a very slow mover. On 8/6/2020 I practically called the bottom. It's been 18 months and it isn't up triple digits...not that I'm complaining! Today it gapped up, breaking above overhead resistance at the December high. Resistance is arriving quickly, but given the new PMO crossover BUY signal and strong Stochastics, it shouldn't have much of a problem with that. The RSI is positive and not overbought and volume is definitely coming in. The stop can be set below the December lows at a thin 5.2%.
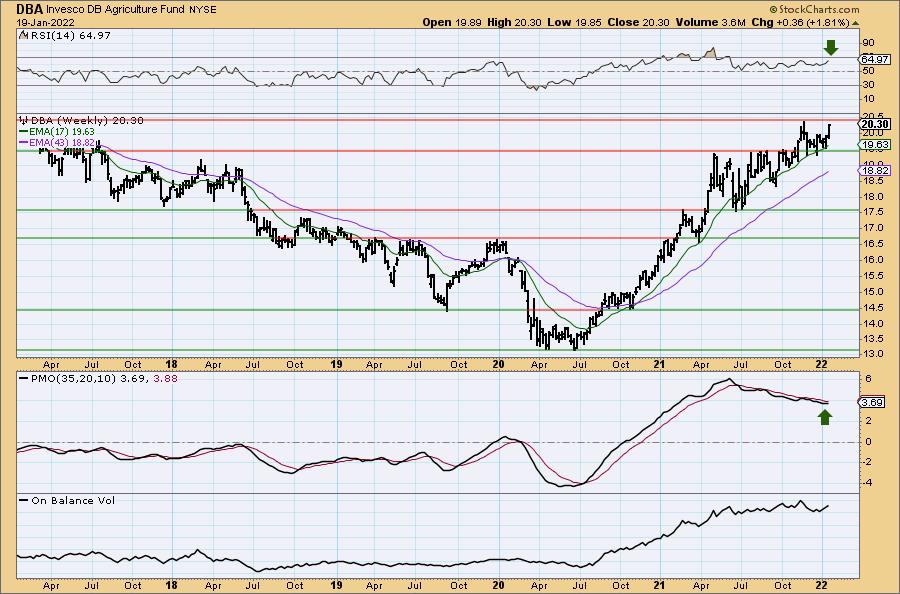
You'll note that the weekly PMO has been falling even as price is rising. Basically, it is losing acceleration on the rally, but that is good right now. This has taken the weekly PMO out of extremely overbought territory. The weekly RSI is positive and not overbought. It is very close to multi-year highs and with inflation, it will move even higher.
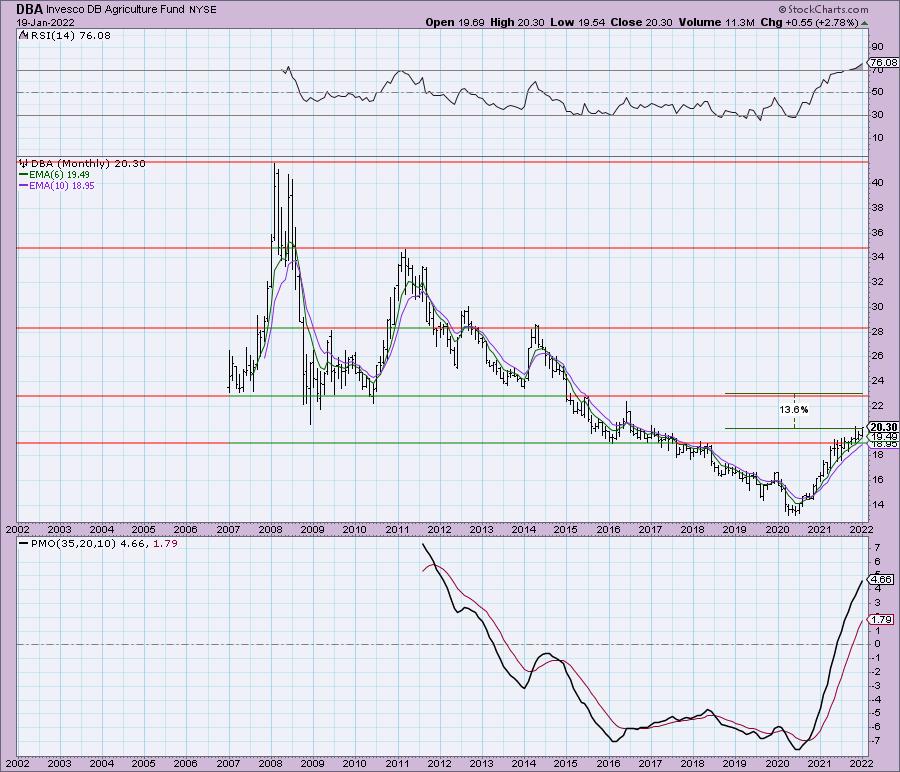
Using the monthly chart, we can set our upside target around $23 at the next level of strong resistance. Since our stop is only 5.2%, a gain of 13.6% is a good target.
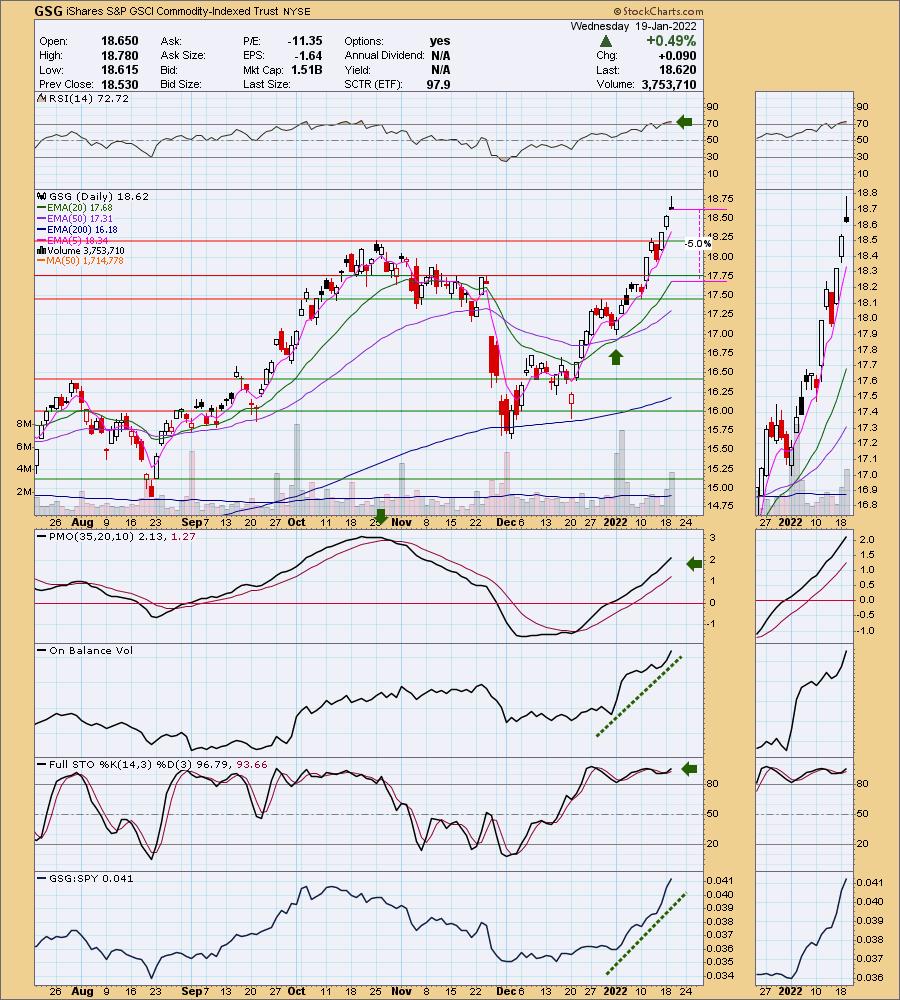
iShares S&P GSCI Commodity-Indexed Trust (GSG)
EARNINGS: N/A
GSG uses index futures contracts to gain exposure to a production-weighted index of front-month commodities futures contracts. For more information here is a link to iShares.
Predefined Scans Triggered: New 52-week Highs, Filled Black Candles and P&F Double Top Breakout.
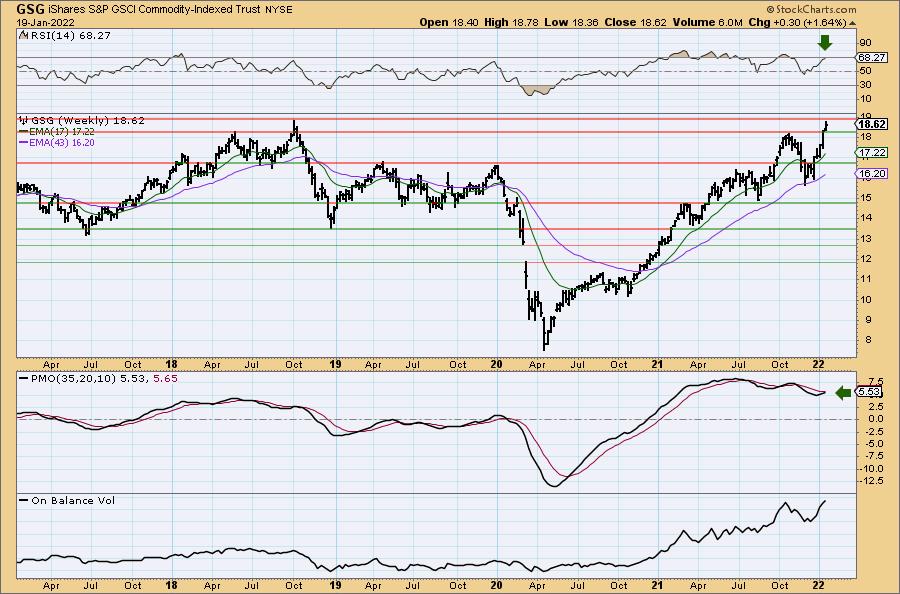
GSG is unchanged in after hours trading. I talked about GSG in yesterday DP Alert, commenting on the recent breakout. The RSI is overbought and we do have a bearish filled black candlestick that is also a bearish shooting star so we'll see how it does on Friday's spreadsheet. It is currently enjoying a strong rally on a steep rising trend. Stochastics are rising and have been sitting above 80 for some time. The PMO is rising strongly and isn't overbought yet. I'd like this one for entry on a drop to the 5-day EMA which has been holding as support. You can adjust the stop as you wish, but I think a 5% stop should work well as it would mean a trip below the 20-day EMA and support at both the October and November highs.
The weekly RSI is rising and isn't as overbought as the daily RSI. The weekly PMO is rising toward a crossover BUY signal. We can see this is strong multi-year resistance.
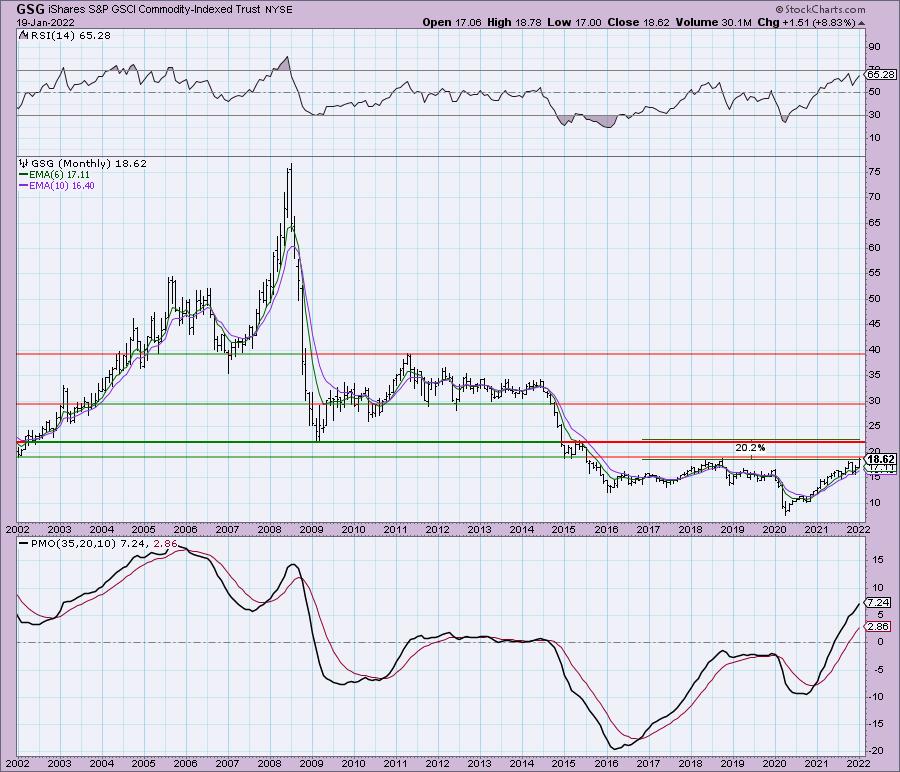
Using a monthly chart we can set our upside target around $23 which would still be a 20%+ gain.
iShares Silver Trust (SLV)
EARNINGS: N/A
SLV tracks the silver spot price, less expenses and liabilities, using silver bullion held in London. For more information on the trust from iShares, click here.
Predefined Scans Triggered: Moved Above Upper Keltner Channel and Moved Above Upper Bollinger Band.
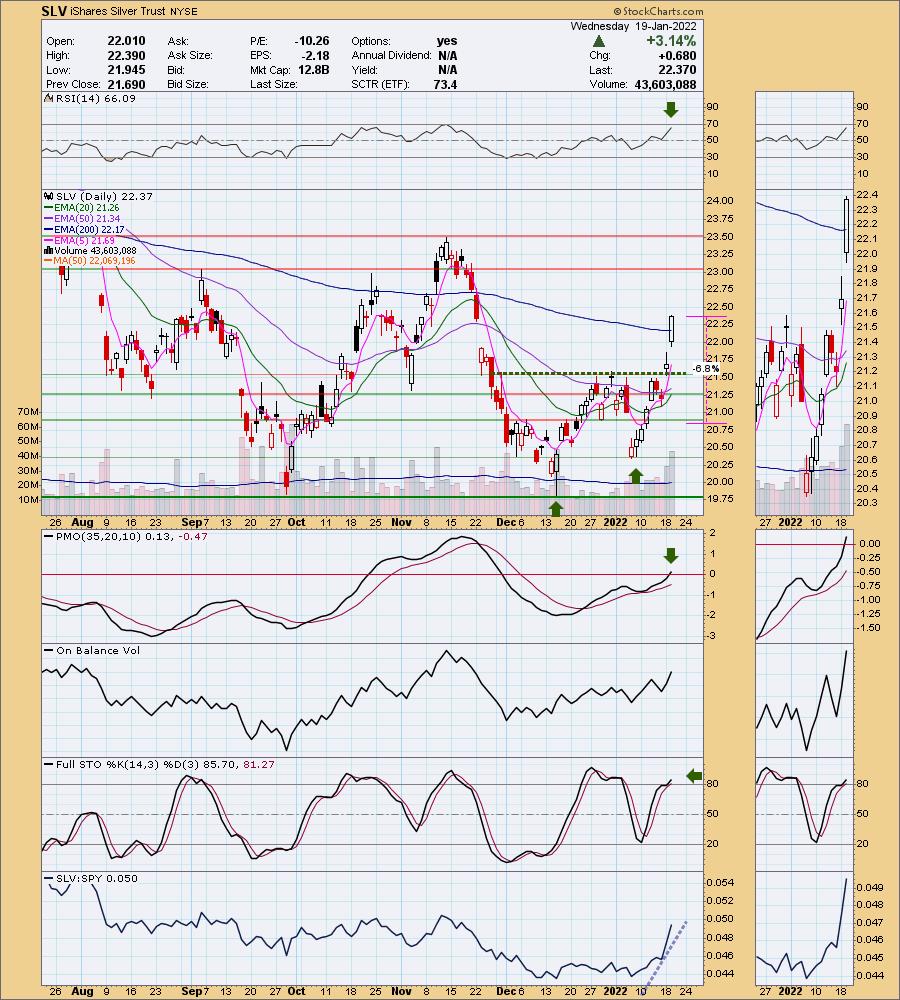
SLV is down -0.45% in after hours trading. I covered SLV back on December 21st 2020 (position has stopped out). SLV broke out yesterday from a double-bottom pattern. Interestingly, the minimum upside target of the pattern would put Silver at the November top. The RSI is positive and rising. The PMO just hit positive territory after an oversold crossover BUY signal. Stochastics are rising and just pushed past 80. Relative strength is clearly bullish. I've set the stop at the late December lows, but if you aren't risk averse you could make it more like a 9% stop below this month's low.
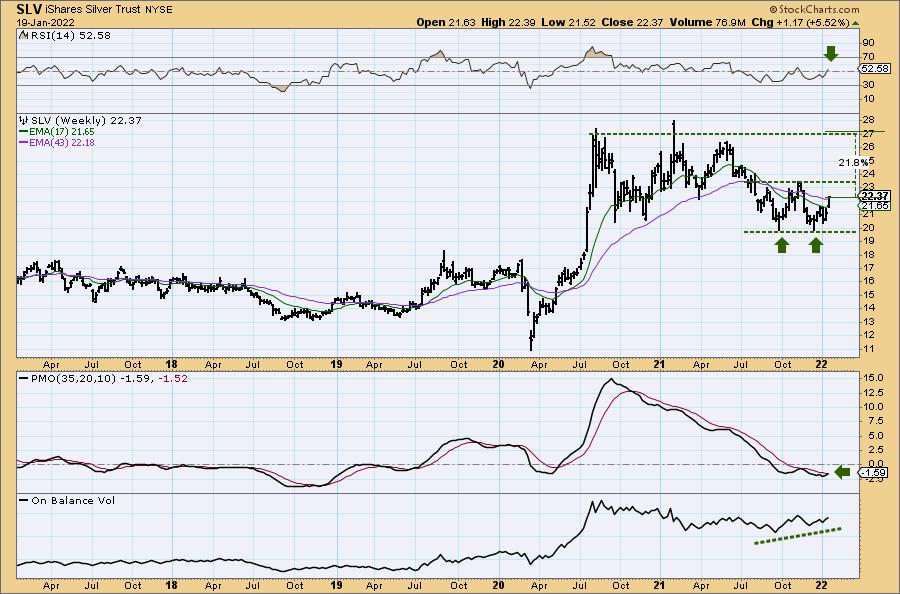
Not only is there a double-bottom on the daily chart, there is an even better one developing on the weekly chart. The weekly RSI just hit positive territory and the weekly PMO is about to trigger a crossover BUY signal in oversold territory. The minimum upside target of the double-bottom would be right at overhead resistance which would be a nearly 22% gain. This is not an all-time high for SLV, its all-time high is at $48.35 which it hit in April of 2011.
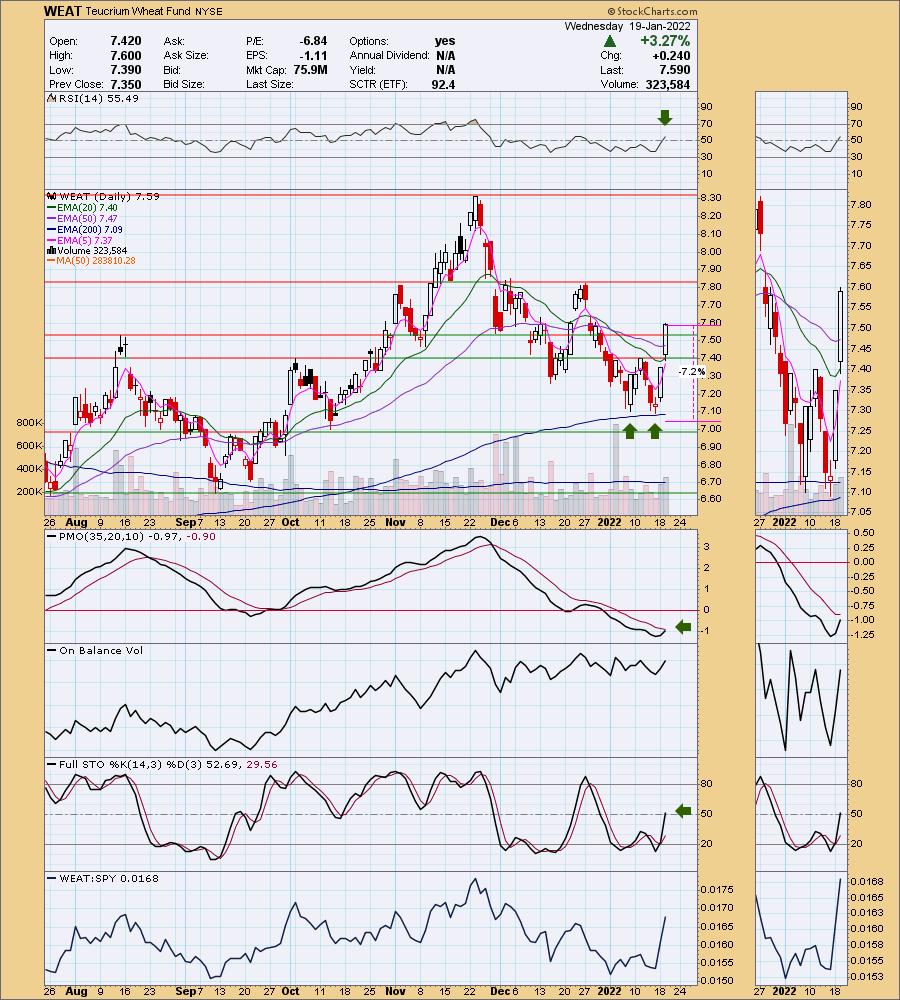
Teucrium Wheat Fund (WEAT)
EARNINGS: N/A
WEAT tracks an index of wheat futures contracts. It includes the second and third contracts to expire, as well as the contract expiring in the December following the third contract. For more information on this fund, here is the link.
Predefined Scans Triggered: Bullish MACD Crossover, Parabolic SAR Buy Signals and Entered Ichimoku Cloud.
WEAT is up +0.13% in after hours trading. I covered WEAT on January 7th 2021. The stop was nearly hit, but the position is currently open and up +21.8%. This is another slow mover, but in a volatile market that's not a terrible thing. Price broke out today above the 20/50-day EMAs as well as above the August high and confirmation line of the double-bottom pattern. The upside target would take it to the December top, but given the bullish indicators, I would look for it to move much higher. The RSI is now positive and rising. The PMO is curling up and should generate a crossover BUY signal soon. Stochastics are rising and just moved above net neutral (50). I've set the stop below the double-bottom.
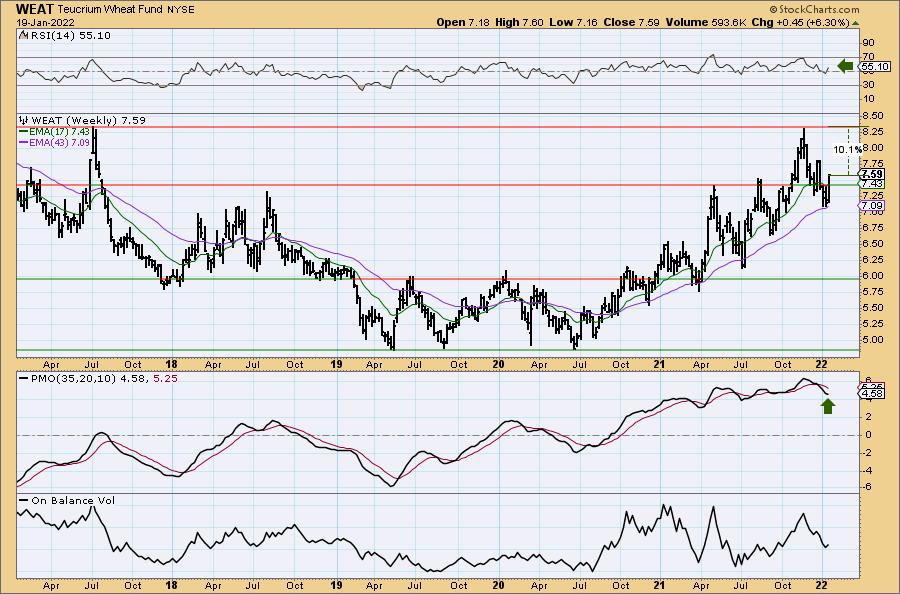
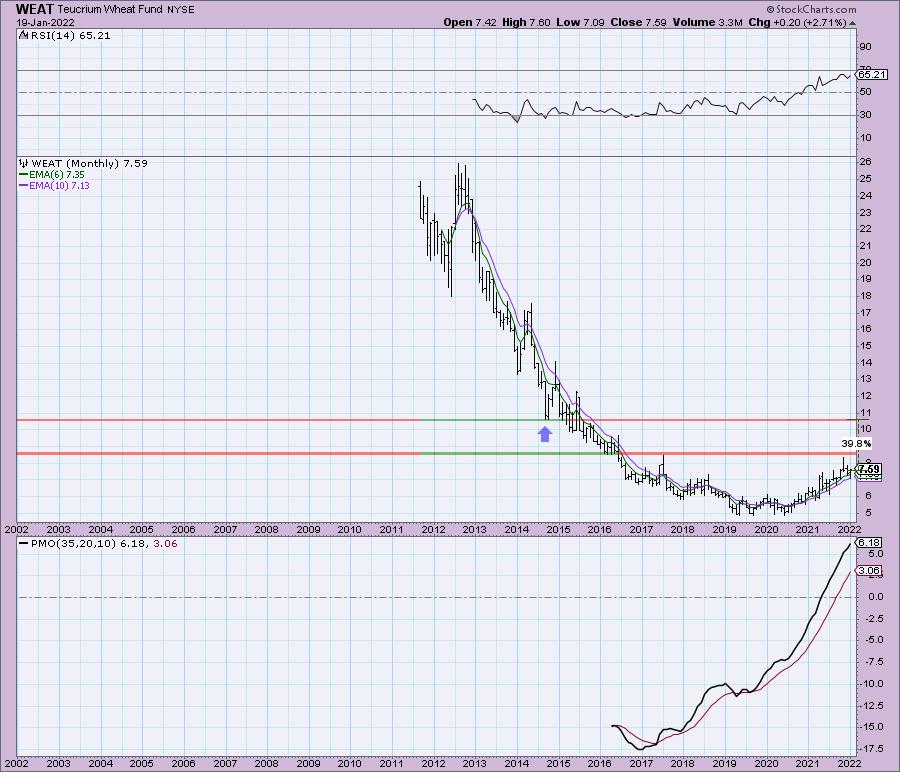
The weekly chart shows that price bounced again off the 43-week EMA. The weekly RSI is positive and rising. The weekly PMO is beginning to turn back up. The weekly chart shows an upside target of 10%, but using the monthly chart, I would consider an upside target around $10.50.
Don't forget, on Thursdays I look at reader-requested symbols, click HERE to shoot me an email. I read every email I receive and try to answer them all!
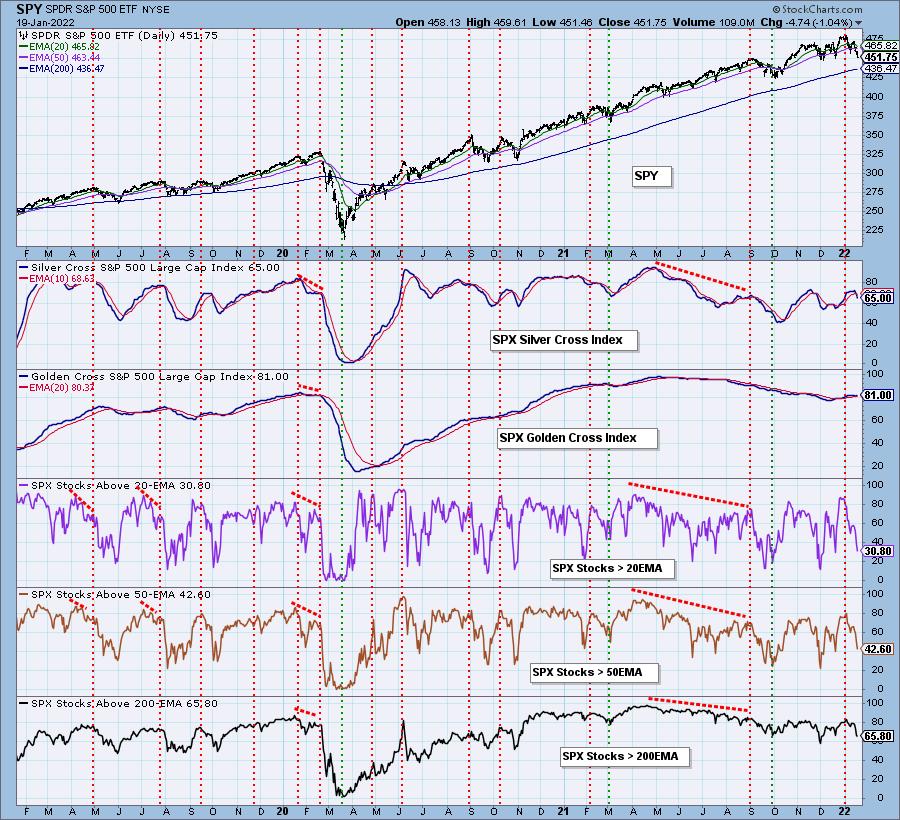
Current Market Outlook:
Market Environment: It is important to consider the odds for success by assessing the market tides. The following chart uses different methodologies for objectively showing the depth and trend of participation for intermediate- and long-term time frames.
- The Silver Cross Index (SCI) shows the percentage of SPX stocks on IT Trend Model BUY signals (20-EMA > 50-EMA)
- The Golden Cross Index (GCI) shows the percentage of SPX stocks on LT Trend Model BUY signals (50-EMA > 200-EMA)
Don't forget that as a "Diamonds" member, you have access to our GCI/SCI curated ChartList on DecisionPoint.com. You'll find it under "Members Only" links on the left side on the Blogs and Links Page.
Here is the current chart:
Full Disclosure: I'm 30% invested and 70% is in 'cash', meaning in money markets and readily available to trade with.
I'm required to disclose if I currently own a stock and/or may buy it within the next 72 hours.
Happy Charting!
- Erin
"Technical Analysis is a windsock, not a crystal ball." - Carl Swenlin
(c) Copyright 2022 DecisionPoint.com
Watch the latest episode of DecisionPoint with Carl & Erin Swenlin on Mondays 7:00p EST or on the DecisionPoint playlist on the StockCharts TV YouTube channel here!
NOTE: The stocks reported herein are from mechanical trading model scans that are based upon moving average relationships, momentum and volume. DecisionPoint analysis is then applied to get five selections from the scans. The selections given should prompt readers to do a chart review using their own analysis process. This letter is not a call for a specific action to buy, sell or short any of the stocks provided. There are NO sure things or guaranteed returns on the daily selection of "Diamonds in the Rough."
Helpful DecisionPoint Links:
DecisionPoint Shared ChartList and DecisionPoint Chart Gallery
Price Momentum Oscillator (PMO)
Swenlin Trading Oscillators (STO-B and STO-V)
For more links, go to DecisionPoint.com
ETF Tracker Components:
06 - Electric/Autonomous Ve...
iShares PHLX Semiconductor ...