
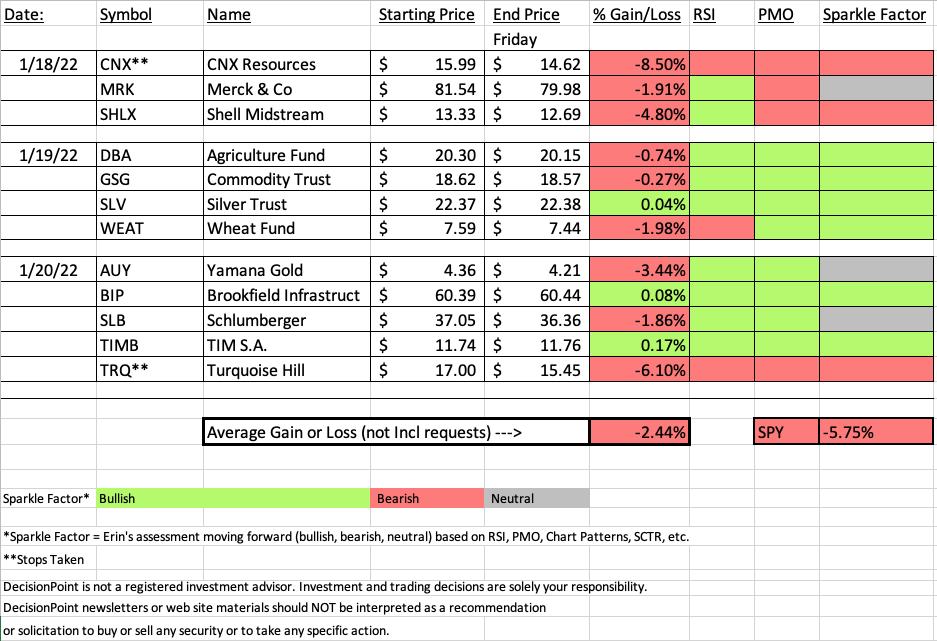
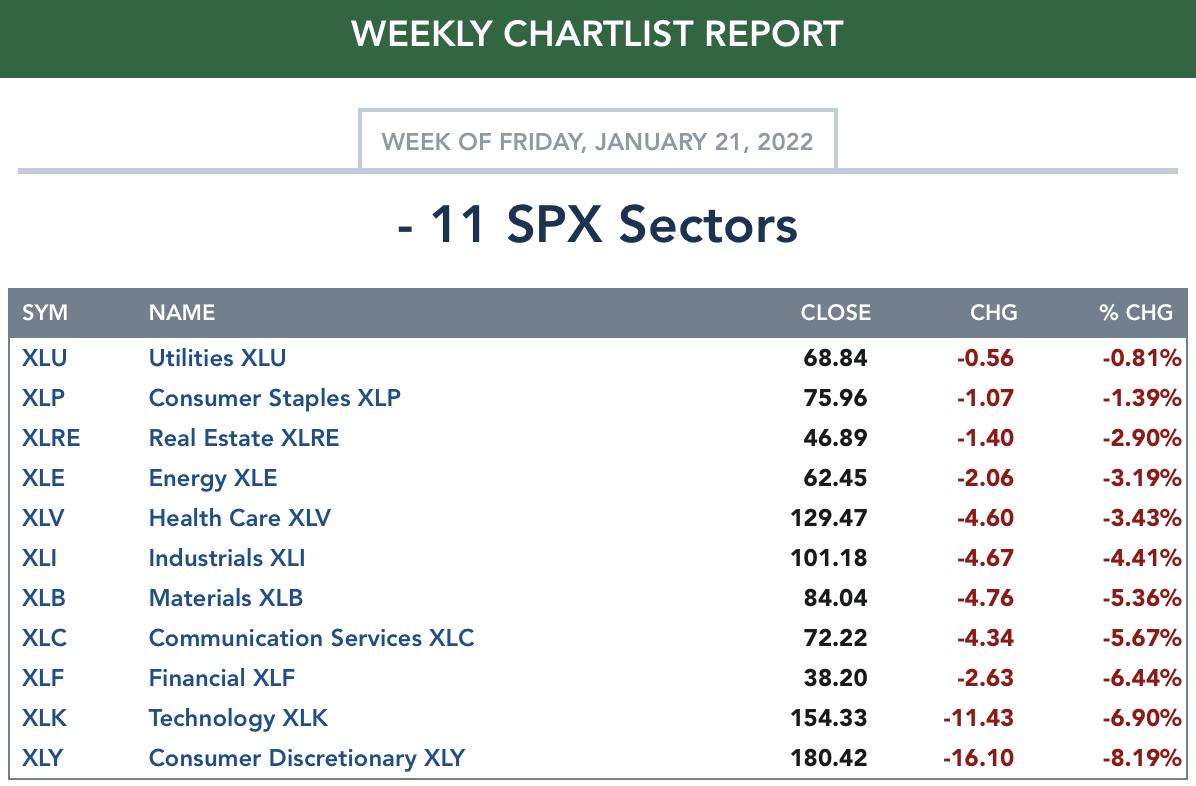
It seems clear that we are now heading into a bear market. Take a look at the sector CandleGlance. Every sector has negative momentum so finding a 'Sector to Watch' isn't particularly helpful as what I expect to see is "outperformance" against the SPY. I have "outperformance" in quotes because a sector can outperform the SPY and still finish lower. That's exactly what happened to our "Diamonds in the Rough" this week. We outperformed the SPY by over 3% but we were still down -2.44%. Next week will be all about "short" positions, unless we see a healthy bounce in the short term.
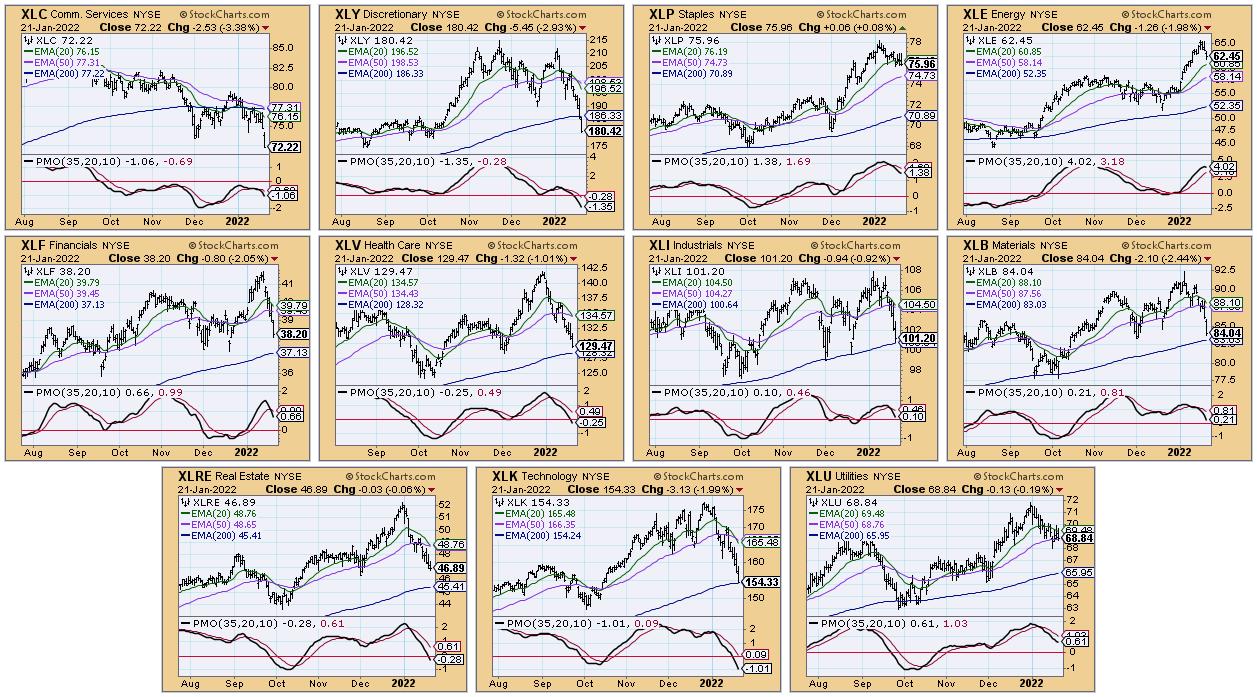
My sense is that we will see rotation into Utilities. Unfortunately, it is an educated guess that really isn't supported by the chart right now. The two sectors I "like" based on the charts would be XLP and XLE. I truly believe that Energy will continue to pull back so I opted to go with Consumer Staples (XLP) which still has decent participation but still holds a bearish bias.
This week's "Darling" was the reader request, TIMB. It had a positive day (+0.17%) and that was all it took since it was picked yesterday. A close second goes to reader request, BIP which was up today (+0.08%). Both look good moving forward... well, about as good as it gets right now.
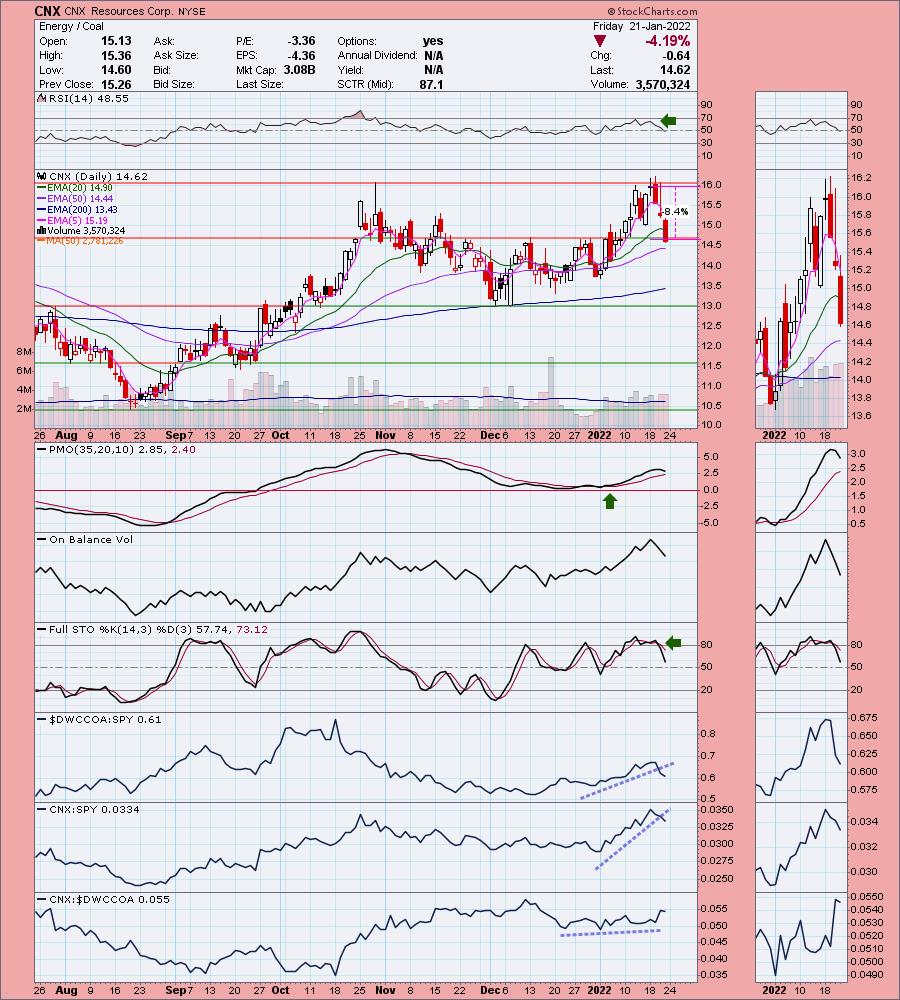
This week's "Dud" is CNX which triggered its 8.1% stop (actually was down 8.57% on the week). Close second would be TRQ which triggered its 6.1% stop. I didn't have luck with TRQ last time I picked it. I thought my timing was better this time around but the market had its way with nearly all of the "Diamonds in the Rough"
Other items to note on the Recap spreadsheet. Tuesday was a bust as Pharma backed off, CNX tanked and SHLX is caught up in the pullback in Crude Oil right now. The ETFs from Wednesday still look pretty good moving forward. On yesterday's Diamonds in the Rough, AUY I have listed as Neutral because, while I like the group, I believe there are better choices. SLB is also caught up in the pullback in Crude Oil, but that could change, leaving me neutral on SLB which is a clear outperformer amongst its peers.
Below you'll find the latest Diamond Mine recording link as well as the registration link for next week.
** NOTICE ** The free trading room on Monday has been postponed to Tuesday given the MLK holiday on Monday. Wouldn't be much of a trading room if there aren't stocks moving. The holiday will not impact our Diamonds schedule.
Have a great weekend! The next Diamonds report will be on Tuesday of next week.

RECORDING LINK (1/21/2022):
Topic: DecisionPoint Diamond Mine (1/21/2022) LIVE Trading Room
Start Time: Jan 21, 2022 09:00 AM
Meeting Recording Link.
Access Passcode: January#21
REGISTRATION FOR 1/28 Diamond Mine:
When: Jan 28, 2022 09:00 AM Pacific Time (US and Canada)
Topic: DecisionPoint Diamond Mine (1/28/2022) LIVE Trading Room
Register in advance for this webinar HERE.
Save the registration confirmation email with login instructions in case Zoom doesn't notify you in time.

Free DP Trading Room (1/18) RECORDING LINK:
Topic: DecisionPoint Trading Room
Start Time: Jan 18, 2022 08:58 AM
Meeting Recording Link.
Access Passcode: January@18
For best results, copy and paste the access code to avoid typos.
A few items about the spreadsheet: I've put on the spreadsheet whether the RSI is positive (green) or negative (red). The PMO column tells you if it is rising (green) or falling (red). Finally I've added my own "Sparkle Factor" that gives you my assessment going forward, bullish (green), bearish (red) or neutral (gray). The Sparkle Factor is basically my thoughts on whether I expect it to rise or fall. A neutral means it could really go either way so it could be added to a watch list. If you're in a stock I consider "neutral" going forward, the ball is in your court.
Darling:
TIM S.A (TIMB)
EARNINGS: 2/9/2022 (AMC)
TIM SA (Brazil) engages in providing mobile telephony, internet, and media telecommunication services. It offers modem, tablet, cell phone, and ultra fixed broadband. The company was founded on March 9, 1998 and is headquartered in Rio de Janeiro, Brazil.
Predefined Scans Triggered: None.
Below are the commentary and chart from yesterday (1/20):
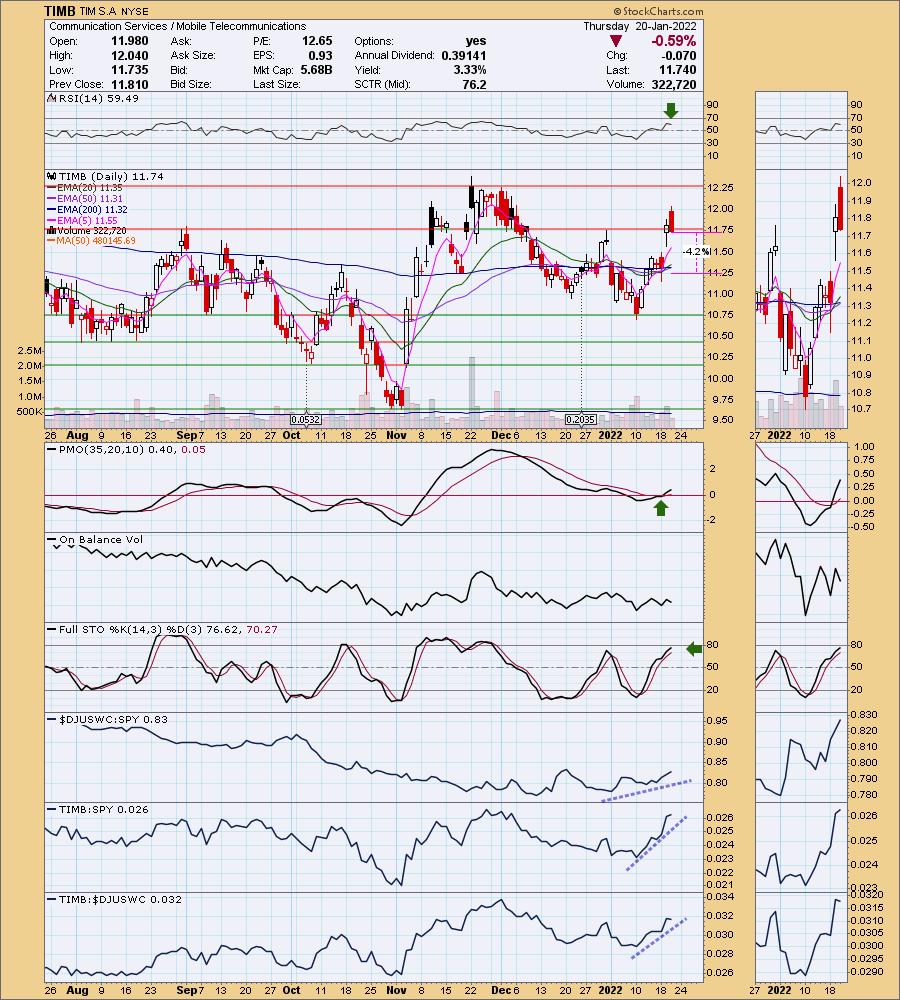
"TIMB is down -1.19% in after hours trading. I covered TIMB on May 19th 2021. The position has stopped out since. I thought this one was interesting. Price confirmed the double-bottom pattern with yesterday breakout, but price closed back beneath the confirmation line. Still, the RSI is positive and the PMO is on an oversold BUY signal just below the zero line. It nearly had a "golden cross" of the 50/200-day EMAs today which would have given us a LT Trend Model BUY signal. It already had a "silver cross" of the 20/50-day EMAs. Stochastics and relative strength are bullish. I'd set my stop below the key moving averages."
Here is today's chart:
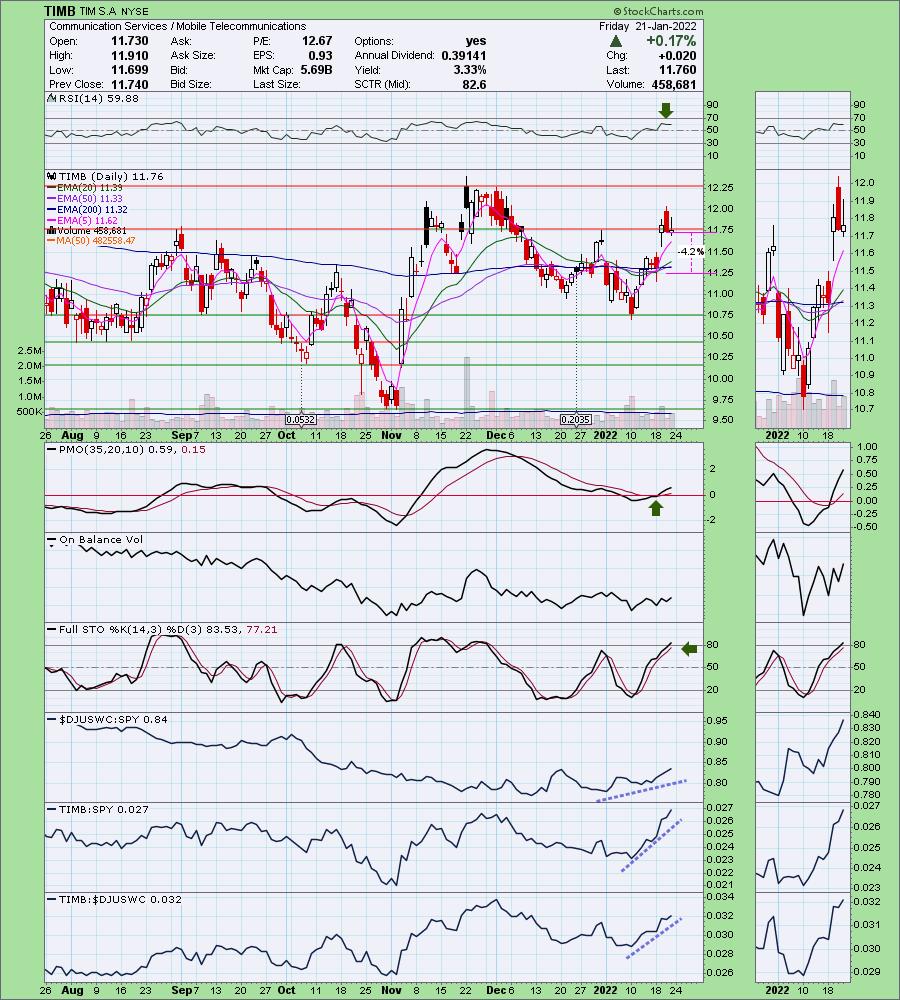
I think this one still has merit. It pulled back after breaking out above the confirmation line of the double-bottom pattern. It is technically below the confirmation line, but given the still positive indicators, I think this one could test the November highs at a minimum. I like that the stop is thin enough to protect you in case this one gets caught up in the tsunami tide of the market.
Don't forget, on Thursdays I look at reader-requested symbols, so shoot me an email at erin@decisionpoint.com. I read every email I receive and try to answer them all!
Dud:
CNX Resources Corp. (CNX)
EARNINGS: 1/27/2022 (BMO)
CNX Resources Corp. is an independent natural gas exploration, development and production companies, with operations centered in the major shale formations of the Appalachian basin. The company deploys an organic growth strategy focused on responsibly developing its resource base. The firm operates through the Marcellus Shale, and Coalbed Methane segments. CNX Resources was founded in 1864 and is headquartered in Canonsburg, PA.
Predefined Scans Triggered: New 52-week Highs.
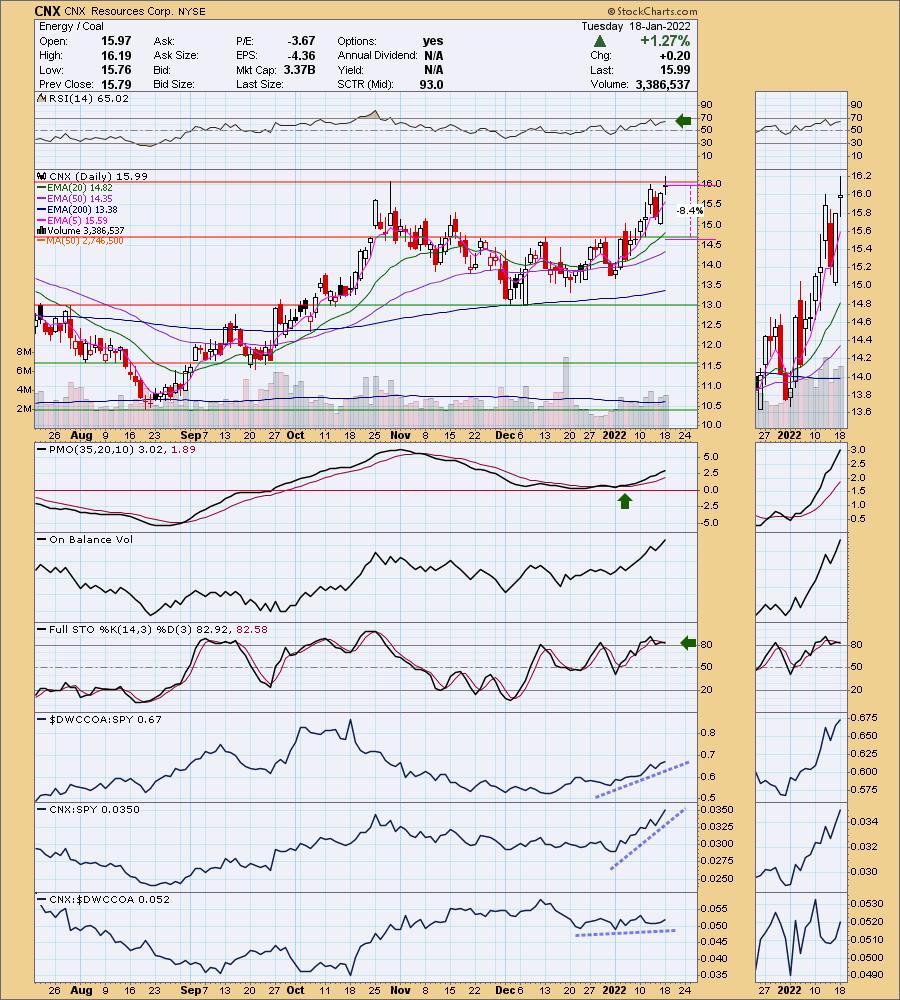
Below are the commentary and chart from Tuesday (1/18):
"CNX is up +0.13% in after hours trading. I covered CNX back on June 9th 2020 (the stop triggered and the position is closed). As noted in the predefined scan that was triggered today, CNX is hitting new 52-week highs. This group is still very bullish as shown in the relative performance against the SPY. CNX is not necessarily outperforming its group, it is staying inline with it and as long as the group itself is performing well, so will CNX. The RSI is positive and not overbought. The PMO is on a crossover BUY signal and is continuing to rise higher. It is not at all overbought. The OBV is confirming the rally and Stochastics are oscillating above 80, indicating internal strength. The stop is set below the December tops."
Below is today's chart:
Talk about bad timing! Ouch! I don't think I was off when I looked at the chart above, but such is the world of investing and market timing. The chart almost immediately went south. The indicators are terrible right now and it has sunk below support at the December highs. In all honesty, this looks like a pretty good short right now.
THIS WEEK's Sector Performance:
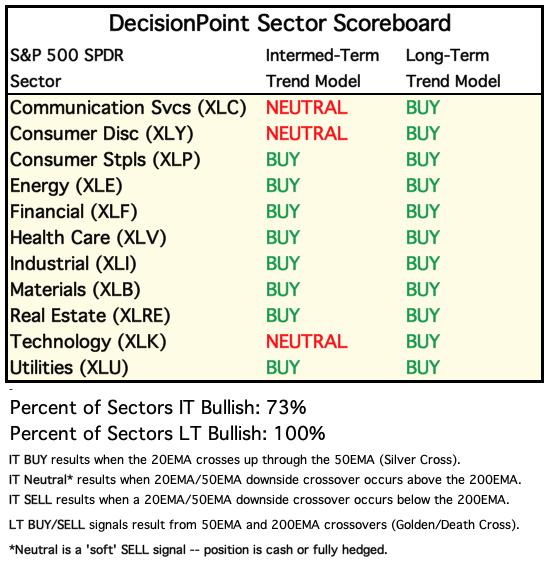
DecisionPoint Sector Scoreboard (Mechanical Trend Model Signals):
Click Here to view Carl's annotated Sector ChartList!
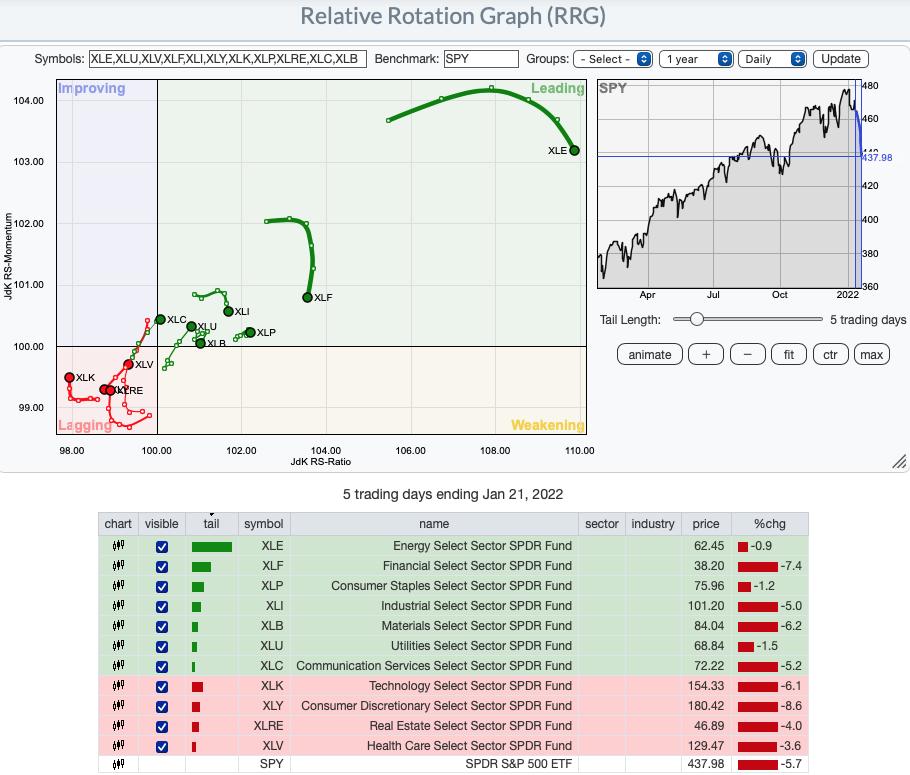
Short-term (Daily) RRG: The RRG confirms my view that Utilities will likely see some love moving forward despite not having a good sector chart. It's been out of favor and with the market dropping, this is likely going to be an area that will see positive rotation. XLC is a surprise as it also looks short-term bullish, moving into Leading and carrying a bullish northeast heading. XLP also looks good as it has reversed direction and is traveling northeast again within Leading. XLI and XLF are losing favor and beginning to make their way toward Weakening. XLE has turned over. With Crude Oil pulling back right now, that isn't surprising. XLB should hit Weakening next week. The remainder of sectors are bearishly within Lagging. XLY is most bearish as it travels with a bearish southwest heading within Lagging. The others are moving northward toward Improving, but I wouldn't be interested in these sectors until they at least reach Improving.
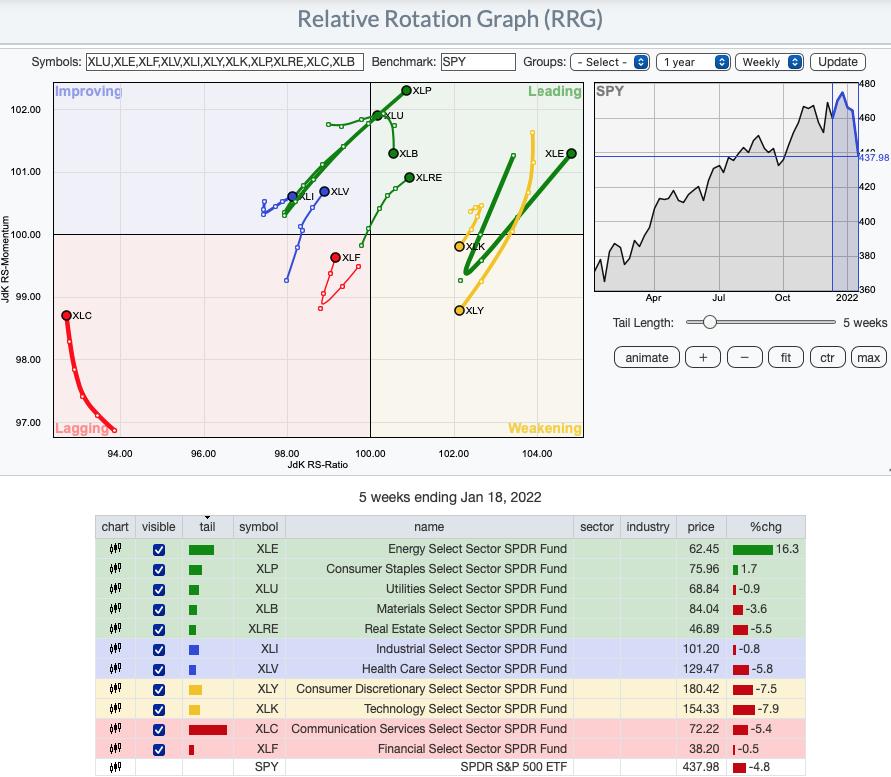
Intermediate-Term (Weekly) RRG: The longer-term RRG is telling. Aggressive sectors XLK and XLY are Weakening and getting worst as they travel southwest. Defensive sectors XLP, XLU and XLRE are in Leading and have a bullish northeast heading. XLB is still in Leading but is looking a bit more bearish as it travels toward Weakening. XLE and XLP are both strongly outperforming the SPY in the intermediate term and both have a very bullish northeast heading within Leading. XLC is making a bit of a comeback, as is XLF which has an opportunity to hit Improving soon. XLI and XLV look promising as they head toward Leading out of Improving.
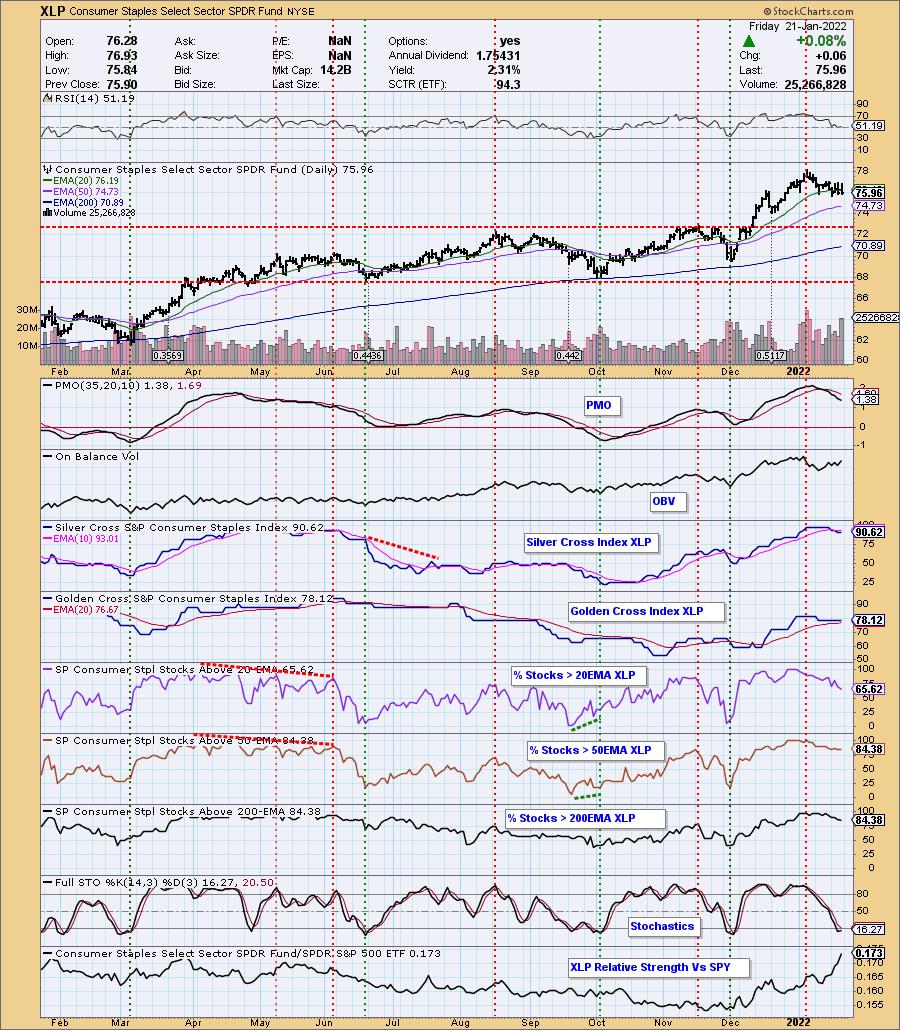
Sector to Watch: Consumer Staples (XLP)
I nearly picked Utilities (XLU), but short-term participation was at only 39% and wasn't rising yet. I went with XLP because the SCI is healthy and turned up today. The PMO is also decelerating. Price is mostly holding support at the mid-December top and the 20-day EMA (sort of). The RSI is positive and flat. Stochastics ticked up in oversold territory. The GCI is at a bullish 78% and %Stocks > 200-day EMA is 84%. That is a long-term bullish bias. Overall, I am not expanding my portfolio even into Utilities. If anything I want out.
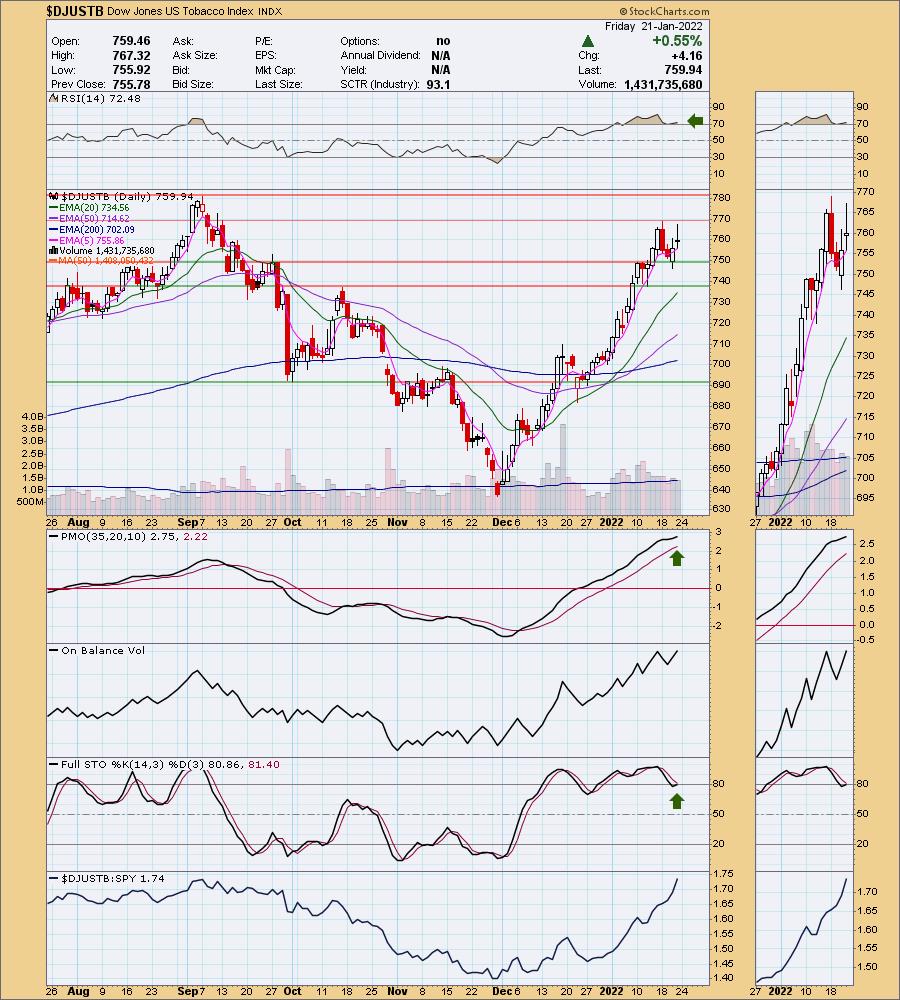
Industry Group to Watch: Tobacco ($DJUSTB)
I just went through the Industry Group Summary on StockCharts. I looked at EVERY industry group to find something that looked good. There were only a handful. Others you might want to look at would Toys, Non Durable Household Goods, Multiutilities and Miners. All others look terrible. I recommend if you have the time to click through all of those groups on the Industry Group Summary and see for yourself. I went with Tobacco because, not only is it in Consumer Staples, it has a PMO that is accelerating higher, albeit overbought. The RSI is positive but also overbought so we'll go with the winners keep on winning mentality. It looks like we had a flag in December and we have one now, so I would look for higher prices. Of the members of this group, I like Philip Morris (PM) and British Tobacco (BTI).
Go to our Sector ChartList on DecisionPoint.com to get an in depth view of all the sectors.
Have a great weekend! The next Diamonds Report is Tuesday 1/25.
- Erin
erin@decisionpoint.com
Full Disclosure: I'm about 25% exposed to the market and will drop that down next week on any strength. No strength? I'll still likely divest.
Watch the latest episode of DecisionPoint with Carl & Erin Swenlin on Mondays 7:00p EST or on the DecisionPoint playlist on the StockCharts TV YouTube channel here!
Technical Analysis is a windsock, not a crystal ball. --Carl Swenlin
NOTE: The stocks reported herein are from mechanical trading model scans that are based upon moving average relationships, momentum and volume. DecisionPoint analysis is then applied to get five selections from the scans. The selections given should prompt readers to do a chart review using their own analysis process. This letter is not a call for a specific action to buy, sell or short any of the stocks provided. There are NO sure things or guaranteed returns on the daily selection of "diamonds in the rough."
Helpful DecisionPoint Links:
DecisionPoint Shared ChartList and DecisionPoint Chart Gallery
Price Momentum Oscillator (PMO)
Swenlin Trading Oscillators (STO-B and STO-V)
(c) Copyright 2021 DecisionPoint.com