
Since yesterday's one winner was a short (down -2.30%), I decided that all three "Diamonds in the Rough" today will be short positions. My Diamond PMO Scan returned two results, both of which didn't look favorable enough. The Diamond Dog came up with some of these shorts, but the others I found using some of the predefined scans on StockCharts.com.
Based on my analysis, these three stocks should continue lower. In the Stocks to Review you'll find two more shorts and three that nearly made it on the buy side.
Today's "Diamonds in the Rough": ATHM (Short), FUTU (Short) and IMTE (Short).
Stocks to Review: PLAN (short), PDD (short), CLBK, KURA and GATX.

RECORDING LINK (1/21/2022):
Topic: DecisionPoint Diamond Mine (1/21/2022) LIVE Trading Room
Start Time: Jan 21, 2022 09:00 AM PT
Meeting Recording Link.
Access Passcode: January#21
REGISTRATION FOR 1/28 Diamond Mine:
When: Jan 28, 2022 09:00 AM Pacific Time (US and Canada)
Topic: DecisionPoint Diamond Mine (1/28/2022) LIVE Trading Room
Register in advance for this webinar HERE.
Save the registration confirmation email with login instructions in case Zoom doesn't notify you in time.

Free DP Trading Room (1/24) RECORDING LINK:
Topic: DecisionPoint Trading Room
Start Time: Jan 24, 2022 09:00 AM PT
Meeting Recording Link.
Access Passcode: January@24
For best results, copy and paste the access code to avoid typos.
Welcome to DecisionPoint Daily Diamonds, wherein I highlight ten "Diamonds in the Rough" per week. These are selected from the results of my DecisionPoint Scans, which search for stocks that could benefit from the trend and condition of the market. Remember, these are not recommendations to buy or sell, but are the most interesting of the stocks that surfaced in my scans. My objective is to save you the work of the initial, tedious culling process, but you need to apply your own analysis to see if these stocks pique your interest as well. There are no guaranteed winners here!
"Predefined Scans Triggered" are taken from the StockCharts.com using the "Symbol Summary" option instead of a "SharpChart" on the workbench.
Autohome Inc. (ATHM)
EARNINGS: 2/2/2022 (BMO)
Autohome, Inc. is a holding company, which engages in the development, operation, and maintenance of mobile applications and automobile websites. It offers used vehicles and new car dealer listings. Autohome provides professionally produced and user-generated content, a comprehensive automobile library and extensive automobile listing information to automobile consumers, covering the entire car purchase and ownership cycle. The company was founded in June 2008 and is headquartered in Beijing, China.
Predefined Scans Triggered: P&F High Pole.
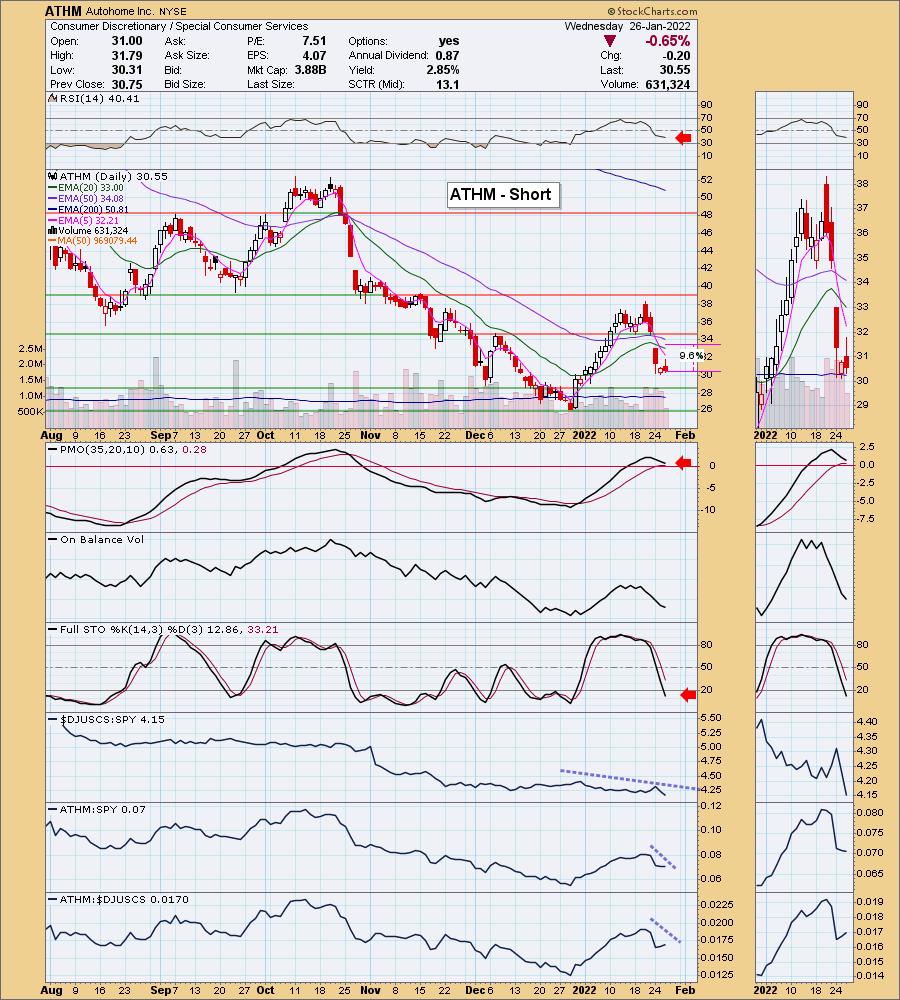
ATHM is unchanged in after hours trading. Remember, these are shorts, so the "stop" level is at a higher price. The chart is ugly right now with a negative RSI that is not oversold, nearing PMO crossover SELL signal just above the zero line and Stochastics that are falling in negative territory. The group isn't performing well and neither is ATHM. The stop is deep. My main concern here is price getting back above the 20-day EMA. I don't think it will yet, but that is another option for setting an upside stop that isn't as deep.
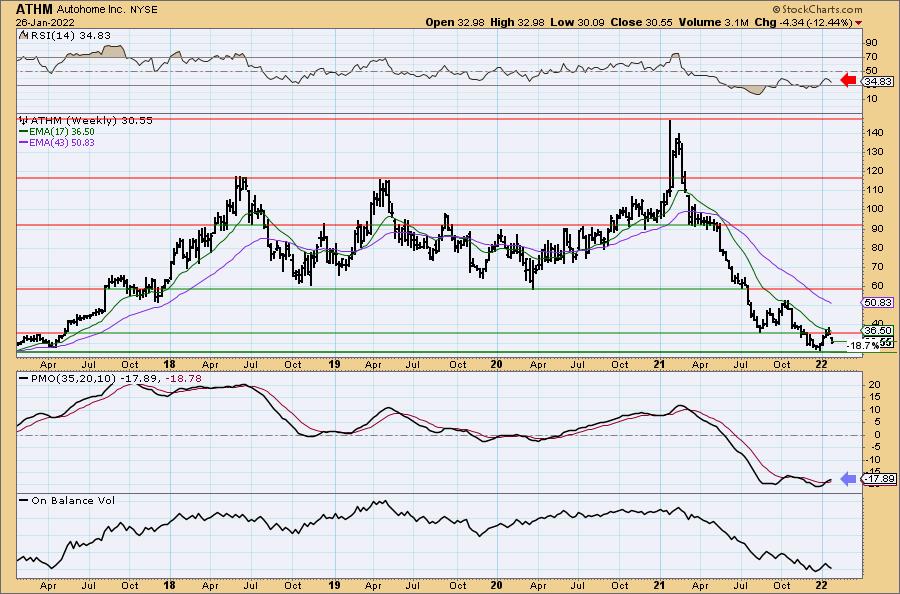
The weekly chart shows that the weekly PMO is on a new crossover BUY signal. That triggered on the rally of the past month. With price failing at the 17-week EMA, I believe it will move lower. The weekly RSI is falling in negative territory. If it just reaches support at the recent low, that would be an over 18% gain.
Futu Holdings Ltd. (FUTU)
EARNINGS: 3/16/2022 (BMO)
Futu Holdings Ltd. is an advanced technology company, which engages in online brokerage and wealth management services. It provides investing services through its proprietary digital platforms, Futubull and moomoo that allows investors to trade securities and invest in fund products. The firm's fee-generating services include trade execution, as well as margin financing and securities lending, which allow its clients to trade securities, such as stocks, ETFs, warrants, options and futures, across different markets. The company was founded by Leaf Hua Li on December 18, 2007 and is headquartered in Hong Kong.
Predefined Scans Triggered: P&F Double Bottom Breakout.
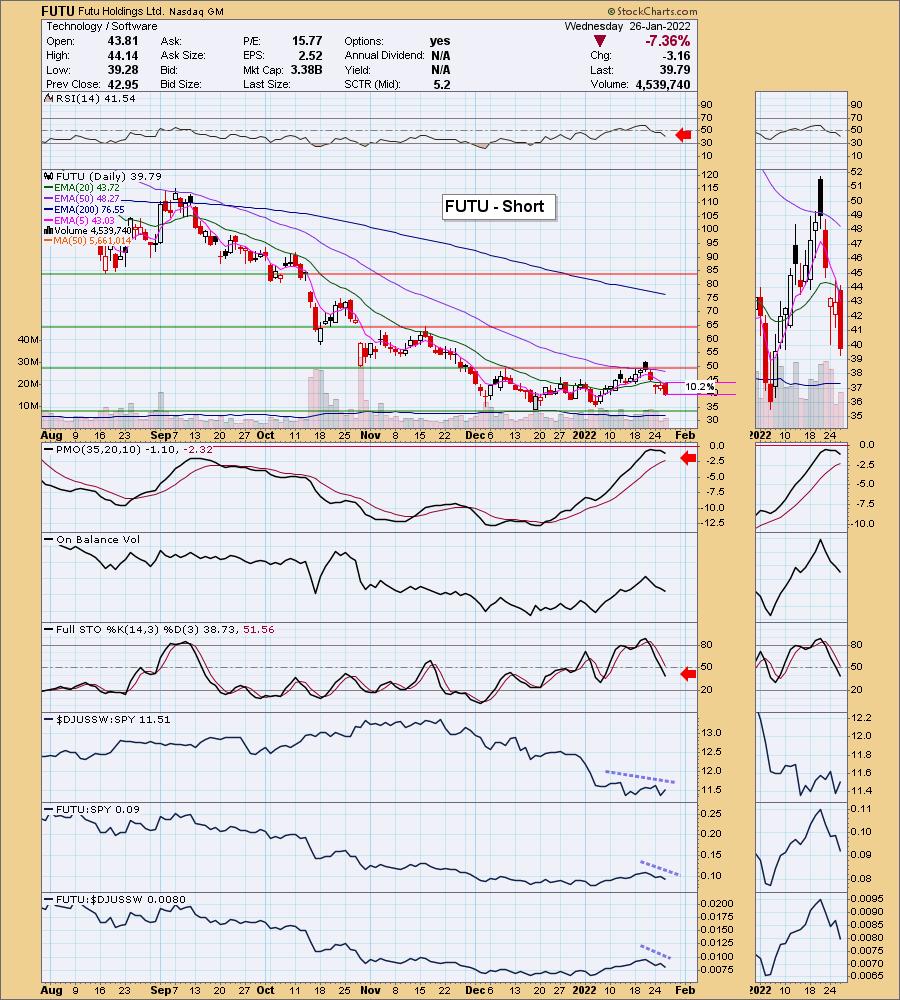
FUTU is up +0.08% in after hours trading. It had a huge decline today so it could muster a rally tomorrow, that's one reason the stop is up past 10%. Price failed to overcome the 50-day EMA on a bearish black candlestick. Now it has fallen below the 5/20-day EMAs. The PMO has topped below the zero line, and the RSI is negative and not oversold. Stochastics are falling and are in negative territory. Relative performance is not good.
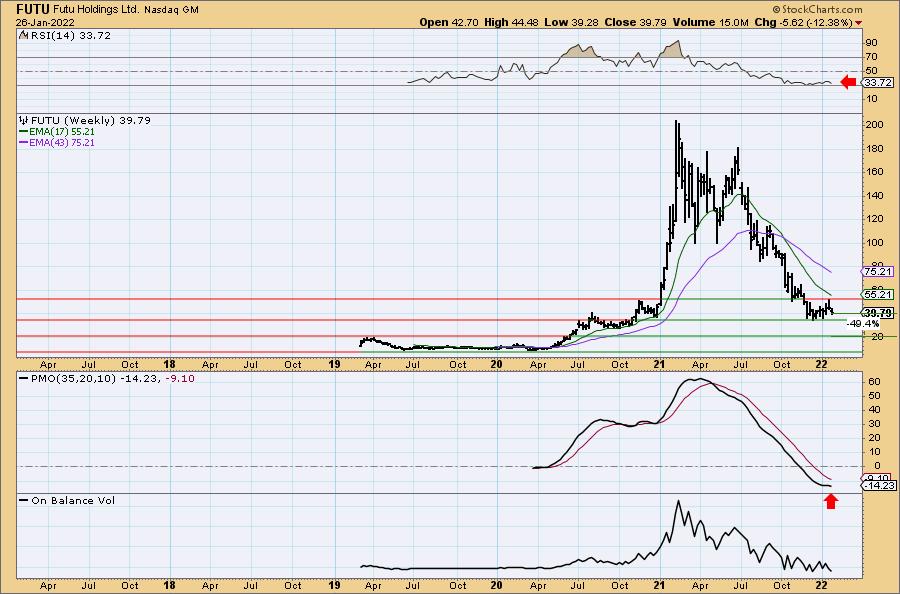
The weekly chart shows price finding support at the mid-2020 high and late-2020 low. However, once it reached the late-2020 high, it failed. The weekly RSI is negative and the weekly PMO is topping below its signal line. It is a 15% gain if it tests current support, but I believe it will fall further and test support at the 2019 high.
Integrated Media Technology Limited (IMTE)
EARNINGS: N/A
Integrated Media Technology Ltd. is a technology investment, product development and distribution company. It engages in developing, manufacturing and distributing of 3-dimension display equipment and wholesales audio products. The firm focuses on the business activities in the sale and distribution of autostereoscopic 3D display, 3D conversion equipment and software, development and sale of 3D autostereoscopic technology and provision of 3D consultancy services. Its products include Glasses-free 3D Video Wall, Glasses-free 4K 3D Display, 4K3DPro Super Workstation, Visumotion, Glasses-free 3D Mobile Devices and MemtoTM Picture Frames. The company was founded on August 8, 2008 and is headquartered in Adelaide, Australia.
Predefined Scans Triggered: Parabolic SAR Sell Signals and P&F Double Bottom Breakout.
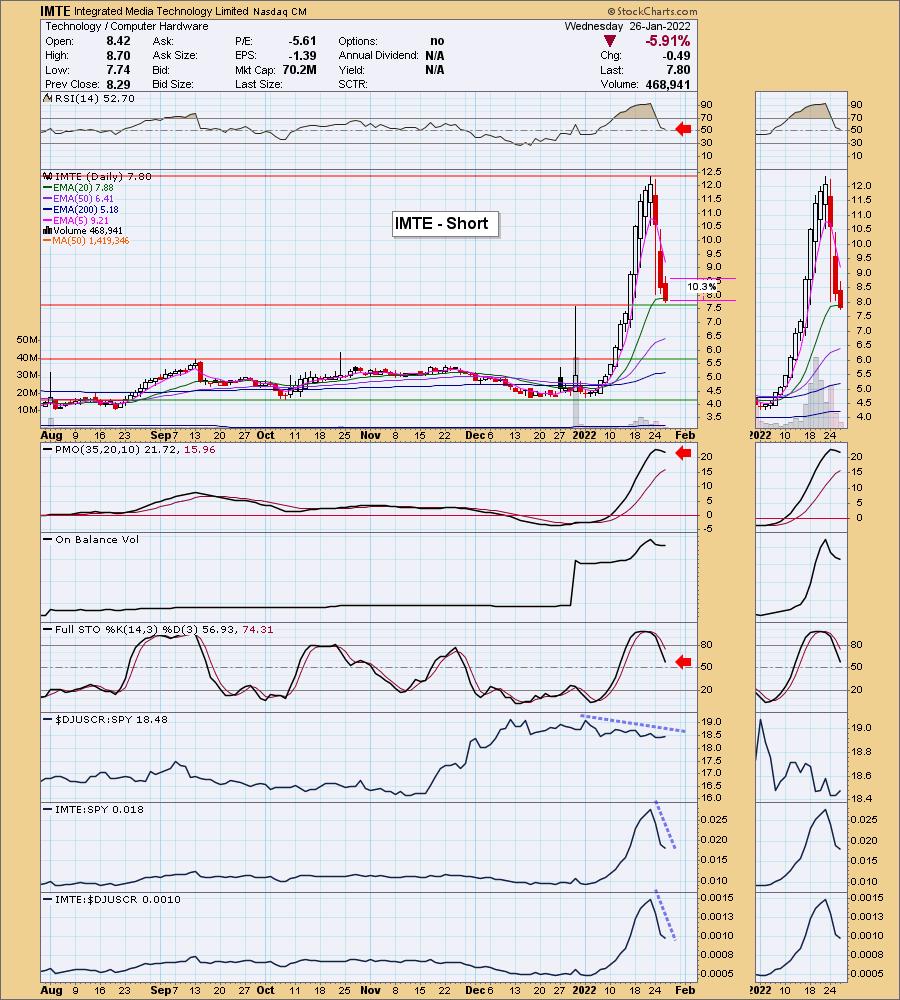
IMTE is up +0.51% in after hours trading. It was a deep decline today and therefore I'm not surprised to see some after hours buying. Price failed to hold the 20-day EMA as support. It is sitting on the intraday spike from late 2021, but that PMO top and falling RSI suggest further downside. Stochastics in particular, look very negative. Relative performance has been terrible. This one is either going to rebound here or continue to fall. This looks like a parabolic breakdown and typically those breakdowns don't finish until price reaches the prior basing pattern. In this case, that would be around $5.50. The stop is deep out of necessity given today's nearly 6% decline. Obviously you can take advantage of timing an entry and likely reduce that stop level somewhat.
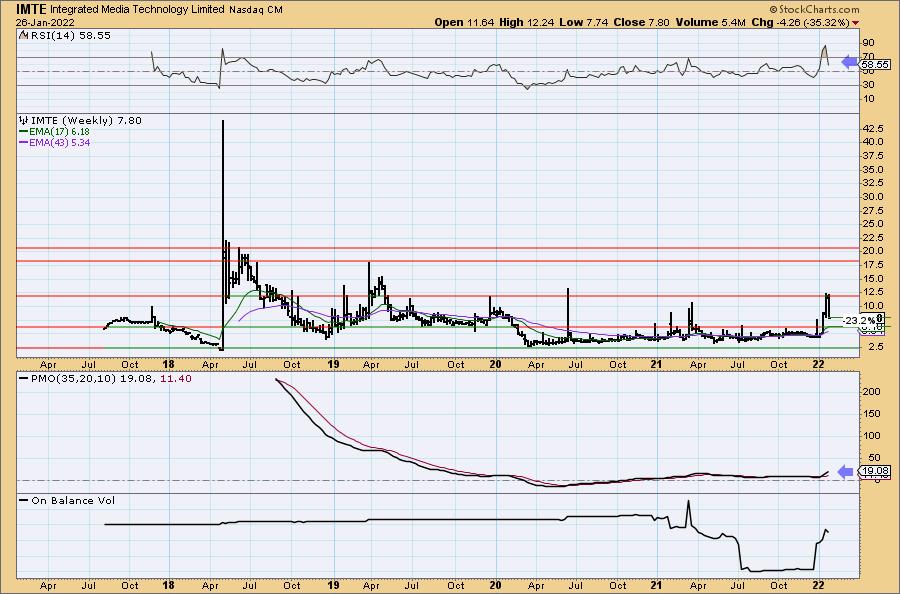
Price was turned away at strong resistance at the top of the wide trading channel between $2.50 and $12.50. The weekly PMO is a problem as it does look bullish. The weekly RSI is falling but is still in positive territory. The next level of strong support is at the 2021 tops. A test of that level would require a drop of more than 23%.
Don't forget, on Thursdays I look at reader-requested symbols, click HERE to shoot me an email. I read every email I receive and try to answer them all!
Current Market Outlook:
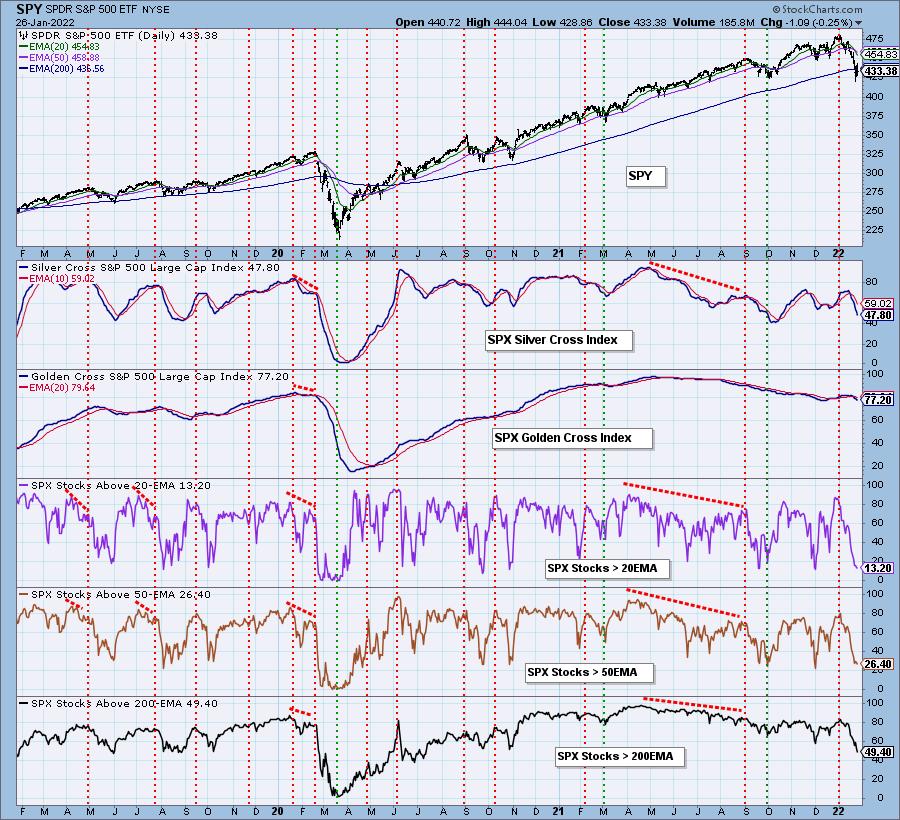
Market Environment: It is important to consider the odds for success by assessing the market tides. The following chart uses different methodologies for objectively showing the depth and trend of participation for intermediate- and long-term time frames.
- The Silver Cross Index (SCI) shows the percentage of SPX stocks on IT Trend Model BUY signals (20-EMA > 50-EMA)
- The Golden Cross Index (GCI) shows the percentage of SPX stocks on LT Trend Model BUY signals (50-EMA > 200-EMA)
Don't forget that as a "Diamonds" member, you have access to our GCI/SCI curated ChartList on DecisionPoint.com. You'll find it under "Members Only" links on the left side on the Blogs and Links Page.
Here is the current chart:
Full Disclosure: I'm 10% invested and 90% is in 'cash', meaning in money markets and readily available to trade with. I shed another position and have four currently. At this point, they are buy and holds, but if the charts turn south, they will not stay.
I'm required to disclose if I currently own a stock and/or may buy it within the next 72 hours.
Happy Charting!
- Erin
"Technical Analysis is a windsock, not a crystal ball." - Carl Swenlin
(c) Copyright 2022 DecisionPoint.com
Watch the latest episode of DecisionPoint with Carl & Erin Swenlin on Mondays 7:00p EST or on the DecisionPoint playlist on the StockCharts TV YouTube channel here!
NOTE: The stocks reported herein are from mechanical trading model scans that are based upon moving average relationships, momentum and volume. DecisionPoint analysis is then applied to get five selections from the scans. The selections given should prompt readers to do a chart review using their own analysis process. This letter is not a call for a specific action to buy, sell or short any of the stocks provided. There are NO sure things or guaranteed returns on the daily selection of "Diamonds in the Rough."
Helpful DecisionPoint Links:
DecisionPoint Shared ChartList and DecisionPoint Chart Gallery
Price Momentum Oscillator (PMO)
Swenlin Trading Oscillators (STO-B and STO-V)
For more links, go to DecisionPoint.com