
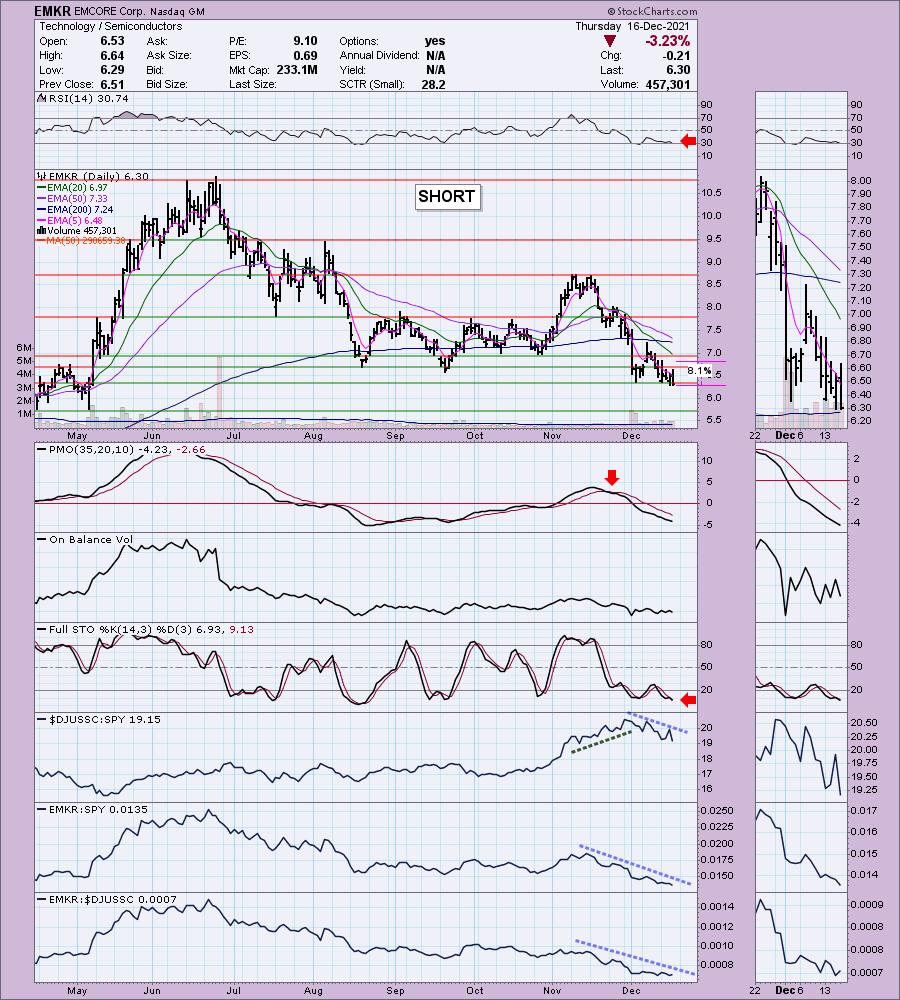
While I generally don't short stocks, the reader requested shorting opportunity looks very good. I was given the pick yesterday and the stock was down -3.23% today (hope you got in, Allen!). It will likely fall further given it is in the weakening Semiconductor industry group.
Thank you to all who sent requests! I believe we have an excellent group here. My personal selection is from my Diamond PMO scan results today, ANI Pharmaceuticals (ANIP).
Don't forget to register for tomorrow's Diamond Mine trading room! You'll find the link here and in the section below.
Today's "Diamonds in the Rough": ANIP, CLX, EMKR (Short), PFG and TMO.

RECORDING LINK Wednesday (12/10):
Topic: DecisionPoint Diamond Mine (12/10/2021) LIVE Trading Room
Start Time: Dec 10, 2021 09:00 AM
Meeting Recording Link.
Access Passcode: December#10
REGISTRATION FOR Friday 12/17 Diamond Mine:
When: Dec 17, 2021 09:00 AM Pacific Time (US and Canada)
Topic: DecisionPoint Diamond Mine (12/17/2021) LIVE Trading Room
Register in advance for this webinar HERE.
Save the registration confirmation email with login instructions in case Zoom doesn't notify you in time.

Free DP Trading Room (12/13) RECORDING LINK:
Topic: DecisionPoint Trading Room
Start Time: Dec 13, 2021 09:00 AM
Meeting Recording Link.
Access Passcode: December+13
For best results, copy and paste the access code to avoid typos.
Welcome to DecisionPoint Daily Diamonds, wherein I highlight ten "Diamonds in the Rough" per week. These are selected from the results of my DecisionPoint scans, which search for stocks that could benefit from the trend and condition of the market. Remember, these are not recommendations to buy or sell, but are the most interesting of the stocks that surfaced in my scans. My objective is to save you the work of the initial, tedious culling process, but you need to apply your own analysis to see if these stocks pique your interest as well. There are no guaranteed winners here!
ANI Pharmaceuticals, Inc. (ANIP)
EARNINGS: 3/8/2022 (BMO)
ANI Pharmaceuticals, Inc. is a pharmaceutical company, which engages in developing, manufacturing, and marketing branded and generic prescription pharmaceuticals. Its areas of product development include narcotics, oncolytics, hormones and steroids, and complex formulations involving extended release and combination products. The company was founded on August 29, 1996 and is headquartered in Baudette, MN.
Predefined Scans Triggered: None.
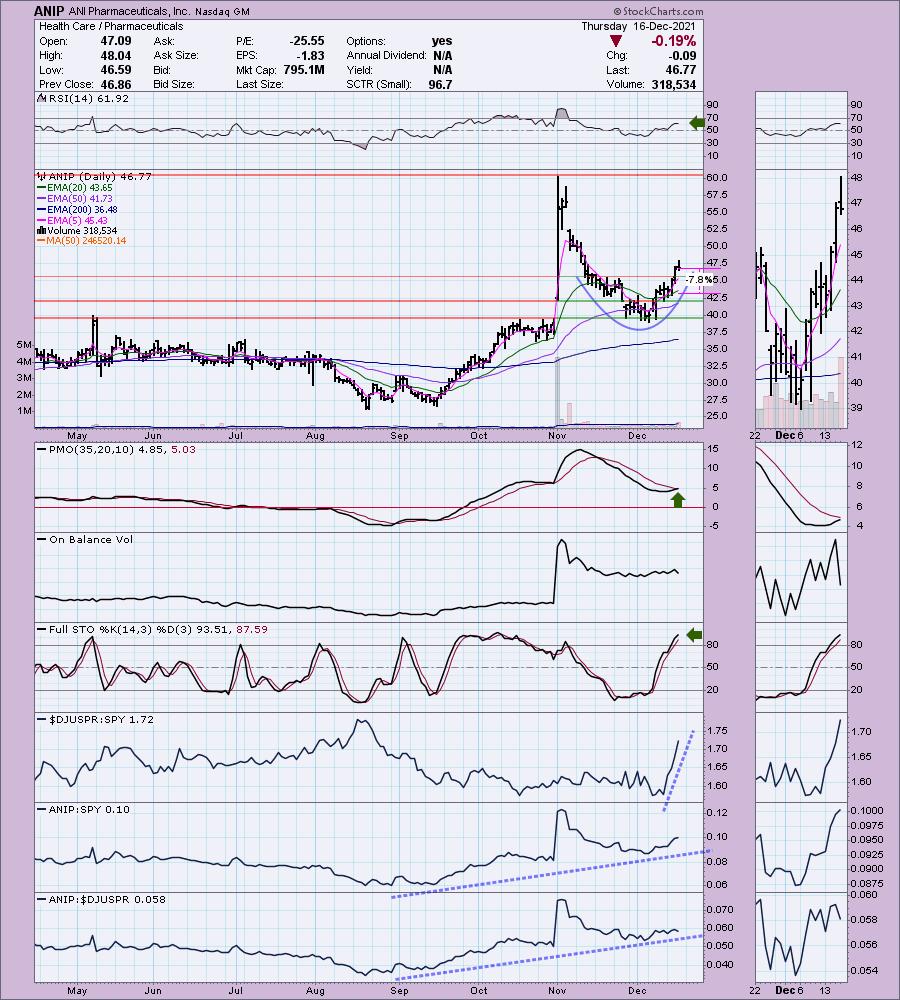
ANIP is unchanged in after hours trading. I liked the cup shaped base after a bounce off the 50-EMA. The RSI is positive and the PMO is rising toward a crossover BUY signal. Stochastics are above 80 and still rising. The industry group is on fire right now but it is getting toward relative highs. This stock tends to outperform its group and consequently has been outperforming the SPY with the exception of the large pop and drop. The stop is set below the 20-EMA.
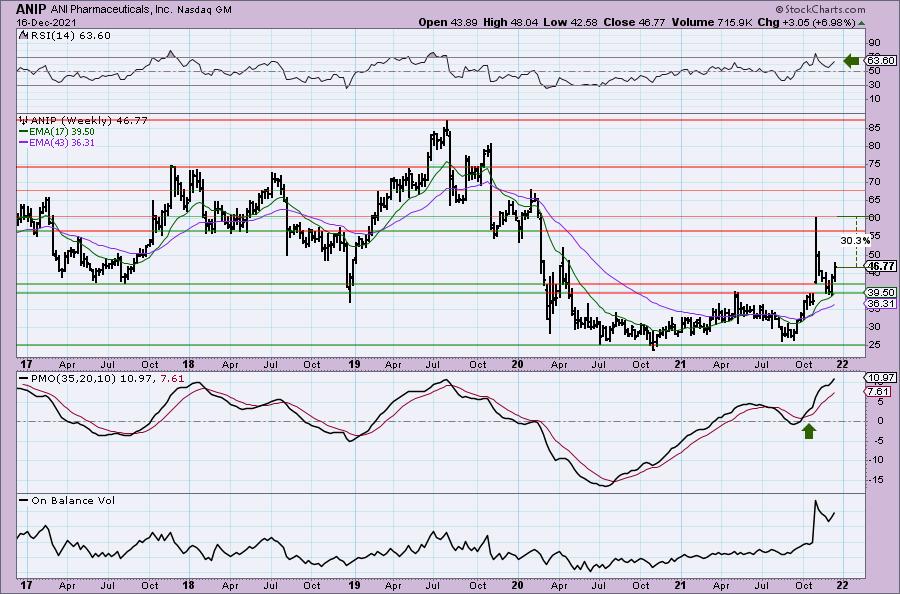
The weekly chart looks great given the weekly PMO crossover BUY signal and the positive RSI. If I had to complain, the PMO is very overbought, but other than that the upside target of 30%+ seems reachable. This one is tempting me to buy.
Clorox Co. (CLX)
EARNINGS: 2/3/2022 (AMC)
The Clorox Co. engages in the manufacture and marketing of consumer and professional products. It operates through the following business segments: Cleaning, Lifestyle, Household, and International. The Cleaning segment consists of laundry, home care, and professional products marketed and sold in the United States. The Household segment composes of charcoal, cat litter and plastic bags, wraps, and container products. The Lifestyle segment includes food products, water-filtration systems, filters, and all natural personal care products, and dietary supplements. The International segment covers products sold outside the United States, excluding natural personal care products. The company was founded by Edward Hughes, Charles Husband, William Hussey, Rufus Myers, and Archibald Taft on May 3, 1913 and is headquartered in Oakland, CA.
Predefined Scans Triggered: Moved Above Upper Keltner Channel and P&F Double Top Breakout.
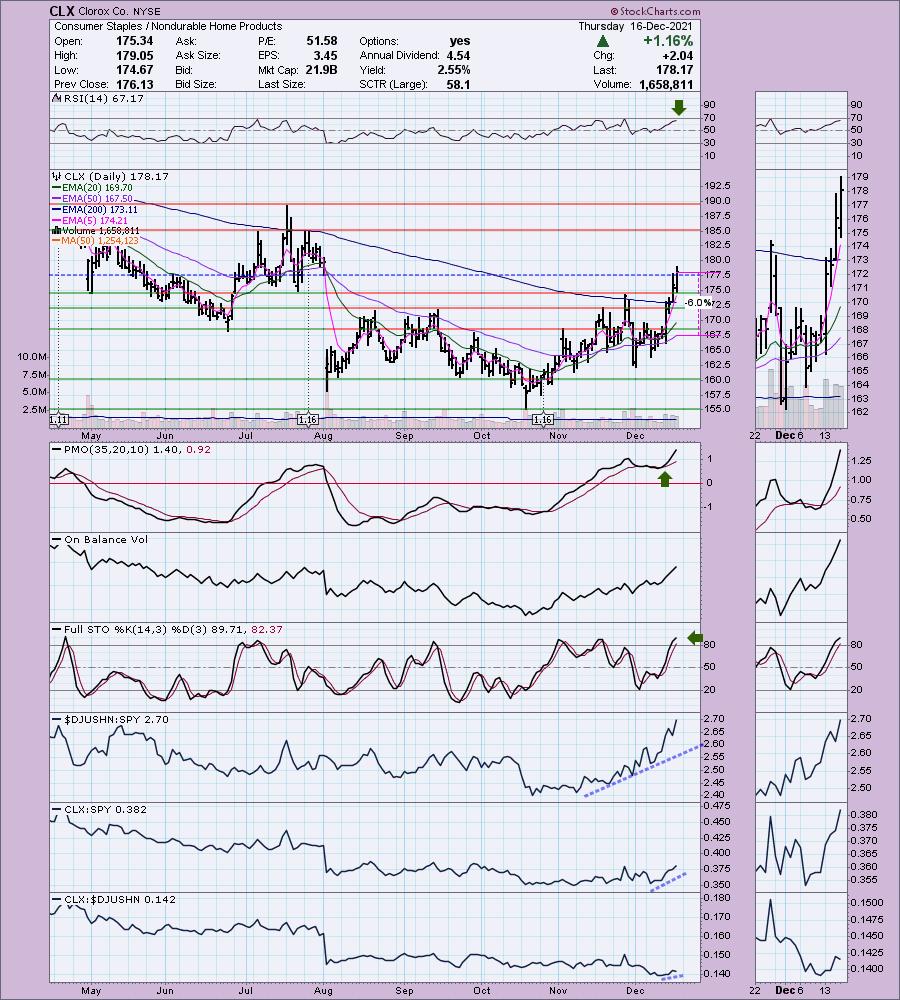
CLX is up +0.19% in after hours trading. I covered Clorox on April 9th 2020. The position was up over 30% at the 2020 high. It took until the October 2021 low for the position to be stopped out. However, there were plenty of warning signs that would've gotten you out long before the stop was hit.
There's a lot to like here. Price closed the August gap today after closing above the 200-EMA for the first time since the November pop and drop. This breakout looks very good and with this sector and this industry group outperforming by a mile, I like this one. The RSI is positive and the PMO is rising on a crossover BUY signal. Stochastics are positive. The stop can be set thinly at the 50-EMA.
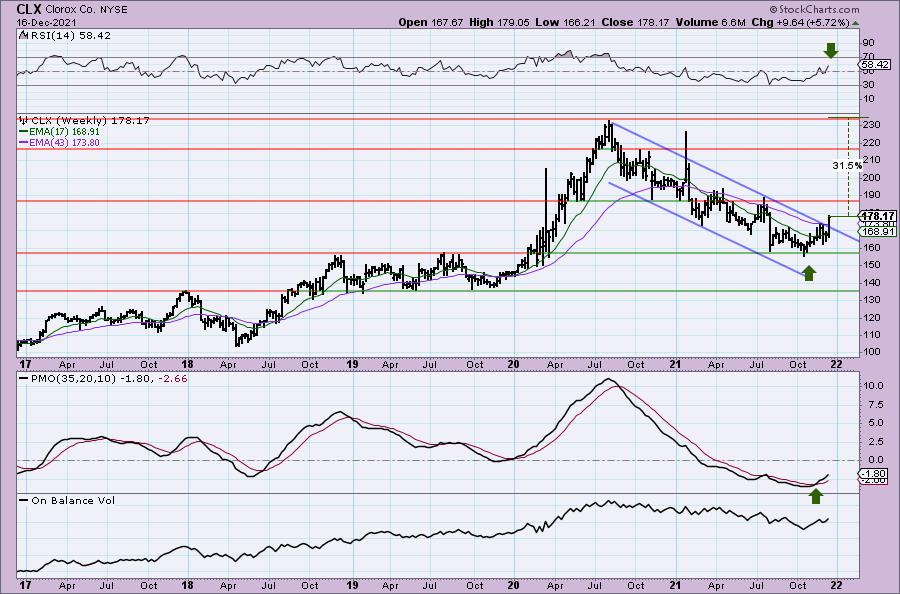
The weekly chart shows us that the long-term declining trend channel has been broken. The weekly PMO has just triggered an oversold crossover BUY signal and the RSI is positive and rising. Upside potential is over 31%. I may buy this one tomorrow or Monday depending on how it acts.
EMCORE Corp. (EMKR)
EARNINGS: 2/2/2022 (AMC)
EMCORE Corp. engages in the manufacture and provision of mixed-signal optics products. It operates through the Aerospace and Defense segment and Broadband segment. The Aerospace and Defense segment produces navigation and inertial sensing products, and defense optoelectronics. The Broadband segment manufactures community antenna television (CATV) lasers and transmitters, chip devices, and other optical products. The company was founded in 1984 and is headquartered in Alhambra, CA.
Predefined Scans Triggered: P&F Double Bottom Breakout.
EMKR is unchanged in after hours trading. Semiconductors are taking it on the chin and if the market remains weak (which I believe it will), EMKR should move lower. The RSI is negative and not yet in oversold territory. The PMO is falling on a SELL signal. Stochastics are oversold, but they are pointed downward. Notice that when Semis were outperforming, EMKR did not join in the fun. It is still underperforming. Remember this is a short position so the stop level is higher than today's price. I set it just above the August/September bottoms.
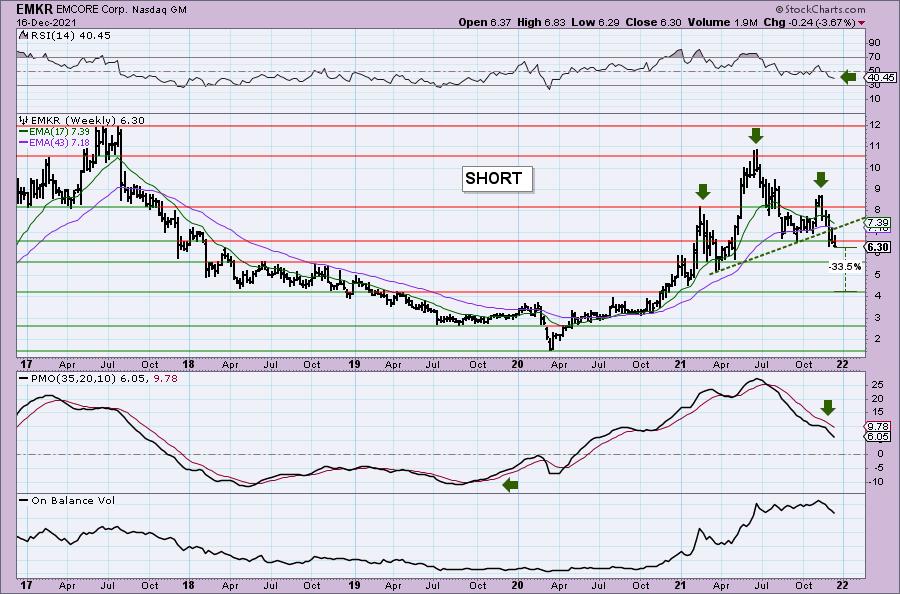
The weekly chart is just as ugly. There is a negative weekly RSI and the weekly PMO has accelerated lower after a futile attempt to reverse. I also see a messy bearish head and shoulders pattern. Price has broken below the rising neckline to confirm the pattern. It could find support at late 2018 highs. That would still result in an over 11% gain. However, I would look for it to fall further to test 2018 lows.
Principal Financial Group (PFG)
EARNINGS: 1/27/2022 (AMC)
Principal Financial Group, Inc. is a financial company, which offers financial products and services to businesses, individuals and institutional clients. It specializes in retirement solutions, insurance, and investment products through its diverse family of financial services companies and national network of financial professionals. It operates its business through following segments: Retirement and Income Solutions, Principal Global Investors, Principal International, U.S. Insurance Solutions and Corporate. The Retirement and Income Solutions segment provides retirement and related financial products and services primarily to businesses, their employees and other individuals. The Principal Global Investors segment provides asset management services to asset accumulation business, insurance operations, corporate segment and third party clients and also refers to mutual fund business. The Principal International segment offers pension accumulation products and services, mutual funds, asset management, income annuities and life insurance accumulation products. The U.S. Insurance Solutions segment operates through two divisions. Specialty benefits insurance division consists of group dental and vision insurance, individual and group disability insurance, group life insurance and non-medical fee-for-service claims administration. Individual life insurance division provides solutions for small & medium-sized businesses. The Corporate segment manages the assets representing capital that has not been allocated to any other segment. The company was founded by Edward A. Temple in 1879 and is headquartered in Des Moines, IA.
Predefined Scans Triggered: New CCI Buy Signals, New 52-week Highs, Stocks in a New Uptrend (Aroon) and Filled Black Candles.
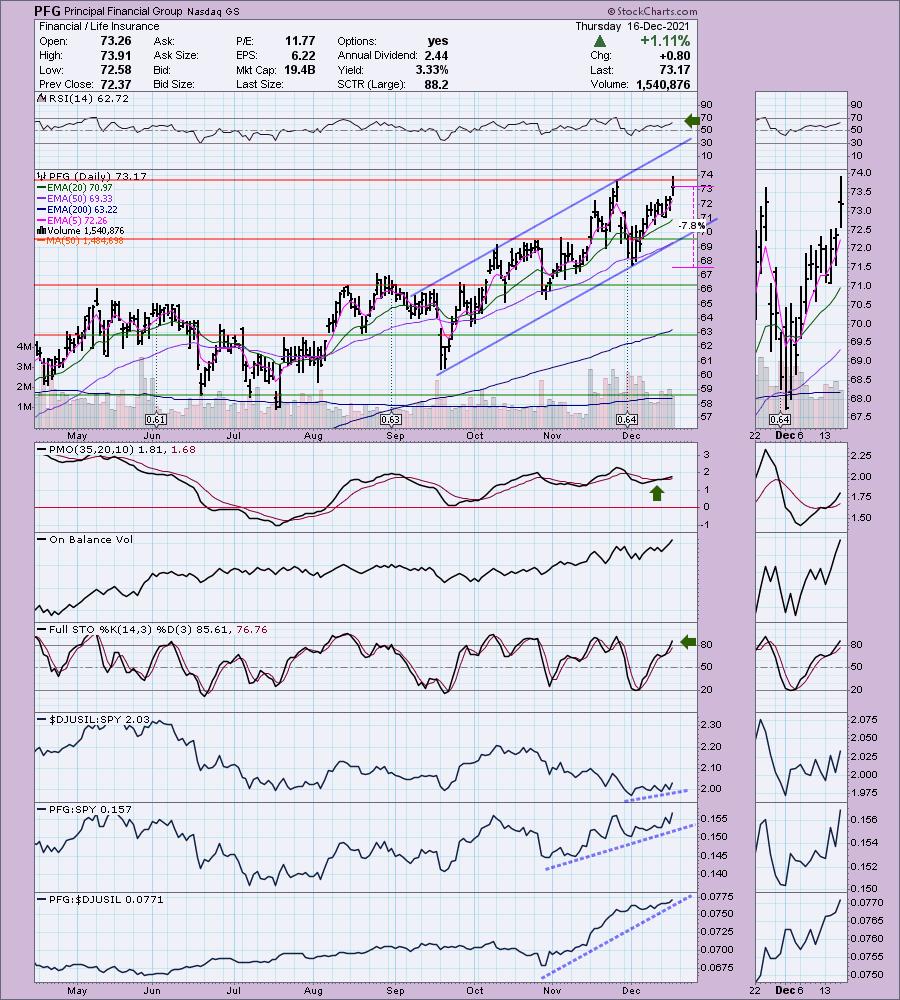
PFG is unchanged in after hours trading. I mentioned recently that Insurance stocks were beginning to hit my scan results. PFG is one of the leaders in this industry group--just look at the relative strength line! It is on its way to making new all-time highs with a positive RSI and new PMO crossover BUY signal. Stochastics are positive. Price has been in a wide rising trend channel so the risk is that once it hits the top of the channel it will pull back. I think it'll be just fine and new support at the November top would hold. The stop is set below the December low, but you could easily tighten this up and dump it if it loses its rising trend or the 50-EMA.
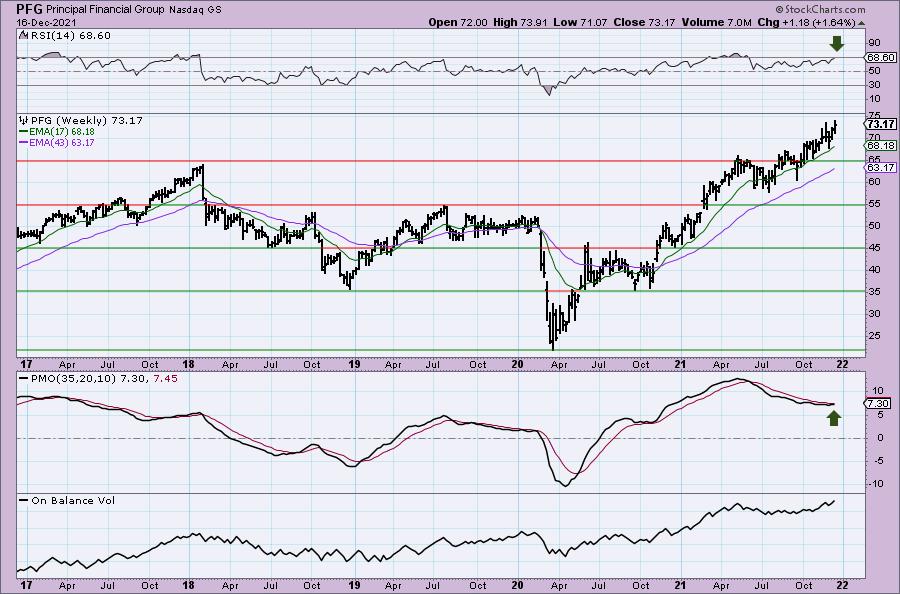
The weekly chart shows that a new weekly PMO crossover BUY signal is imminent. The RSI is positive. Since price is at all-time highs, I would consider an upside target of 18% or $86.34.
Thermo Fisher Scientific Inc. (TMO)
EARNINGS: 1/31/2022 (BMO)
Thermo Fisher Scientific, Inc. engages in the provision of analytical instruments, equipment, reagents and consumables, software and services for research, analysis, discovery, and diagnostics. It operates through the following segments: Life Sciences Solutions, Analytical Instruments, Specialty Diagnostics, and Laboratory Products and Services. The Life Sciences Solutions segment comprises of portfolio of reagents, instruments, and consumables used in biological and medical research, discovery and production of new drugs, and vaccines, as well as diagnosis of disease. The Analytical Instruments segment offers instruments, consumables, software, and services that are used for a range of applications in the laboratory on the production line and in the field. The Specialty Diagnostics segment gives diagnostic test kits, reagents, culture media, instruments, and associated products used to increase the speed and accuracy of diagnoses. The Laboratory Products and Services segment involves in providing everything needed for the laboratory, including a combination of self-manufactured and sourced products for customers in research, academic, government, industrial, and healthcare settings. The company was founded on October 11, 1960 and is headquartered in Waltham, MA.
Predefined Scans Triggered: Parabolic SAR Buy Signals and P&F Double Top Breakout.
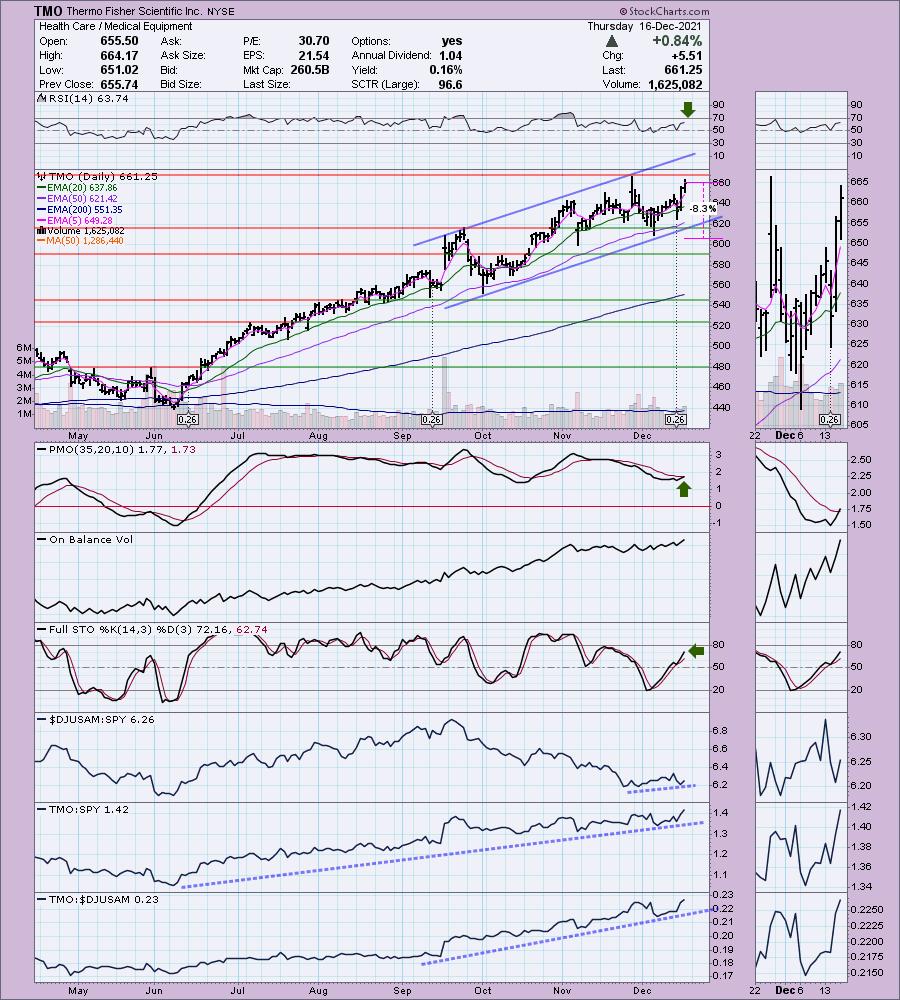
TMO is down -0.83% in after hours trading. I covered TMO in the December 2nd 2020 Diamonds Report. The position nearly triggered its stop in March and June, but the position is still open and is up +38.07%.
Price is about to breakout to all-time highs. The RSI is positive and the PMO triggered a crossover BUY signal today. Stochastics are rising in positive territory. Relative strength shows TMO is a big time outperformer against the SPY and its group. The stop is set at the December low, but I wouldn't want this one if it closed outside the rising trend channel and the 50-EMA.
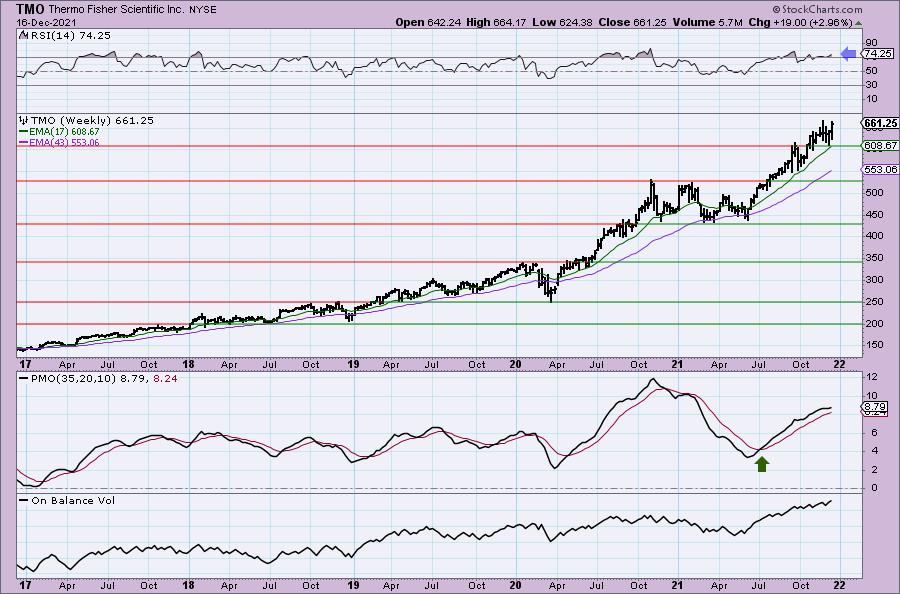
The weekly RSI is overbought and has been for awhile. I'm okay with that for now given the PMO is still rising on a crossover BUY signal. Since it is at all-time highs, I would consider an upside target of 18% or $780.28.
Don't forget, on Thursdays I look at reader-requested symbols, click HERE to shoot me an email. I read every email I receive and try to answer them all!
Current Market Outlook:
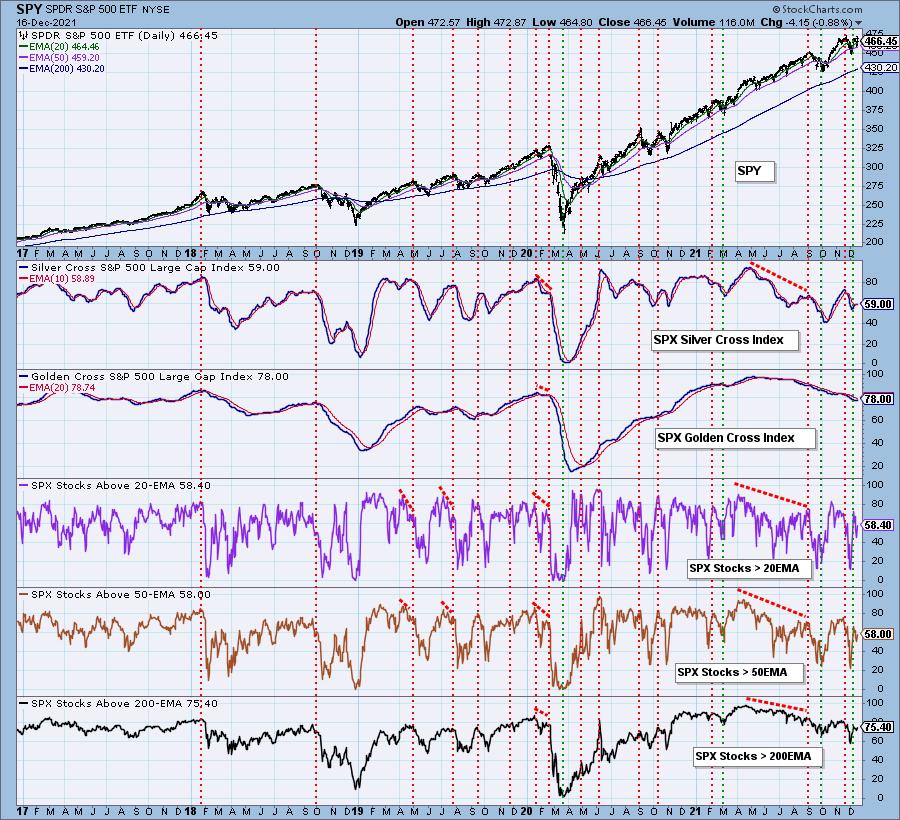
Market Environment: It is important to consider the odds for success by assessing the market tides. The following chart uses different methodologies for objectively showing the depth and trend of participation for intermediate- and long-term time frames.
- The Silver Cross Index (SCI) shows the percentage of SPX stocks on IT Trend Model BUY signals (20-EMA > 50-EMA)
- The Golden Cross Index (GCI) shows the percentage of SPX stocks on LT Trend Model BUY signals (50-EMA > 200-EMA)
Don't forget that as a "Diamonds" member, you have access to our GCI/SCI curated ChartList on DecisionPoint.com. You'll find it under "Members Only" links on the left side on the Blogs and Links Page.
Here is the current chart:
Full Disclosure: I'm 10% invested and 90% is in 'cash', meaning in money markets and readily available to trade with. I'm considering a purchase of CLX and WHR depending on the 5-minute candlestick charts and overall market behavior.
I'm required to disclose if I currently own a stock and/or may buy it within the next 72 hours.
Technical Analysis is a windsock, not a crystal ball.
Happy Charting!
- Erin
erin@decisionpoint.com
Watch the latest episode of DecisionPoint with Carl & Erin Swenlin on Mondays 7:00p EST or on the DecisionPoint playlist on the StockCharts TV YouTube channel here!
NOTE: The stocks reported herein are from mechanical trading model scans that are based upon moving average relationships, momentum and volume. DecisionPoint analysis is then applied to get five selections from the scans. The selections given should prompt readers to do a chart review using their own analysis process. This letter is not a call for a specific action to buy, sell or short any of the stocks provided. There are NO sure things or guaranteed returns on the daily selection of "Diamonds in the Rough."
Helpful DecisionPoint Links:
DecisionPoint Shared ChartList and DecisionPoint Chart Gallery
Price Momentum Oscillator (PMO)
Swenlin Trading Oscillators (STO-B and STO-V)
For more links, go to DecisionPoint.com