
Healthcare (XLV) only finished higher today by +0.42%, but healthcare stocks flooded my scan results. Most stocks that I looked at in my scan results popped today with many of them up over 4%. These pops could turn out to be fake out breakouts. The market is volatile and I believe at best we will see a move to challenge new all-time highs, but ultimately fail.
I found five stocks that I think you should see. However, I would consider watch listing rather than purchasing. I will tell you, I'm not expanding my exposure from 10%.
I listed quite a few "stocks to review". I liked the set up on most of these, but they could be setting up for a pullback given they were up so high today.
THIS WEEK's HOLIDAY SCHEDULE:
I will present five "Diamonds in the Rough" today and tomorrow. On Thursday, we will hold the Diamond Mine and I will do a Recap of the ten stocks picked this week.
Today's "Diamonds in the Rough": ICUI, MEDP, OMI, SGEN and XENE.
"Stocks to Review": SCHL, WH, DXCM, VRAR, BGS, AMR, GPOR, RGLD, AUPH, TGH and CYBR.

RECORDING LINK Friday (12/17):
Topic: DecisionPoint Diamond Mine (12/17/2021) LIVE Trading Room
Start Time: Dec 17, 2021 09:00 AM
Meeting Recording Link.
Access Passcode: December@17
REGISTRATION FOR Thursday 12/23 Diamond Mine:
When: Dec 23, 2021 09:00 PM Pacific Time (US and Canada)
Topic: DecisionPoint Diamond Mine (THURSDAY, 12/23/2021) LIVE Trading Room
Register in advance for this webinar HERE.
Save the registration confirmation email with login instructions in case Zoom doesn't notify you in time.

There was no free trading room on 12/20.
Free DP Trading Room (12/13) RECORDING LINK:
Topic: DecisionPoint Trading Room
Start Time: Dec 13, 2021 09:00 AM
Meeting Recording Link.
Access Passcode: December+13
For best results, copy and paste the access code to avoid typos.
Welcome to DecisionPoint Daily Diamonds, wherein I highlight ten "Diamonds in the Rough" per week. These are selected from the results of my DecisionPoint scans, which search for stocks that could benefit from the trend and condition of the market. Remember, these are not recommendations to buy or sell, but are the most interesting of the stocks that surfaced in my scans. My objective is to save you the work of the initial, tedious culling process, but you need to apply your own analysis to see if these stocks pique your interest as well. There are no guaranteed winners here!
ICU Medical, Inc. (ICUI)
EARNINGS: 2/24/2022 (AMC)
ICU Medical, Inc. engages in the development, manufacture, and sale of innovative medical devices used in vascular therapy and critical care applications. Its product portfolio includes intravenous smart pumps, sets, connectors, closed transfer devices for hazardous drugs, cardiac monitoring systems, IV solutions, IV smart pumps with pain management and safety software technology, dedicated and non-dedicated IV sets and needle-free connectors. The company was founded by George A. Lopez in 1984 and is headquartered in San Clemente, CA.
Predefined Scans Triggered: Filled Black Candles.
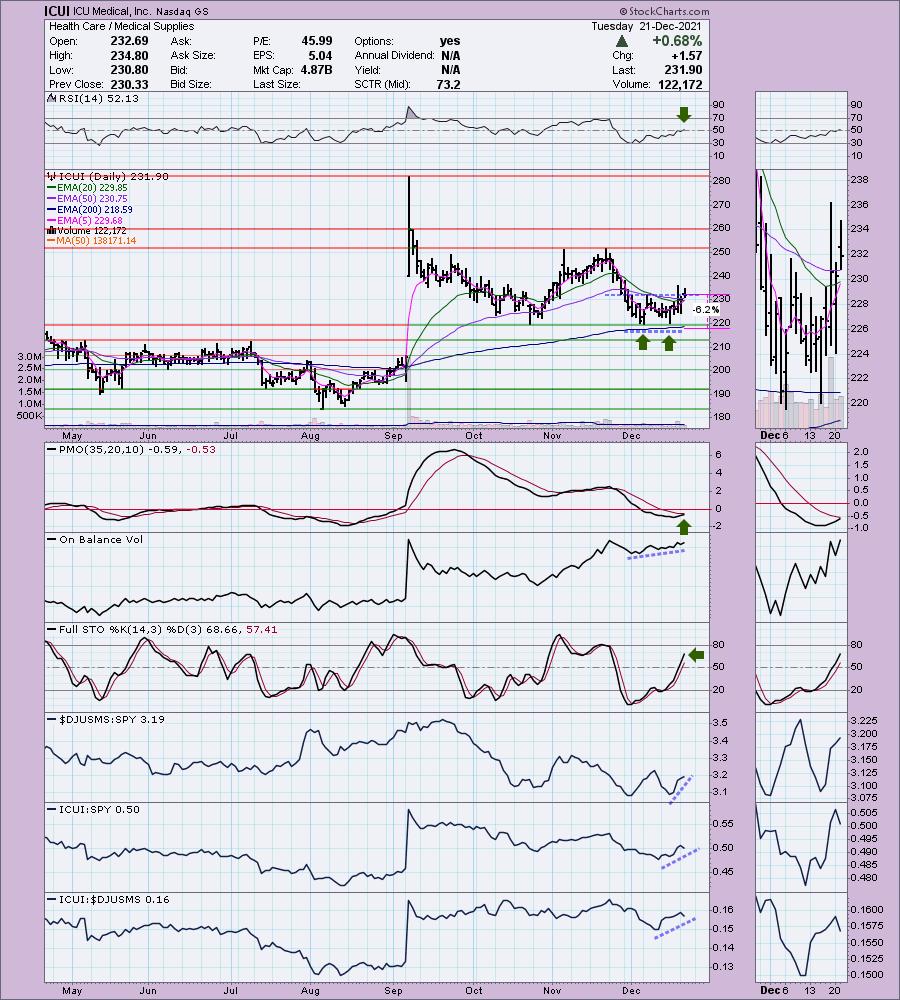
ICUI is unchanged in after hours trading. I've covered ICUI twice before. The first time was on June 1st 2020 (position was stopped out after a false breakout above the 50-EMA). The last time I covered it was on August 19th 2021. That position is still open and is up +18.3%.
Price broke out of a short-term bullish double-bottom pattern last week, but pulled back. This time it closed right on the confirmation line of the pattern. The pattern suggests a minimum upside target at overhead resistance just above $250, but given the newly positive RSI, a PMO BUY signal on the way and bullish Stochastics, I would look for price to push above that resistance level. Relative strength is positive and rising. The stop is set just below the pattern and the 200-EMA.
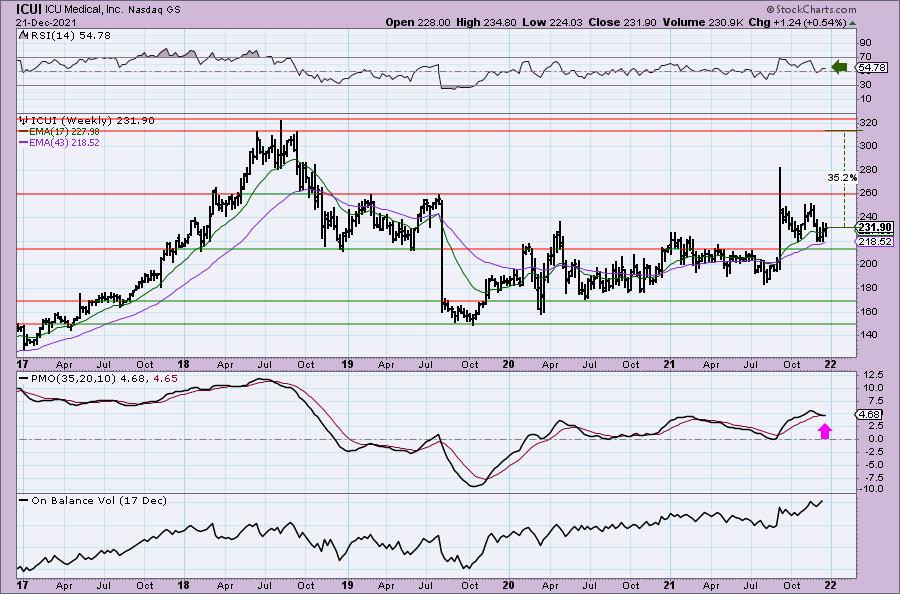
$260 is the next major area of overhead resistance, but I am looking for an upside target past that level at the 2018 tops. If you set a target at the 2019 highs that would still offer 12% profit.
Medpace Holdings, Inc. (MEDP)
EARNINGS: 2/14/2022 (AMC)
Medpace Holdings, Inc. engages in the provision of outsourced clinical development services to the biotechnology, pharmaceutical and medical device industries. Its services include medical department, clinical trial management, data-driven feasibility, study-start-up, clinical monitoring, regulatory affairs, patient recruitment and retention, medical writing, biometrics and data sciences, pharmacovigilance, core laboratory, laboratories, clinics, and quality assurance. The company was founded by August James Troendle in 1992 and is headquartered in Cincinnati, OH.
Predefined Scans Triggered: New CCI Buy Signals and Moved Above Ichimoku Cloud.
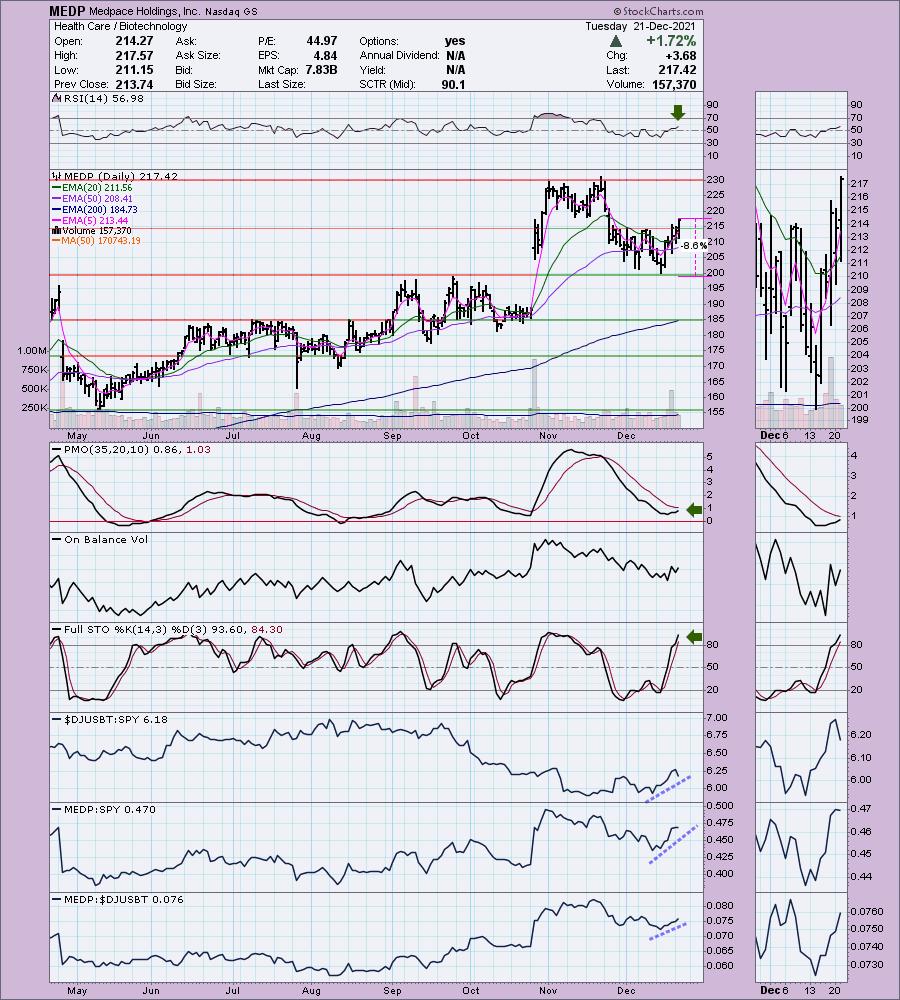
MEDP is unchanged in after hours trading. Here we have another bullish double-bottom. Today's breakout confirmed the pattern and suggests a minimum upside target at $230. the RSI is positive and rising. The PMO is rising in oversold territory and is headed for a crossover BUY signal. Stochastics are very favorable and relative strength is solid. The declining OBV bothers me so you may want to set a thinner stop beneath the 50-EMA rather than the bottom of the pattern as I have.
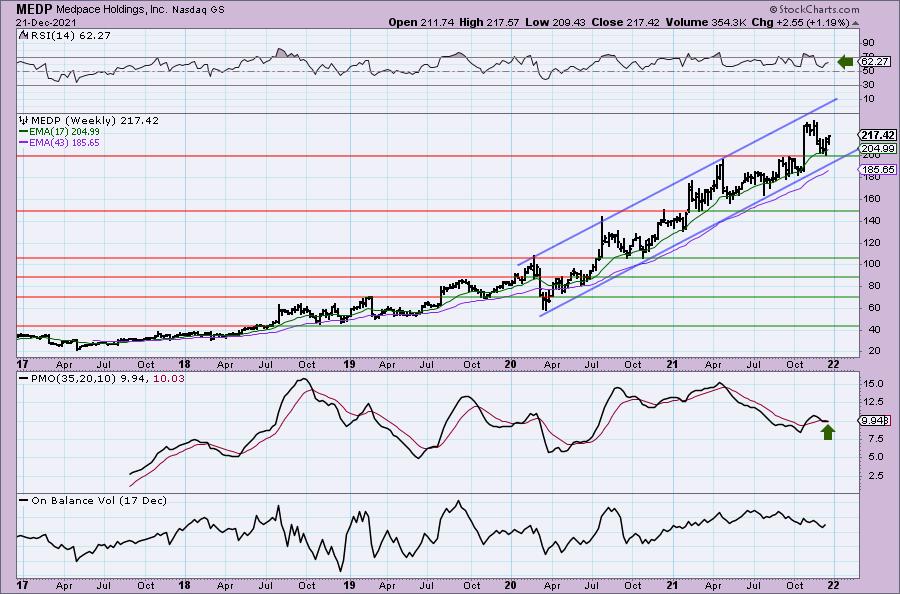
The weekly PMO had just triggered a crossover SELL signal, but it is already reversing and could nullify that signal if it continues to rally. It has been in a solid rising trend channel since 2020. It is near all-time highs, so I would consider setting an 18% upside target around $256.56.
Owens & Minor Inc. Holding Co. (OMI)
EARNINGS: 2/23/2022 (BMO)
Owens & Minor, Inc. engages in the provision of healthcare solutions. It operates through the Global Solutions and Global Products segments. The Global Solutions segment comprises of United States distribution, outsourced logistics, and value-added services business. The Global Products segment manufactures and sources medical surgical products through the production and kitting operations. The company was founded by Otho O. Owens and G. Gilmer Minor in 1882 and is headquartered in Mechanicsville, VA.
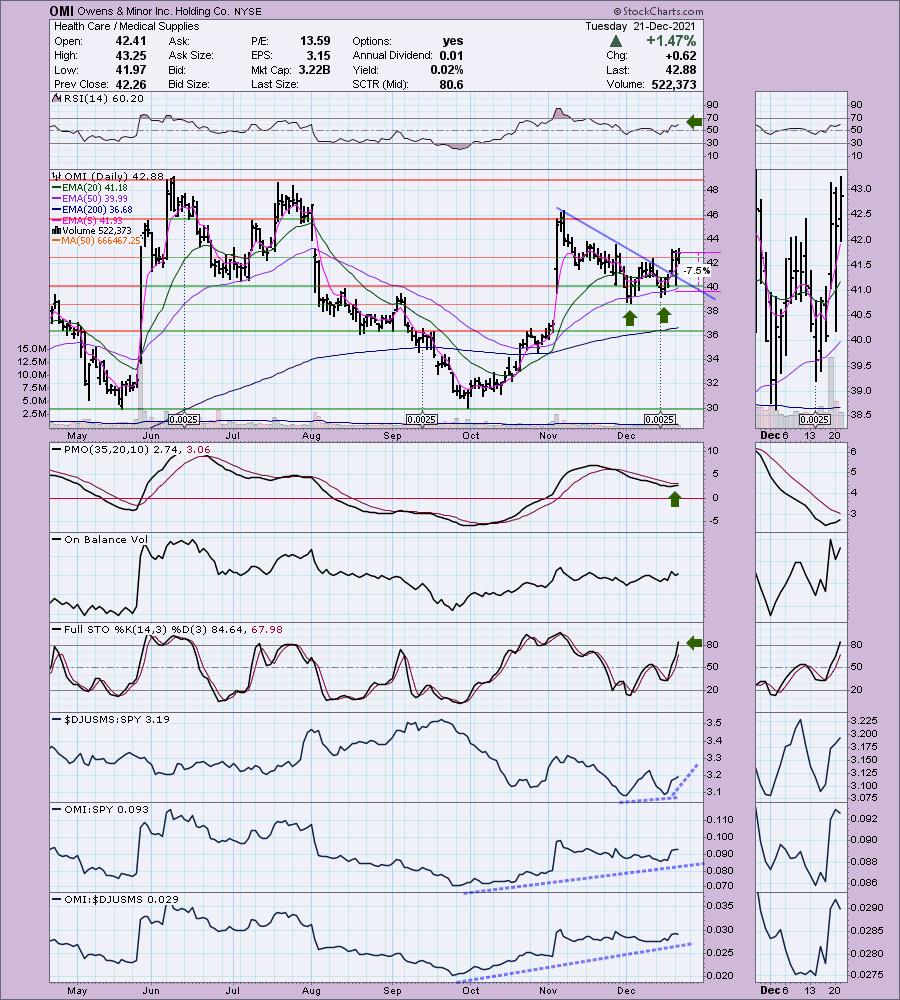
Predefined Scans Triggered: New CCI Buy Signals.
OMI is unchanged in after hours trading. We have another double-bottom pattern and a breakout from a declining trend. The RSI is positive and the PMO is rising toward a crossover BUY signal. Stochastics have just reached above 80. Relative strength has sped up within the industry group. OMI is a long-time outperformer against both the group and the SPY. The stop is set below the 50-EMA. It was over 10% to reach the bottom of the pattern. I wouldn't want it anymore if it dropped below the 50-EMA.
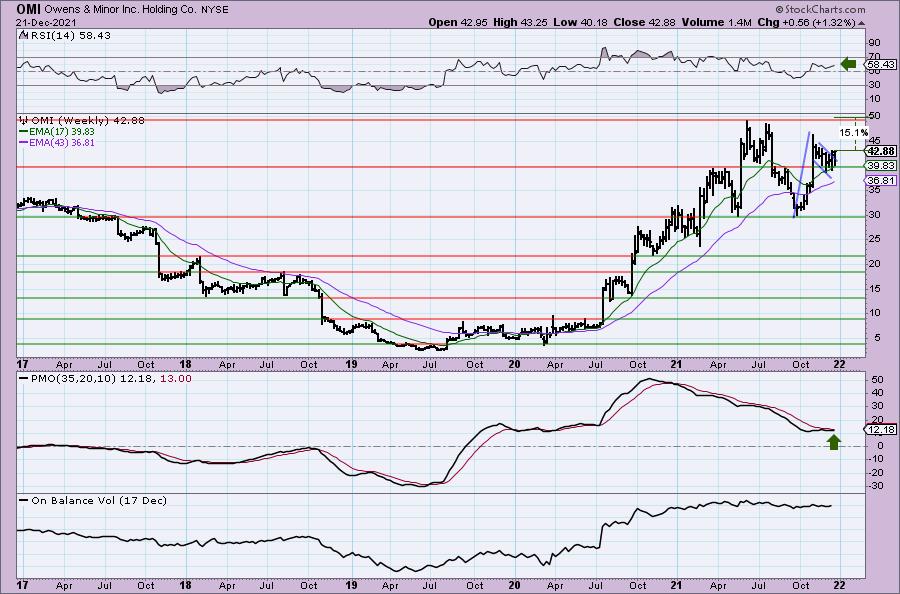
This is one of the more bullish weekly charts. The weekly RSI is positive and the weekly PMO is nearing a crossover BUY signal. We also see a bull flag that developed after a test of support at $30. If it can reach new all-time highs, that would be about a 15% gain.
Seagen (SGEN)
EARNINGS: 2/10/2022 (AMC)
Seagen Inc. is a biotechnology company, which engages in the development and commercialization of antibody-based therapies for the treatment of cancer. Its products include Adcetris and Padcev. The firm is also advancing a pipeline of novel therapies for solid tumors and blood-related cancers. The company was founded by Clay B. Siegall and H. Perry Fell on July 15, 1997 and is headquartered in Bothell, WA.
Predefined Scans Triggered: P&F Double Top Breakout and P&F Bearish Signal Reversal.
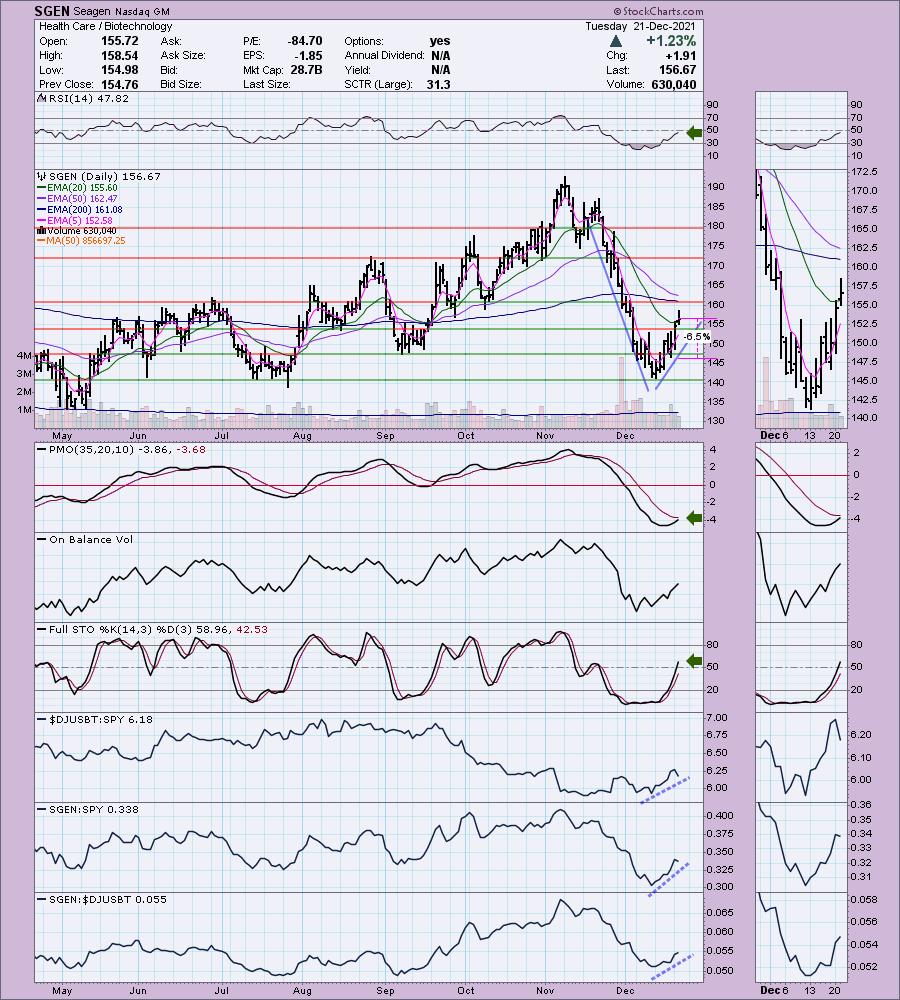
SGEN is unchanged in after hours trading. I covered SGEN on December 3rd 2020. The position stopped out in February after a 12% gain. Here we have a "V" bottom pattern that has nearly retraced 1/3rd of the left side of the pattern. That confirms the pattern and suggests price will breakout above the November high. The RSI is rising, but still is negative. The PMO is rising and should trigger an oversold crossover BUY signal soon. Price closed above the 20-EMA for the first time since it hit the skids. Stochastics are strongly rising and in positive territory above net neutral (50). Relative strength lines suggest continued outperformance.
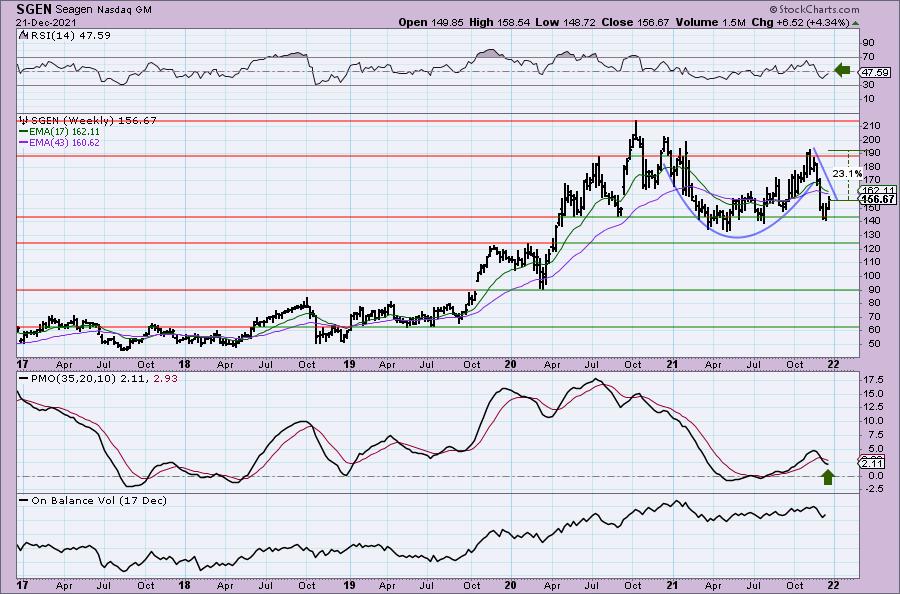
I like the almost textbook cup and handle basing pattern. Price bounced off support at the mid-2020 lows. The weekly RSI is negative but rising toward positive territory. The weekly PMO has decelerated and will turn back up if this rally takes hold. The pattern suggests new all-time highs will be met and exceeded, but I've listed a conservative upside target at 23%. Yes, 23% upside target is conservative based on the pattern.
Xenon Pharmaceuticals Inc. (XENE)
EARNINGS: 3/1/2022 (AMC)
Xenon Pharmaceuticals, Inc. is a clinical stage biopharmaceutical company. It develops therapeutics to improve the lives of patients with neurological disorders, including rare central nervous system (CNS) conditions. The company's products include XEN496, XEN1101, XEN901 and XEN007. Xenon Pharmaceuticals was founded by Simon Neil Pimstone, Johannes J. P. Kastelein and Michael R. Hayden on November 5, 1996 and is headquartered in Burnaby, Canada.
Predefined Scans Triggered: Moved Above Upper Bollinger Band and Moved Above Upper Price Channel.
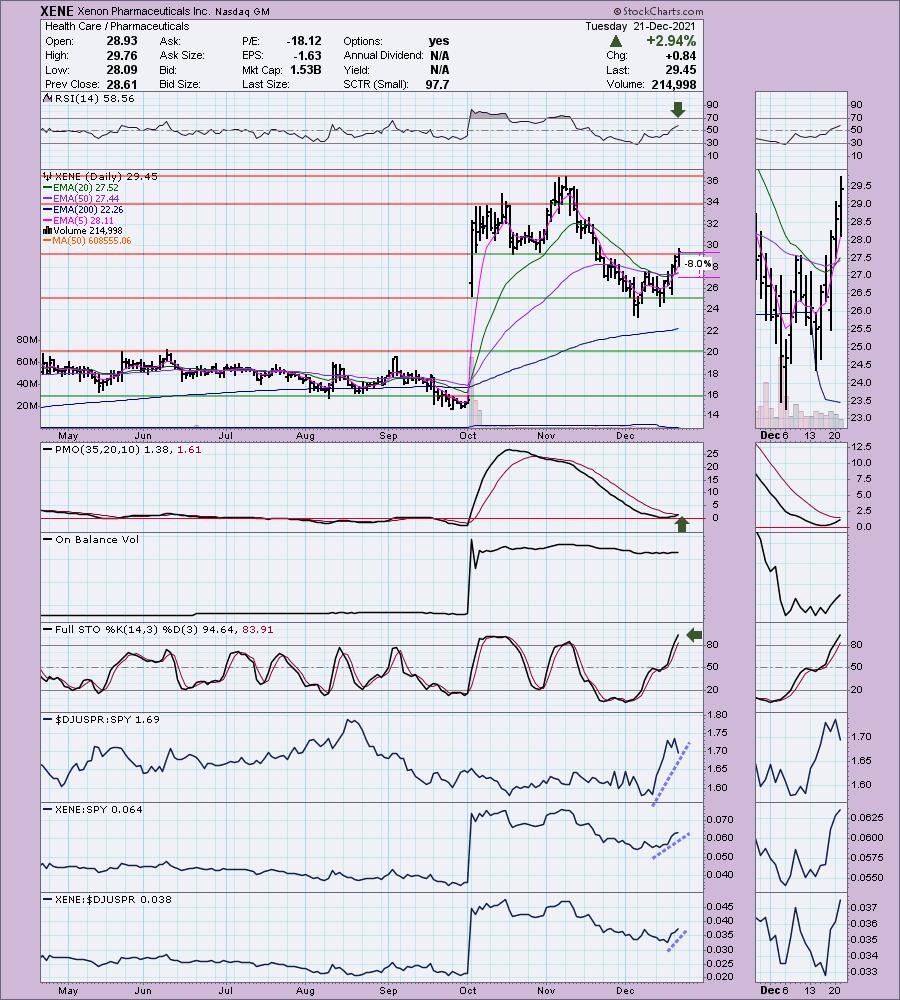
XENE is unchanged in after hours trading. We have yet another bullish double-bottom pattern. The RSI is positive and rising. The PMO is about to trigger a crossover BUY signal just above the zero line. Stochastics are rising and are now in the hot zone above 80. The group is cooling slightly this past week. XENE is outperforming both the group and SPY. The minimum upside target of the pattern would bring price to the next level of resistance at $34. There is a brand new IT Trend Model "Silver Cross" BUY signal as the 20-EMA crossed above the 50-EMA. I would set stops below the 50-EMA.
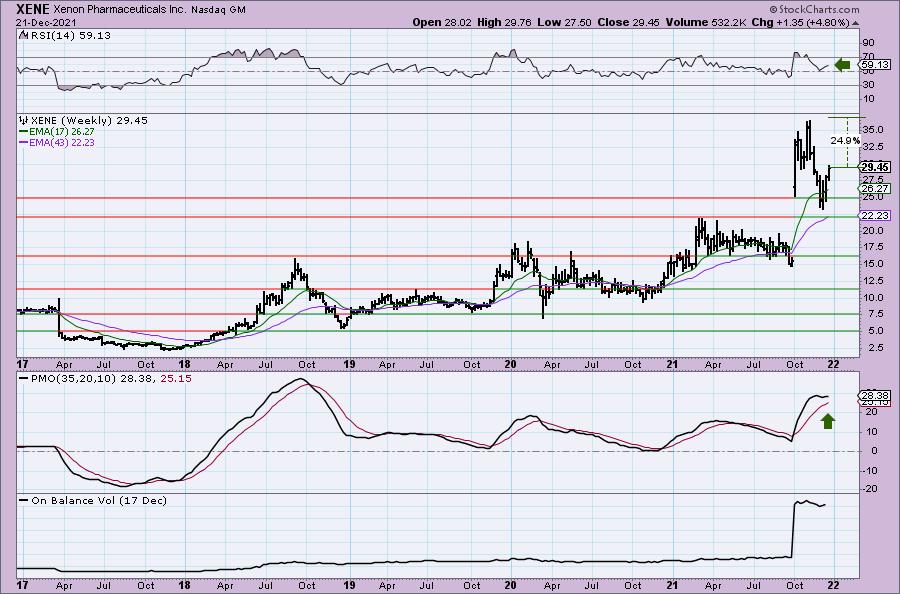
The weekly chart shows a rising and positive RSI. The weekly PMO is bottoming above its signal line which is especially bullish. Upside potential at new all-time highs would be an almost 25% gain.
Don't forget, on Thursdays I look at reader-requested symbols, click HERE to shoot me an email. I read every email I receive and try to answer them all!
Current Market Outlook:
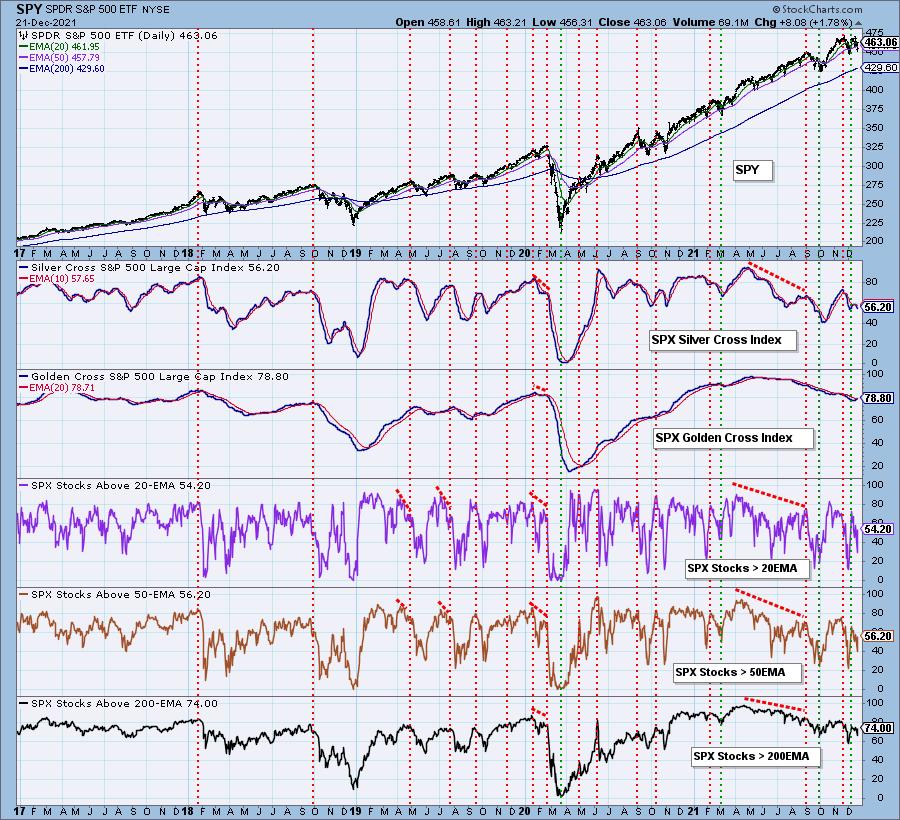
Market Environment: It is important to consider the odds for success by assessing the market tides. The following chart uses different methodologies for objectively showing the depth and trend of participation for intermediate- and long-term time frames.
- The Silver Cross Index (SCI) shows the percentage of SPX stocks on IT Trend Model BUY signals (20-EMA > 50-EMA)
- The Golden Cross Index (GCI) shows the percentage of SPX stocks on LT Trend Model BUY signals (50-EMA > 200-EMA)
Don't forget that as a "Diamonds" member, you have access to our GCI/SCI curated ChartList on DecisionPoint.com. You'll find it under "Members Only" links on the left side on the Blogs and Links Page.
Here is the current chart:
Full Disclosure: I'm 10% invested and 90% is in 'cash', meaning in money markets and readily available to trade with.
I'm required to disclose if I currently own a stock and/or may buy it within the next 72 hours.
Technical Analysis is a windsock, not a crystal ball.
Happy Charting!
- Erin
erin@decisionpoint.com
Watch the latest episode of DecisionPoint with Carl & Erin Swenlin on Mondays 7:00p EST or on the DecisionPoint playlist on the StockCharts TV YouTube channel here!
NOTE: The stocks reported herein are from mechanical trading model scans that are based upon moving average relationships, momentum and volume. DecisionPoint analysis is then applied to get five selections from the scans. The selections given should prompt readers to do a chart review using their own analysis process. This letter is not a call for a specific action to buy, sell or short any of the stocks provided. There are NO sure things or guaranteed returns on the daily selection of "Diamonds in the Rough."
Helpful DecisionPoint Links:
DecisionPoint Shared ChartList and DecisionPoint Chart Gallery
Price Momentum Oscillator (PMO)
Swenlin Trading Oscillators (STO-B and STO-V)
For more links, go to DecisionPoint.com