
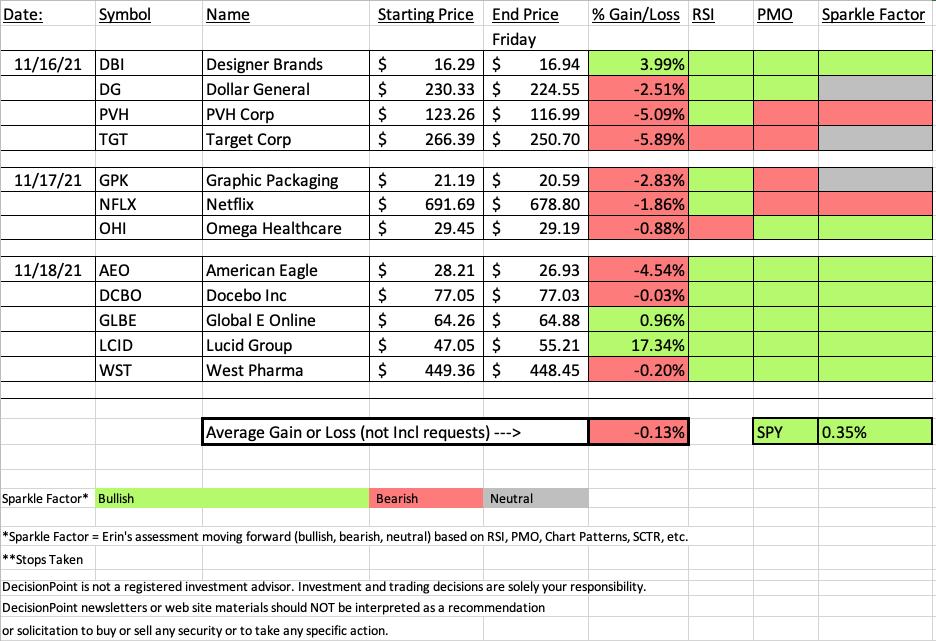
It was a rocky week for the "Diamonds in the Rough", but of the 12 stocks picked this week, only five have questionable futures. Two of those are definitely bearish moving forward while the other three have "neutral" ratings. It was slim pickings this week as far as the scans go so I'm not surprised by the mixed results this week. Just one more testament to keeping your exposure limited.
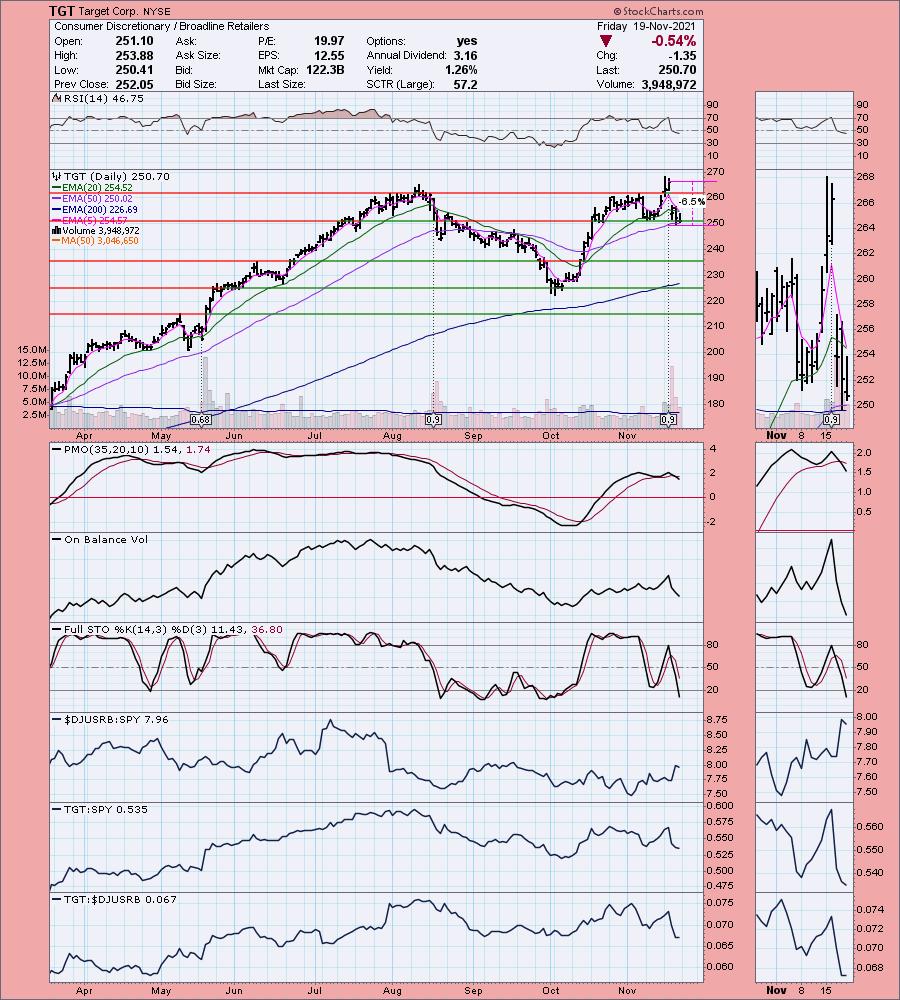
The biggest loser this week also happens to be the only one of the stocks picked this week that sits in my portfolio with a stop that is less than 1% away. Target (TGT) reported earnings this week and I held through based on the positive results its brethren received after earnings. I'll talk about the chart and its future.
The biggest winner was a reader request that I honestly didn't feel strongly about. You'll note that in the comments from yesterday that I included in today's recap. Lucid Group (LCID) is a volatile stock and fortunately for the spreadsheet it had a volatile upside day. I'll discuss its future as well.
This link to today's Diamond Mine recording is below as well as the link to sign up for next week's Diamond Minewhich will be held on WEDNESDAY 11/24 due to the Thanksgiving holiday. Picks next week will be limited to Monday and Tuesday (5 picks each day) with the recap on Wednesday.
Hope everyone has a great weekend!

RECORDING LINK Friday (11/19):
Topic: DecisionPoint Diamond Mine (11/19/2021) LIVE Trading Room
Start Time: Nov 19, 2021 09:00 AM
Meeting Recording Link.
Access Passcode: November$19
REGISTRATION FOR WEDNESDAY 11/24 Diamond Mine:
When: Nov 24, 2021 09:00 AM Pacific Time (US and Canada)
Topic: DP Diamond Mine (WEDNESDAY 11/24/2021) LIVE Trading Room
Register in advance for this webinar HERE.
Save the registration confirmation email with login instructions in case Zoom doesn't notify you in time.

Free DP Trading Room (11/8) RECORDING LINK - No Trading Room 11/15:
Topic: DecisionPoint Trading Room
Start Time: Nov 8, 2021 09:00 AM
Meeting Recording Link HERE.
Access Passcode: November%8
For best results, copy and paste the access code to avoid typos.
A few items about the spreadsheet: I've put on the spreadsheet whether the RSI is positive (green) or negative (red). The PMO column tells you if it is rising (green) or falling (red). Finally I've added my own "Sparkle Factor" that gives you my assessment going forward, bullish (green), bearish (red) or neutral (gray). The Sparkle Factor is basically my thoughts on whether I expect it to rise or fall. A neutral means it could really go either way so it could be added to a watch list. If you're in a stock I consider "neutral" going forward, the ball is in your court.
Darling:
Lucid Group, Inc. (LCID)
EARNINGS: 3/30/2022 (AMC)
Lucid Group, Inc. manufactures electric vehicles. It designs, develops, and built energy storage systems for electric vehicles and supplied automakers with the battery pack system needed to power hybrid, plug-in, and electric vehicles. The company was founded in December 2007 and is headquartered in Newark, CA.
Predefined Scans Triggered: Hammer Candlestick, Elder Bar Turned Blue, Parabolic SAR Sell Signals and P&F High Pole.
Below are the commentary and chart from yesterday (11/18):
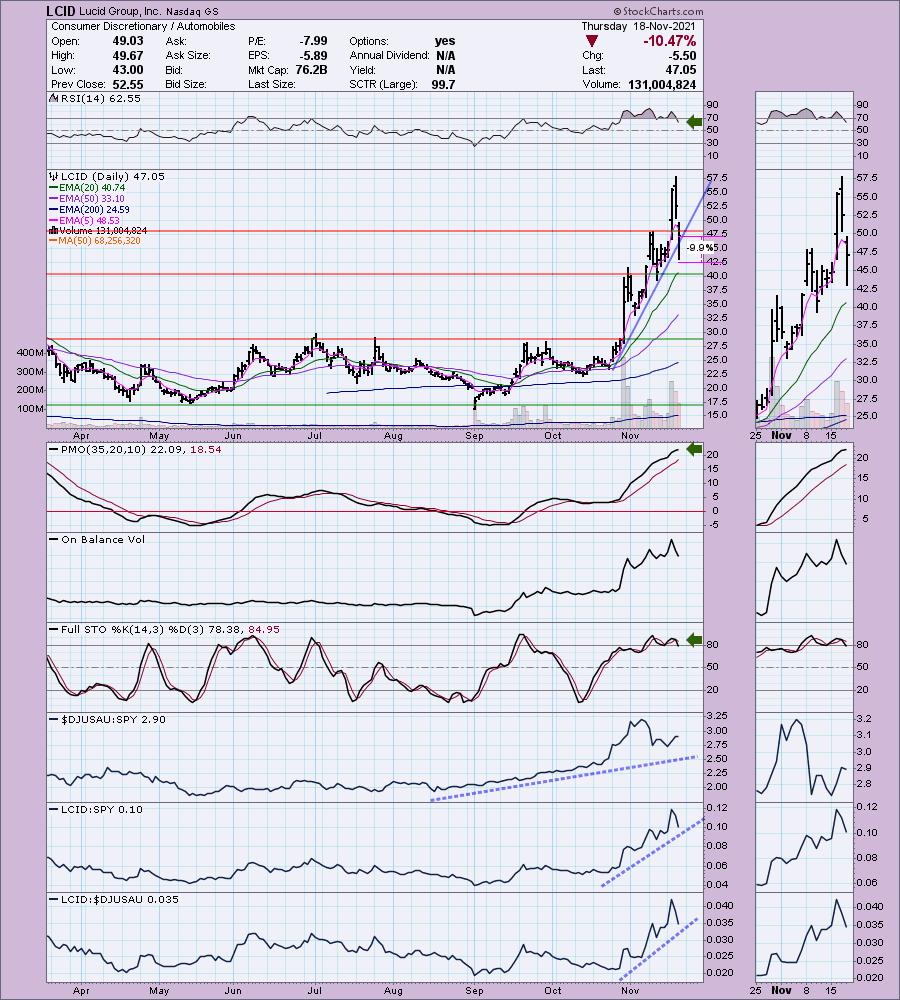
"LCID is down -1.11% in after hours trading. I hesitated to pick this one as I'm not particularly thrilled with the chart, but I know this subscriber wanted some possible direction on what to do with it. I do hope you are sitting on profits still. I like what this company provides and with the infrastructure bill in place, charging stations and battery packs will be a growth industry. I simply think this one went up too far too fast and it is normalizing. Bright spots are an RSI that is no longer overbought and is positive. Despite today's and yesterday's giant declines, the PMO is still actually rising meaning there is still a lot of momentum here. Stochastics have been oscillating above 80. Two big declines didn't take Stochastics to negative territory, so there is internal strength. Relative strength is still positive. There is also a "hammer" candlestick which generally leads to higher prices. Here are the problems. The rising trend has been compromised and we know based on after hours trading that it isn't likely done declining. The 20-EMA will be critical support. I set the stop below today's intraday low.
If you own it, you've already taken a huge hit and I believe you are probably in for another 10%+ decline before it reverses. I expect it will not look good on the spreadsheet tomorrow, but reader request day is about providing you my thoughts on your stocks. Be careful with this one and decide if you want to take the chance at more losses or sell and get back in. You could consider adding to the position, but putting more money on a weak stock isn't always the best idea. Hopefully this is helpful!"
Here is today's chart:
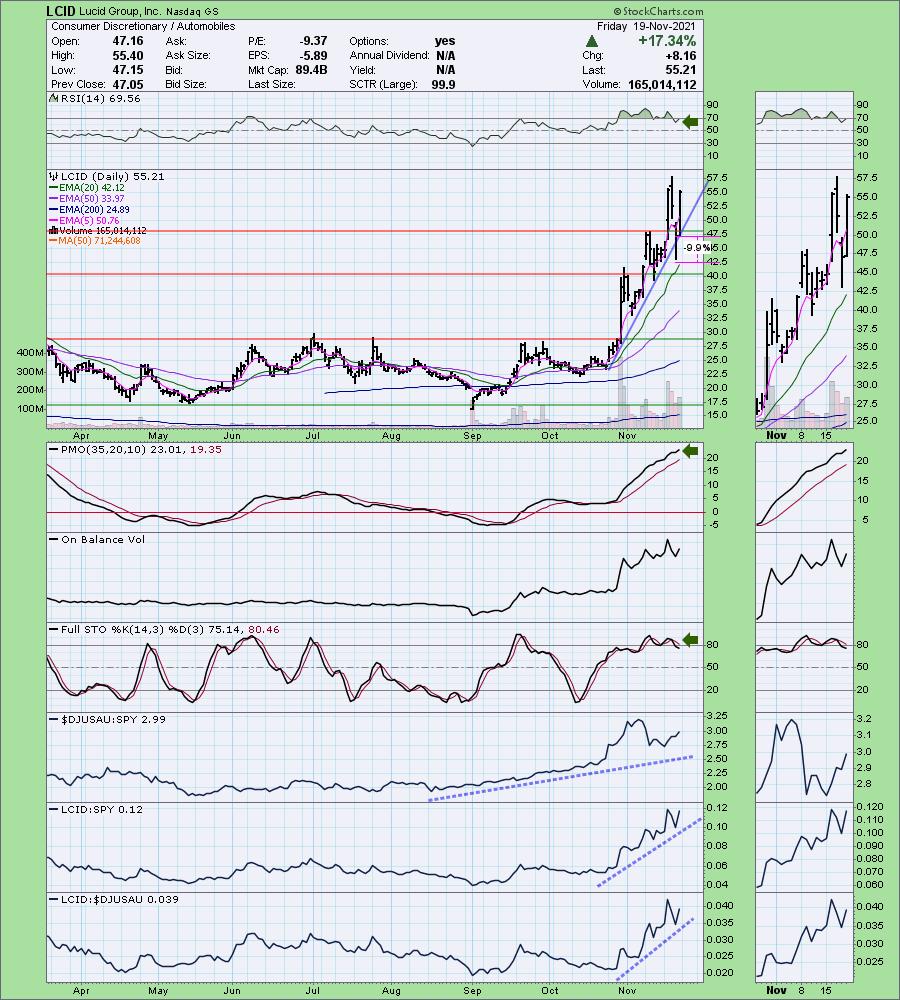
Well obviously I was wrong about price moving down another 10% before it would move up. The chart is very positive. The RSI is not quite overbought yet and the PMO is accelerating higher. This looks like it's going to continue to be a 'runner'. If we see a pullback to the rising bottoms trendline, that would be an interesting entry.
Don't forget, on Thursdays I look at reader-requested symbols, so shoot me an email at erin@decisionpoint.com. I read every email I receive and try to answer them all!
Dud:
Target Corp. (TGT)
EARNINGS: 11/17/2021 (BMO)
Target Corp. engages in the operation and ownership of general merchandise stores. It offers food assortments including perishables, dry grocery, dairy, and frozen items. The company was founded by George Draper Dayton in 1902 and is headquartered in Minneapolis, MN.
Predefined Scans Triggered: Moved Above Upper Keltner Channel and P&F Double Top Breakout.
Below are the commentary and chart from Tuesday (11/16/2021):
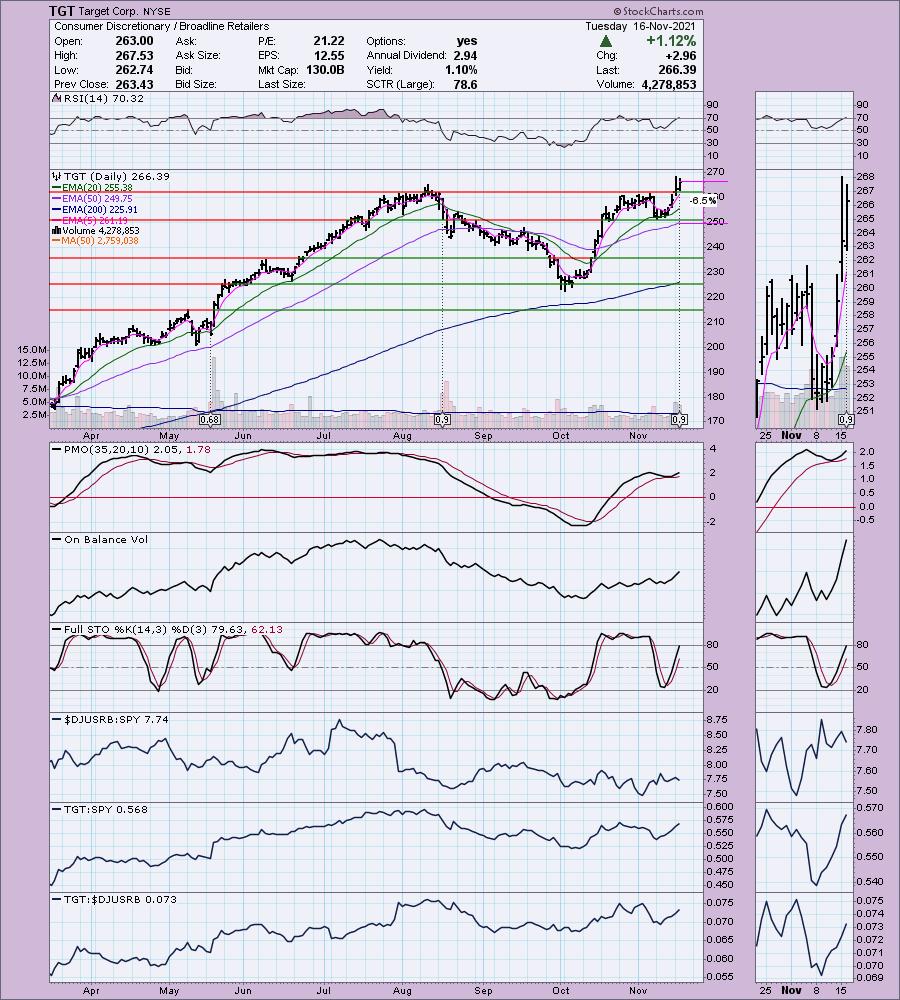
"TGT is up +0.89% in after hours trading going into earnings tomorrow. It is poised to do very well given the recent breakout. I'm not fond of the overbought RSI, but given that the RSI was overbought almost all of June and July, I'm okay with it. Additionally, we have a PMO bottom above the signal line with the PMO not overbought. Stochastics are rising strongly and it is a strong relative performer against the group and the SPY. The stop can also be set tightly just below the 50-EMA.
I covered TGT twice before on July 29th 2020 and September 29th 2020. Neither stop has been hit so the first position is up +116.1% and the second is up +69.7%. Full disclosure: I own TGT."
Below is today's chart:
Since I do own it, I'll discuss how I'm going to handle the position moving forward. The chart has definitely gone south given the new PMO crossover SELL signal and now negative RSI. Stochastics have made their way quickly into oversold territory, but unfortunately are still pointed down. I am going to hold TGT into next week because it is sitting on support at the 50-EMA. My stop is below the 50-EMA so it could be triggered Monday if the indicators are correct. This could be an excellent reversal point off the 50-EMA so I'm going to give it another day or two. As stated, I have a stop set that is less than 1% away so I'm willing to wait it out.
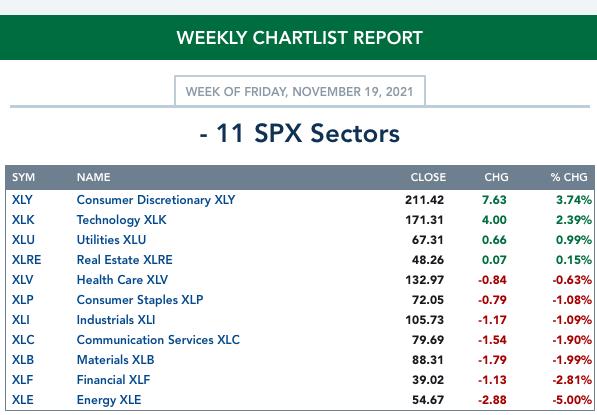
THIS WEEK's Sector Performance:
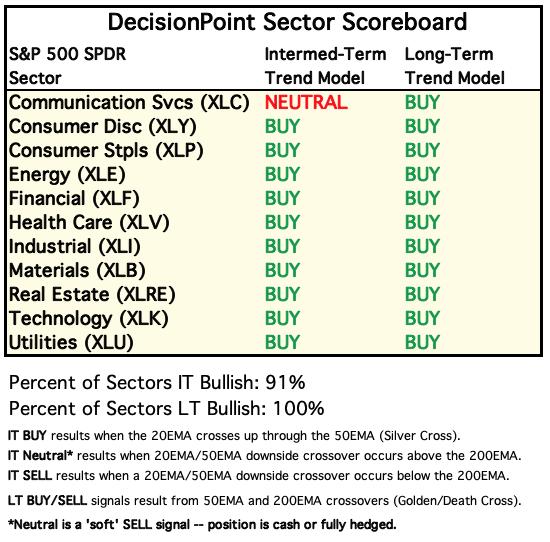
DecisionPoint Sector Scoreboard (Mechanical Trend Model Signals):
Click Hereto view Carl's annotated Sector ChartList!
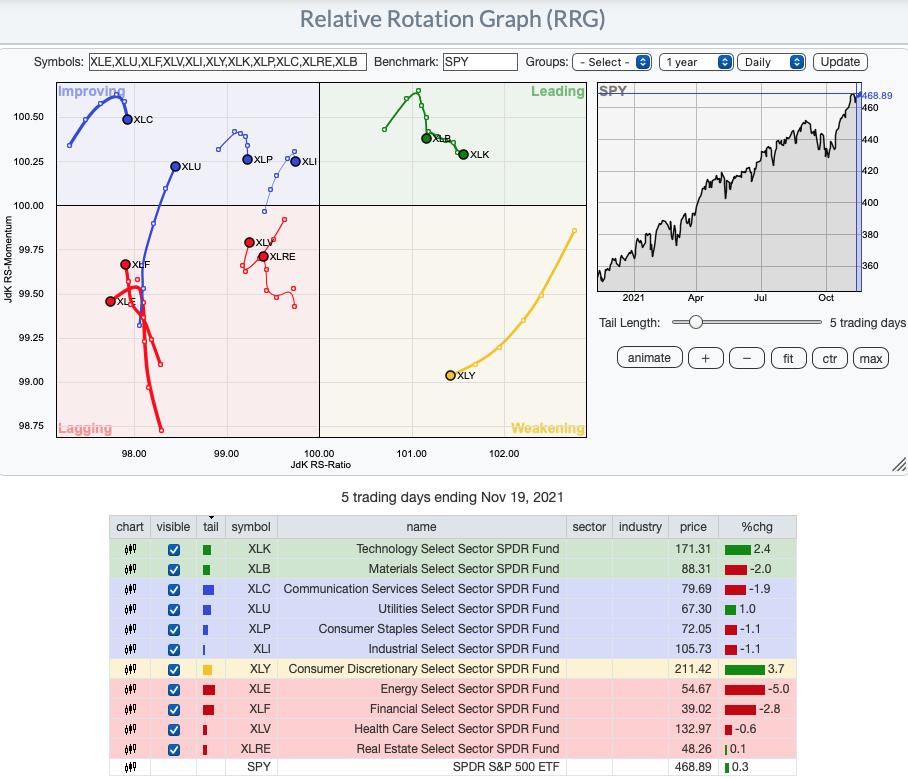
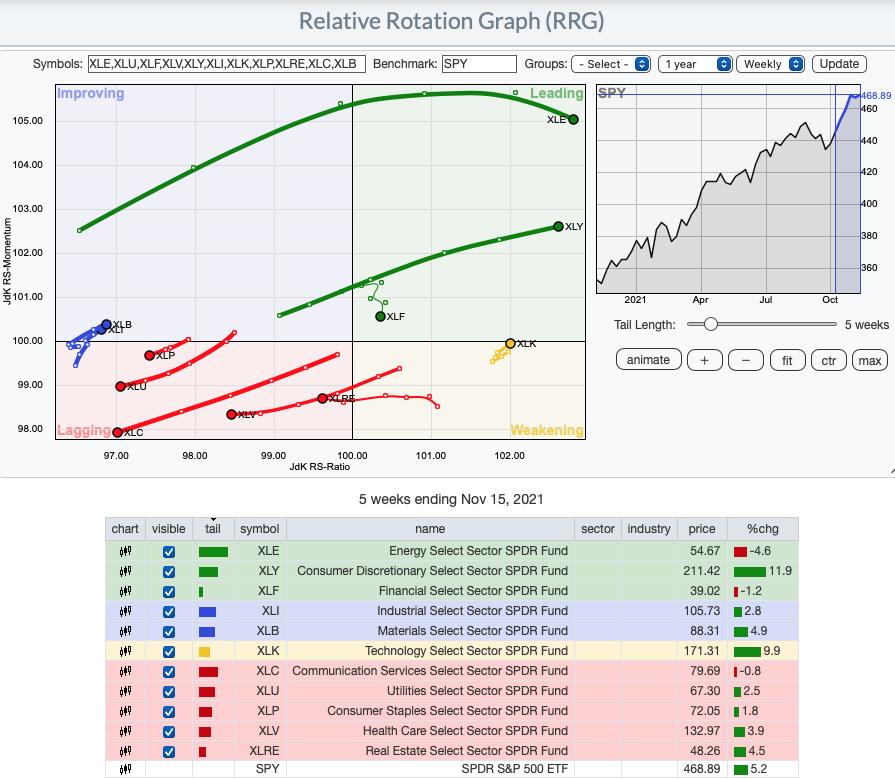
Short-term RRG: I've decided to include both the short-term daily RRG and the intermediate-term weekly RRG to give us perspective. Looking at the daily, XLU is looking strong and XLV is similarly traveling with the bullish northeast heading. XLY and XLK had the best weeks, but it isn't really reflected in the daily RRG. XLB is Leading but losing steam. XLC, XLE, XLP and XLI are reversing backward. XLF and XLRE are showing improvement but are both still Lagging.
Intermediate-Term RRG: The weekly version shows that intermediate-term strength lies with XLE, XLY and XLF. XLK looks very intriguing as it hooks back toward Leading. XLB and XLI have bullish headings within Improving. All other sectors look very bearish right now.
Sector to Watch: Utilities (XLU)
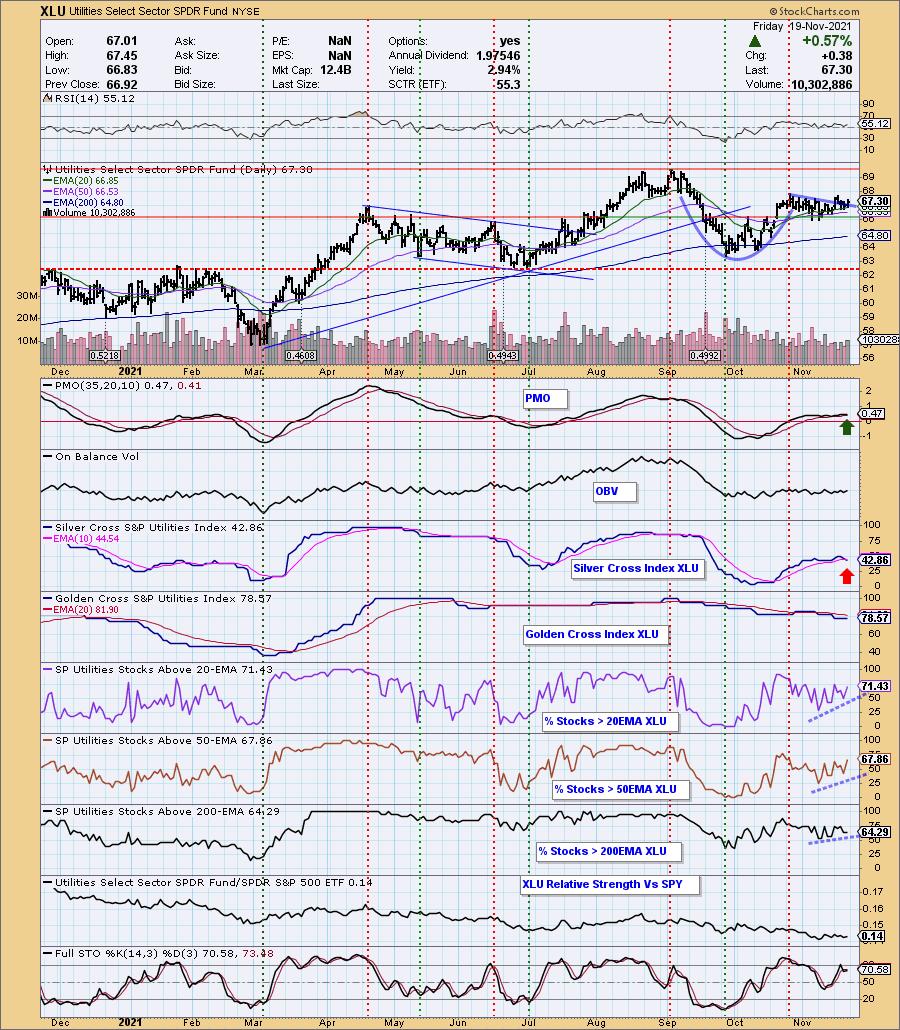
I'm not sure XLU was even in the running this morning in the Diamond Mine, but after today's close, seeing nice participation percentages combined with its bullish heading on the RRG, it made the most sense. XLK and XLY are still bullish, but participation is fading which suggests they will underperform next week. Should the market begin to pull back, Utilities is a defensive sector and could benefit.
Note that participation of stocks > 20/50-EMAs is higher than the SCI reading. I don't like the negative crossover on the SCI, but better participation implies it will reverse upward. There is a bullish cup and handle pattern, a positive RSI and a PMO bottom above the signal line. Stochastics are beginning to reverse direction.
Industry Group to Watch: Water ($DJUSWU)
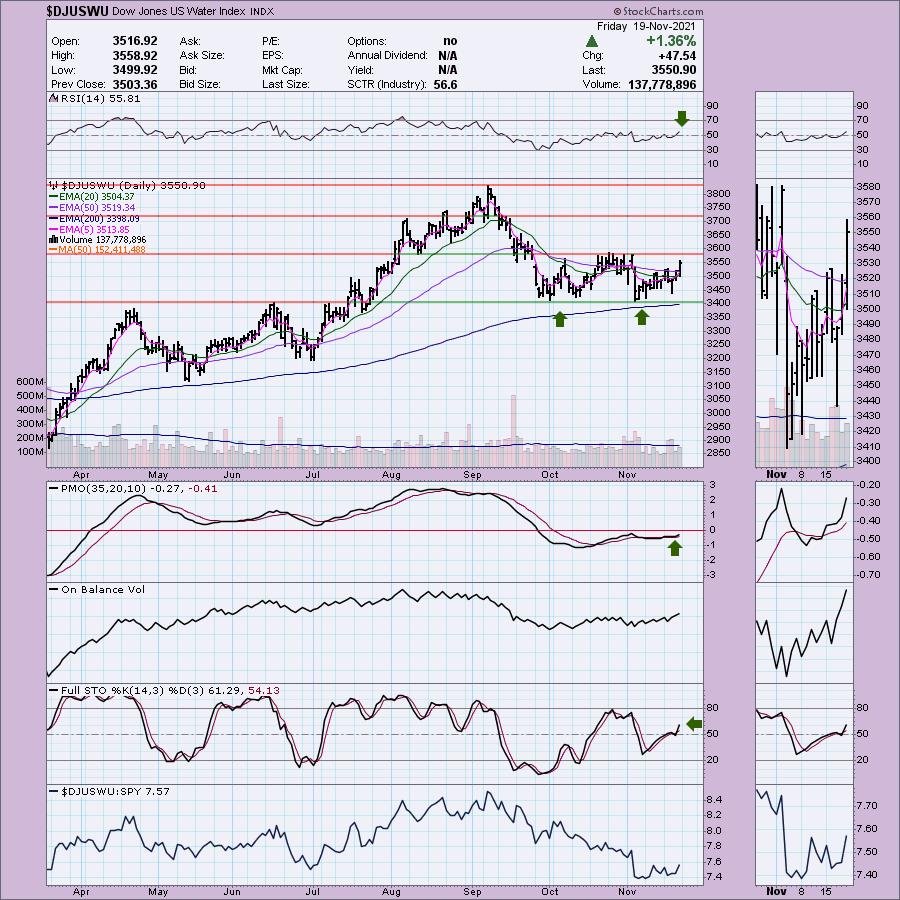
Since I'm going with Utilities, I decided to pick a group within that sector... however, Biotechs are beginning to look very interesting right now too. Last week or the week before I picked American Water Works (AWK) so you might want to revisit that "Diamond in the Rough" next week. We have a double-bottom/trading range and price is headed toward a breakout. The RSI just hit positive territory and the PMO is headed back up. Stochastics are favorable and relative strength is beginning to trend slightly upward.
Go to our Sector ChartList on DecisionPoint.com to get an in depth view of all the sectors.
Technical Analysis is a windsock, not a crystal ball.
Have a great weekend & Happy Charting! Remember, due to the Thanksgiving holiday next week, the next Diamonds Report is Monday 11/22.
- Erin
erin@decisionpoint.com
Full Disclosure: I'm about 75% exposed to the market.
Watch the latest episode of DecisionPoint with Carl & Erin Swenlin on Mondays 7:00p EST or on the DecisionPoint playlist on the StockCharts TV YouTube channel here!
NOTE: The stocks reported herein are from mechanical trading model scans that are based upon moving average relationships, momentum and volume. DecisionPoint analysis is then applied to get five selections from the scans. The selections given should prompt readers to do a chart review using their own analysis process. This letter is not a call for a specific action to buy, sell or short any of the stocks provided. There are NO sure things or guaranteed returns on the daily selection of "diamonds in the rough."
Helpful DecisionPoint Links:
DecisionPoint Shared ChartList and DecisionPoint Chart Gallery
Price Momentum Oscillator (PMO)
Swenlin Trading Oscillators (STO-B and STO-V)
(c) Copyright 2021 DecisionPoint.com