
The market is looking shaky so it wasn't a surprise to see a large presence of utilities companies in my scan results. I presented two of today's "Diamonds in the Rough" during our recording of the DecisionPoint Show. I've added one more to include in today's report.
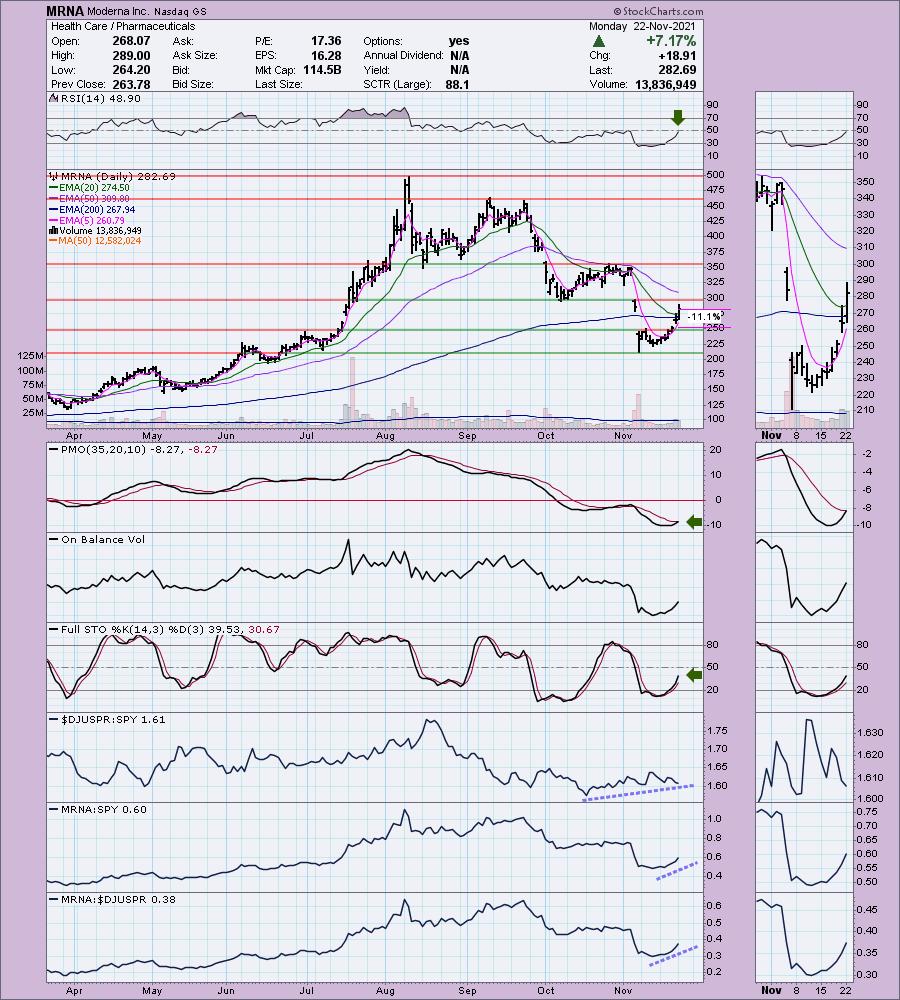
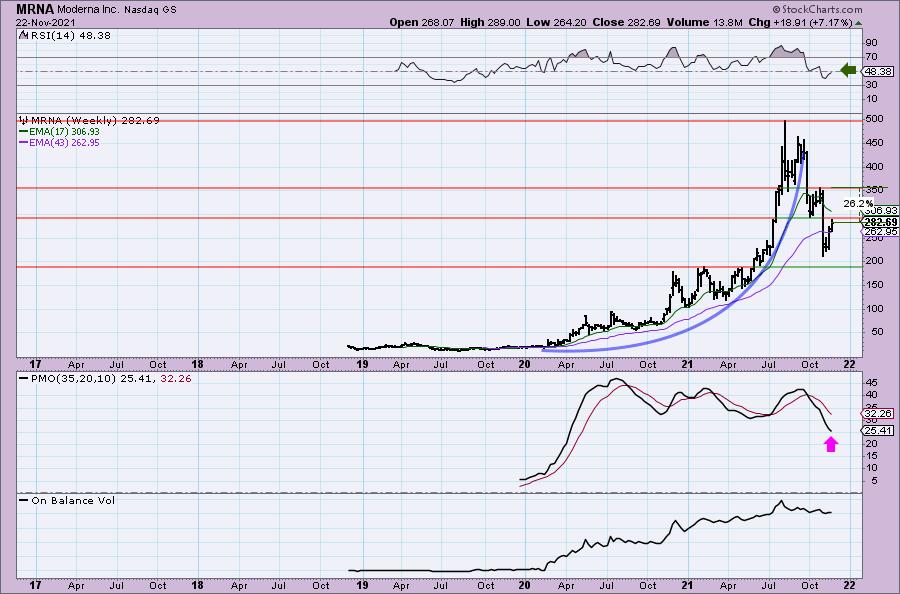
The other two "Diamonds in the Rough" come from the Healthcare sector. This is often considered a defensive group, but one of today's picks is a Biotech. Biotechs aren't in the 'defensive' class given they do tend to be volatile. The group itself is starting to see some relative strength against the SPY. The final stock is Moderna (MRNA). It's had a rocky 2021, but it does look lined up to recover after today 7%+ rally. The weekly chart has a textbook parabolic breakdown that I'll discuss.
Don't forget! This week's Diamond Mine trading room will be WEDNESDAY at Noon ET. The link to sign up is below.
If you're not already, it's time to play defense. I am still 75% exposed, but will be paring that back or rotating into more defensive holdings.
Today's "Diamonds in the Rough": AEP, AGR, ALNY, ES and MRNA.
A few "Stocks to Review": DBB, CVET and URBN.

RECORDING LINK Friday (11/19):
Topic: DecisionPoint Diamond Mine (11/19/2021) LIVE Trading Room
Start Time: Nov 19, 2021 09:00 AM
MeetingRecording Link.
Access Passcode: November$19
REGISTRATION FOR ** WEDNESDAY ** 11/24 Diamond Mine:
When: Nov 24, 2021 09:00 AM Pacific Time (US and Canada)
Topic: DP Diamond Mine (WEDNESDAY 11/24/2021) LIVE Trading Room
Register in advance for this webinar HERE.
Save the registration confirmation email with login instructions in case Zoom doesn't notify you in time.

Free DP Trading Room (11/22) RECORDING LINK:
Topic: DecisionPoint Trading Room
Start Time: Nov 22, 2021 09:00 AM
Meeting Recording Link.
Access Passcode: November@22
For best results, copy and paste the access code to avoid typos.
Welcome to DecisionPoint Daily Diamonds, wherein I highlight five "Diamonds in the Rough." These are selected from the results of my DecisionPoint scans, which search for stocks that could benefit from the trend and condition of the market. Remember, these are not recommendations to buy or sell, but are the most interesting of the stocks that surfaced in my scans. My objective is to save you the work of the initial, tedious culling process, but you need to apply your own analysis to see if these stocks pique your interest as well. There are no guaranteed winners here!
American Elec Pwr Co., Inc. (AEP)
EARNINGS: 2/16/2022 (BMO)
American Electric Power Co., Inc. engages in the business of generation, transmission and distribution of electricity. It operates through the following segments: Vertically Integrated Utilities, Transmission & Distribution Utilities, AEP Transmission Holdco and Generation & Marketing. The Vertically Integrated Utilities segment engages in the generation, transmission and distribution of electricity for sale to retail and wholesale customers through assets owned and operated by its subsidiaries. The Transmission & Distribution Utilities segment engages in the business of transmission and distribution of electricity for sale to retail and wholesale customers through assets owned and operated by its subsidiaries. The AEP Transmission Holdco segment engages in the development, construction and operation of transmission facilities through investments in its wholly-owned transmission subsidiaries and joint ventures. The Generation & Marketing segment engages in non-regulated generation and marketing, risk management and retail activities. The company was founded on December 20, 1906 and is headquartered in Columbus, OH.
Predefined Scans Triggered: Bullish MACD Crossovers, Parabolic SAR Buy Signals and Entered Ichimoku Cloud.
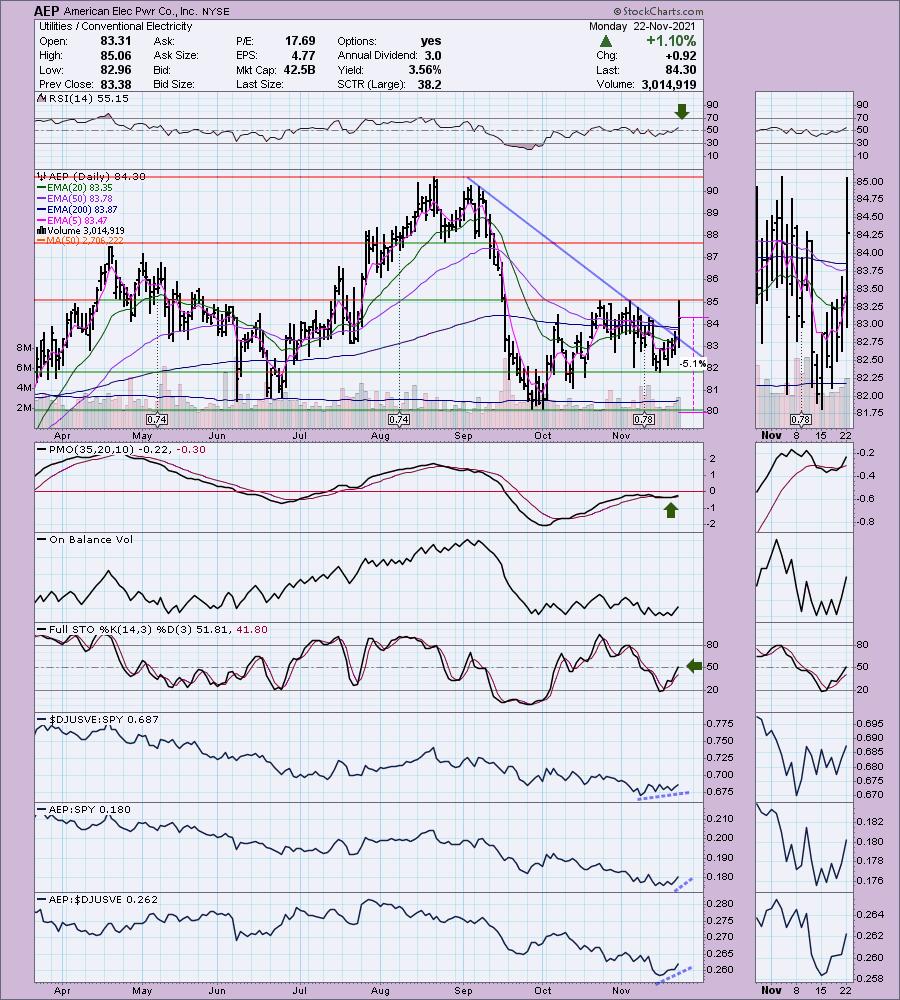
AEP is up +0.23% in after hours trading. I covered AEP on May 26th 2020. The positive was up about 18% before it pulled back in early 2021 and hit the 5.5% stop. Today's breakout was exceptional. Not only did it break out of a declining trend, it moved well past the 200-EMA. There was a 5/20-EMA positive crossover today which generates a ST Trend Model BUY signal. The RSI is positive and the PMO triggered a crossover BUY signal last week. Stochastics are positive and rising. Relative strength is picking up for the group and AEP is outperforming the group and beginning to outperform the SPY. These stocks aren't volatile and they offer a good yield (usually). The stop is set at a very manageable 5.1%.
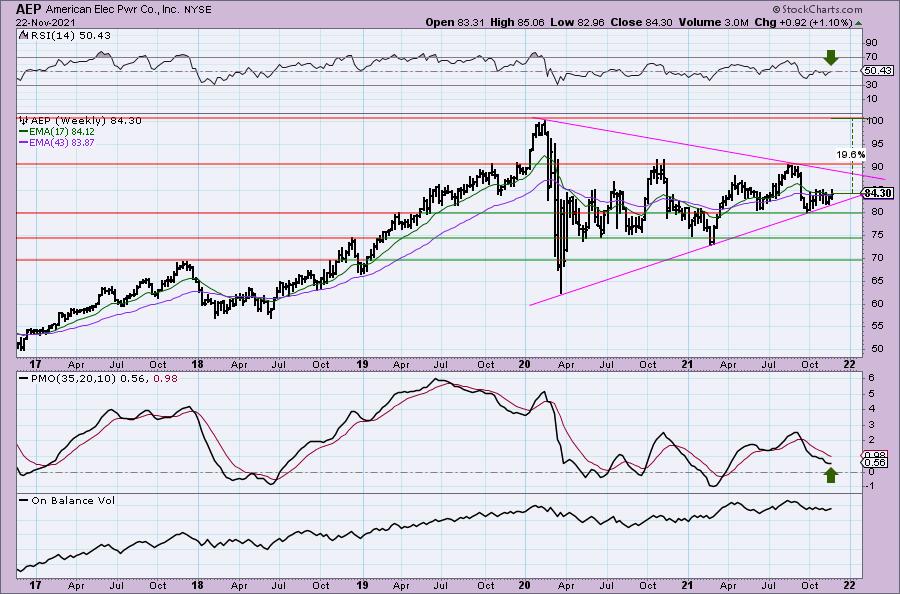
Price is narrowing within a symmetrical triangle. These are continuation patterns and given the prior trend was up going into this triangle, the expectation is an upside breakout. If it can reach 2020 highs, that would be a tidy 19% gain.
Avangrid, Inc. (AGR)
EARNINGS: 2/22/2022 (AMC)
Avangrid, Inc. engages in the energy transmission and gas distribution. It operates through the following segments: Networks, Renewables, and Other. The Networks segment includes energy transmission and distribution, electric transmission, and gas distribution activities. The Renewables segment relating to renewable energy, mainly wind energy generation and trading related with such activities. The Other segment covers miscellaneous corporate revenues including intersegment eliminations. The company was founded in 1852 and is headquartered in Orange, CT.
Predefined Scans Triggered: Bullish MACD Crossovers and Entered Ichimoku Cloud.
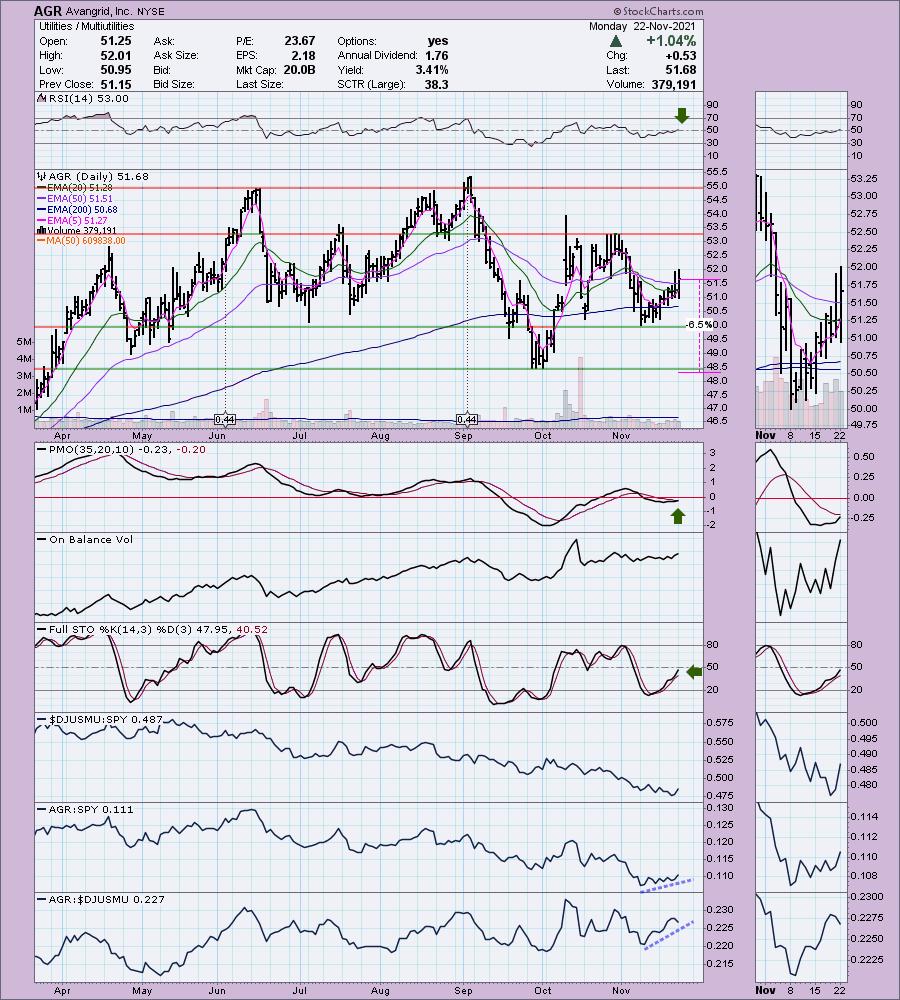
AGR is down -0.81% in after hours trading, so we could see a nice entry tomorrow. I covered AGR in the June 15th 2021 Diamond Report. Sadly I picked it at the top so the 7.3% stop was eventually hit on the late September sell-off, but the position was never up by much. I don't think we're picking it at the top right now. It is in a nice rising trend and today closed above the 50-EMA. The RSI just hit positive territory and Stochastics are on their way to positive territory also. The PMO is nearing a crossover BUY signal. Despite the group underperforming, AGR has been outperforming the SPY as well as the group. It has a nice 3.41% yield and a stop below the September low at 6.5%.
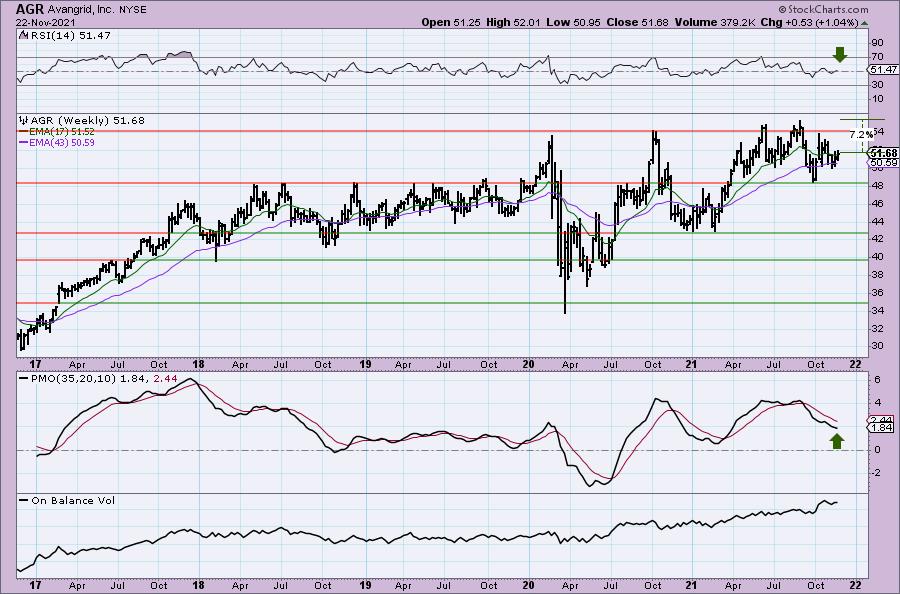
Upside potential isn't great right now, but give the bullish ascending triangle on the chart, I expect to see it hit new all-time highs. Consider an upside target of 16% around $59.95. The weekly PMO is still declining, but appears to be decelerating. The weekly RSI just hit positive territory.
Alnylam Pharmaceuticals, Inc. (ALNY)
EARNINGS: 2/3/2022 (BMO)
Alnylam Pharmaceuticals, Inc. operates as biopharmaceutical company, which engages in the discovery, development and commercialization of RNAi therapeutics. The firm's products include ONPATTRO, GIVLAARI, and OXLUMO. It is the translation of RNAi as a new class of innovative medicines with a core focus on RNAi therapeutics for the treatment of genetically defined diseases. The company was founded by Noble Laureate, David Bartel, Thomas Tuschl, Phillip Zamore, Paul R. Schimmel, and Phillip A. Sharp on June 14, 2002 and is headquartered in Cambridge, MA.
Predefined Scans Triggered: None.
ALNY is unchanged in after hours trading. I covered ALNY in the April 22nd 2020 Diamond Report. The position was up 9.5%, but pulled back in mid-June to trigger the 9.4% stop.
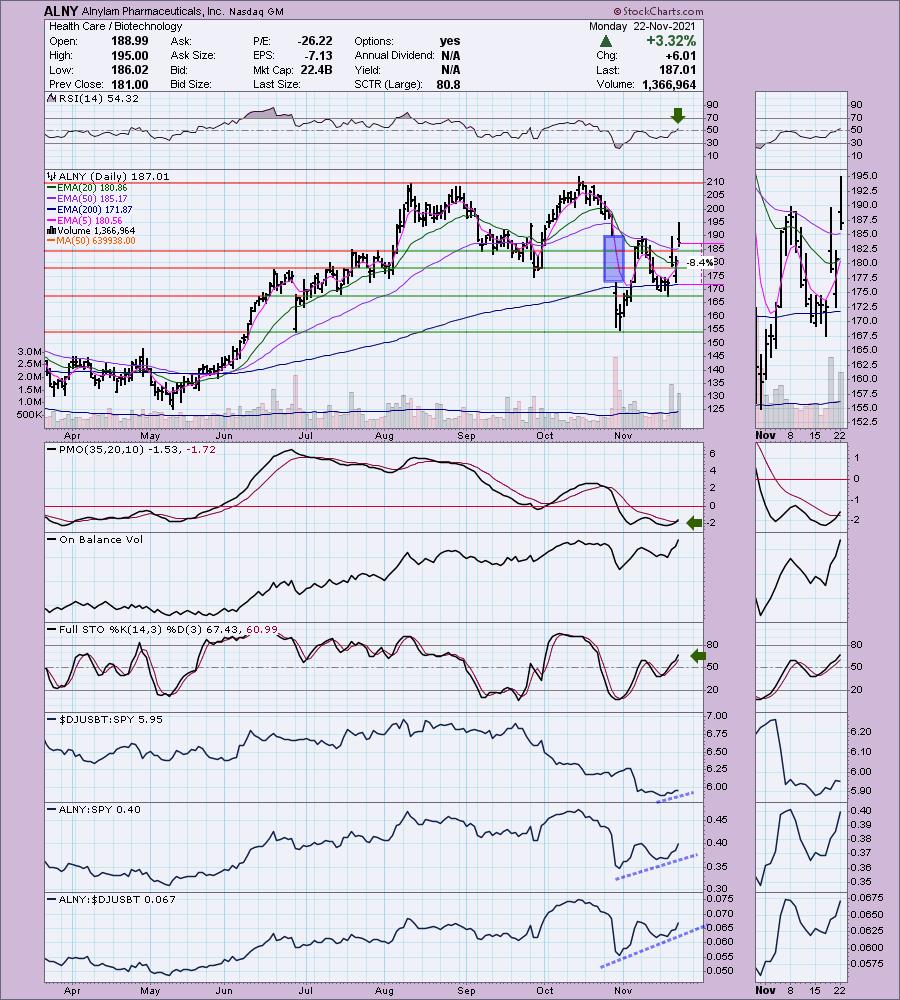
The gap is what I'll focus on. Typically when a gap is closed you'll see a continuation. In mid-November the gap was very nearly closed, but price pulled back at the 50-EMA. Today price leapt above the 50-EMA and while it didn't close above the previous gap, the intraday high did close the gap. The RSI is now positive and the PMO triggered a crossover BUY signal today. Stochastics are positive and rising. Relative strength in Biotechs is beginning trend up. ALNY is outperforming the group and the SPY. The stop is set at the 200-EMA at 8.4%.
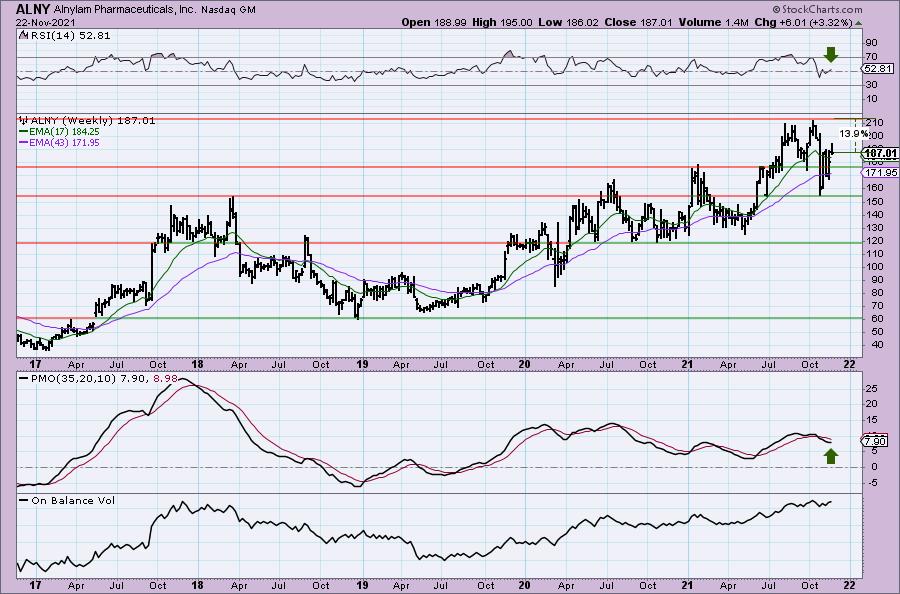
The weekly chart is shaping up with a now positive weekly RSI and a weekly PMO that is turning up. Upside potential is at least 14%, but I expect it to make new all-time highs soon.
Eversource Energy (ES)
EARNINGS: 2/16/2022 (AMC)
Eversource Energy engages in the generation, transmission, and distribution of natural gas and electricity. It operates through the following segments: Electric Distribution, Electric Transmission, Water Distribution and Natural Gas Distribution. The Electric Distribution segment distributes electricity to retail customers. The Electric Transmission segment owns and maintains transmission facilities through CL&P, NSTAR Electric, PSNH, and WMECO. The Water Distribution segments operates three separate regulated water utilities in Connecticut, Massachusetts and New Hampshire. The Natural Gas Distribution segment transmits and distributes natural gas to retail customers. The company was founded on July 1, 1966 and is headquartered in Springfield, MA.
Predefined Scans Triggered: None.
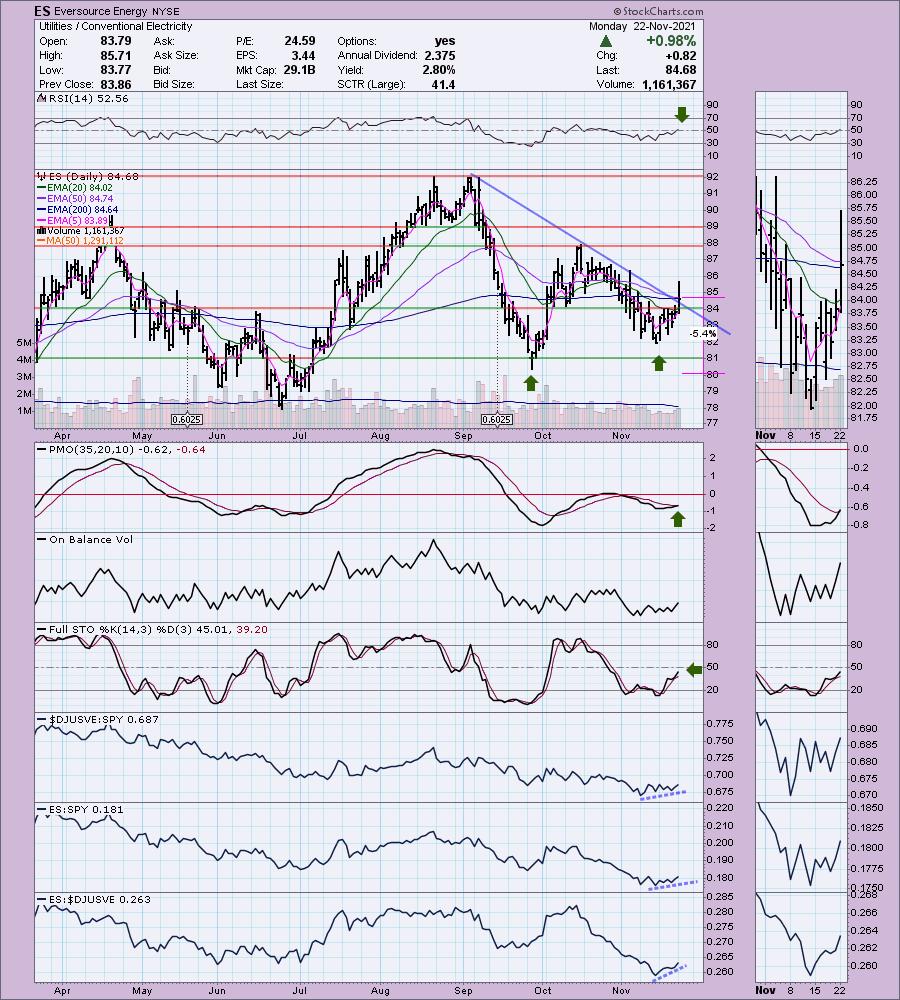
ES is unchanged in after hours trading. We have another high yield utility. There is a large double-bottom forming and now price has broken the declining trend. I like that it closed above the 200-EMA, but less impressed that it could hold a close above the 50-EMA. Still the chart has promise with a positive RSI and new PMO crossover BUY signal. Stochastics are rising toward positive territory. Relative performance is positive and improving. The stop is a slender 5.4% at about $80 which is below the September low.
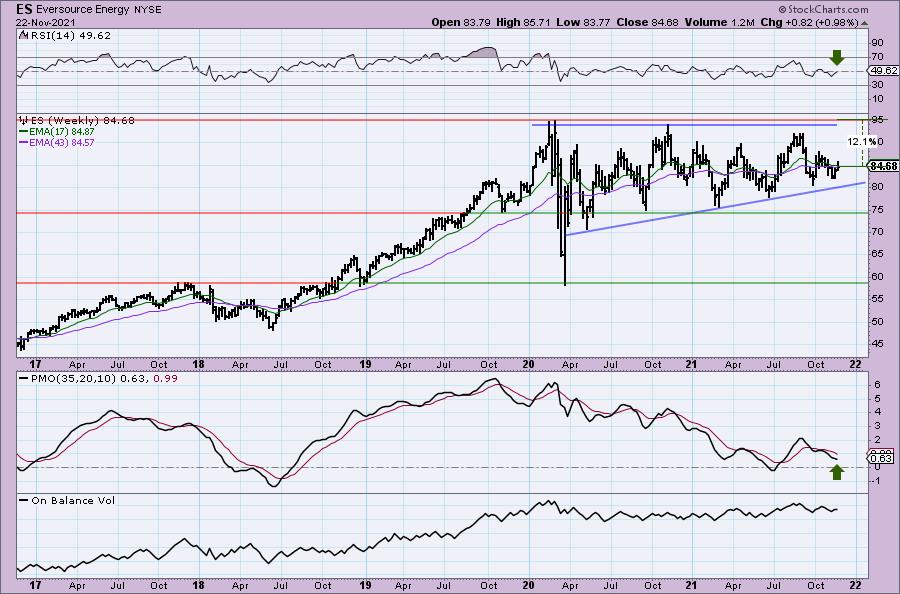
At best we have a large bullish ascending triangle (flat tops, rising bottoms). Or, if you don't like the flat tops which do show a very slight declining trend, that still would give us a symmetrical triangle which in this case would also be bullish given the prior trend was rising. The weekly RSI is very close to positive territory and the PMO, while declining, is beginning to decelerate. Upside potential to all-time highs would be about 12%, but I'd set an upside target a bit higher at 16% or around $98.23.
Moderna Inc. (MRNA)
EARNINGS: 2/24/2022 (BMO)
Moderna, Inc. engages in the development of transformative medicines based on messenger ribonucleic acid (mRNA). Its product pipeline includes the following modalities: prophylactic vaccines, cancer vaccines, intratumoral immuno-oncology, localized regenerative therapeutics, systemic secreted therapeutics, and systemic intracellular therapeutics. The company was founded by Noubar B. Afeyan, Robert S. Langer, Jr., Derrick J. Rose and Kenneth R. Chien in 2010 and is headquartered in Cambridge, MA.
Predefined Scans Triggered: P&F Double Top Breakout.
MRNA is up +0.36% in after hours trading. I covered MRNA on September 9th 2021 as a reader request that I liked. The timing was off on this one as the stop was hit on the late September decline. MRNA has been through the ringer. It is down almost 44% from the all-time high in August. This allows for plenty of upside potential. I talked about gaps earlier. MRNA just covered the second early November gap. It is coming up against gap resistance at the first November gap down, but the PMO is triggering a crossover BUY signal. The RSI is rising nicely and should hit positive territory above net neutral (50) soon. Stochastics are still in negative territory but are rising. The Pharma industry group is performing relatively well and MRNA is outperforming it as well as the SPY currently. This is a 'beat down' selection and price is well below the 50-EMA, so tread lightly. The stop had to be set deeply given today's 7%+ gain. You could make it tighter to match more closely with the 200-EMA.
This is a textbook example of a parabolic move and subsequent breakdown. This is why I recommend using trailing stops on "runners". Parabolics will break down swiftly and deeply. They tend to fall down to the last basing pattern. Notice that MRNA bounced off the prior basing pattern tops. The weekly PMO is still ugly and price is still in a declining trend. The weekly RSI is making its way toward positive territory. If price can recapture last month's highs, that would be an over 26% gain.
Don't forget, on Thursdays I look at reader-requested symbols, click HERE to shoot me an email. I read every email I receive and try to answer them all!
Current Market Outlook:
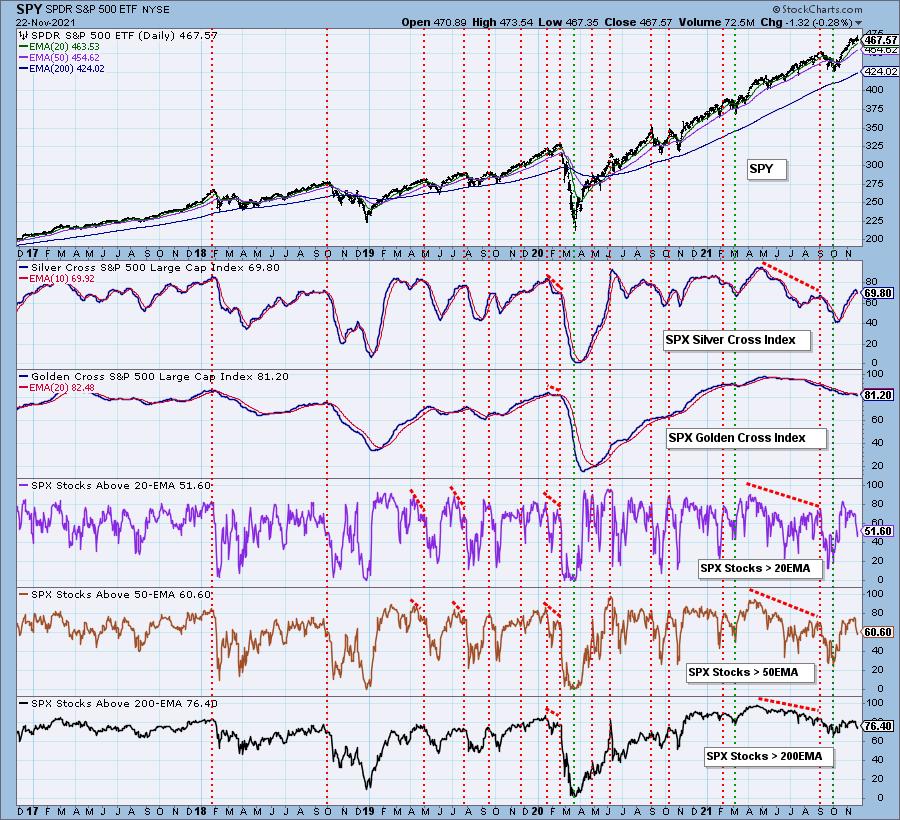
Market Environment: It is important to consider the odds for success by assessing the market tides. The following chart uses different methodologies for objectively showing the depth and trend of participation for intermediate- and long-term time frames.
- The Silver Cross Index (SCI) shows the percentage of SPX stocks on IT Trend Model BUY signals (20-EMA > 50-EMA)
- The Golden Cross Index (GCI) shows the percentage of SPX stocks on LT Trend Model BUY signals (50-EMA > 200-EMA)
- The Bullish Percent Index (BPI) shows the percentage of SPX stocks on Point & Figure BUY signals.
Don't forget that as a "Diamonds" member, you have access to our GCI/SCI curated ChartList on DecisionPoint.com. You'll find it under "Members Only" links on the left side on the Blogs and Links Page.
Here is the current chart:
Full Disclosure: I'm 75% invested and 25% is in 'cash', meaning in money markets and readily available to trade with.
I'm required to disclose if I currently own a stock and/or may buy it within the next 72 hours.
Technical Analysis is a windsock, not a crystal ball.
Happy Charting!
- Erin
erin@decisionpoint.com
Watch the latest episode of DecisionPoint with Carl & Erin Swenlin on Mondays 7:00p EST or on the DecisionPoint playlist on the StockCharts TV YouTube channel here!
NOTE: The stocks reported herein are from mechanical trading model scans that are based upon moving average relationships, momentum and volume. DecisionPoint analysis is then applied to get five selections from the scans. The selections given should prompt readers to do a chart review using their own analysis process. This letter is not a call for a specific action to buy, sell or short any of the stocks provided. There are NO sure things or guaranteed returns on the daily selection of "Diamonds in the Rough."
Helpful DecisionPoint Links:
DecisionPoint Shared ChartList and DecisionPoint Chart Gallery
Price Momentum Oscillator (PMO)
Swenlin Trading Oscillators (STO-B and STO-V)
For more links, go to DecisionPoint.com