
I have been tweaking my "Momentum Sleepers" scan to include Stochastics. The scan uses a faster PMO as well as varying configurations of the 5/20/50/200-EMAs and a volume component. These are exclusive and proprietary so I'm afraid I can't share my scans. Although the "Diamond PMO Scan" is available HERE. It is a great starting point for most scans and fairly easy to manipulate.
Back to the "sleepers"... I noticed three stocks that came up not only in the same industry group, but in the same business. The storage stocks within Specialty REITs all look very good right now. I brought three to the table today.
Finally, I have been watching the Solar industry group and I think we finally have a breakout that we might be able to trust. I'll cover the Solar ETF (TAN) below.
Today's "Diamonds in the Rough": CUBE, EXR, LSI and TAN.

RECORDING LINK Friday (10/8):
Topic: DecisionPoint Diamond Mine (10/8/2021) LIVE Trading Room
Start Time : Oct 8, 2021 09:00 AM
Meeting Recording Link HERE.
Access Passcode: October@8
REGISTRATION FOR FRIDAY 10/15 Diamond Mine:
When: Oct 15, 2021 09:00 AM Pacific Time (US and Canada)
Topic: DecisionPoint Diamond Mine (10/15/2021) LIVE Trading Room
Register in advance for this webinar HERE.
Save the registration confirmation email with login instructions in case Zoom doesn't notify you in time.

Free DP Trading Room (10/11) RECORDING LINK:
Topic: DecisionPoint Trading Room
Start Time : Oct 11, 2021 09:00 AM
Meeting Recording LINK.
Access Passcode: October#11
For best results, copy and paste the access code to avoid typos.
Welcome to DecisionPoint Daily Diamonds, wherein I highlight five "Diamonds in the Rough." These are selected from the results of my DecisionPoint scans, which search for stocks that could benefit from the trend and condition of the market. Remember, these are not recommendations to buy or sell, but are the most interesting of the stocks that surfaced in my scans. My objective is to save you the work of the initial, tedious culling process, but you need to apply your own analysis to see if these stocks pique your interest as well. There are no guaranteed winners here!
CubeSmart (CUBE)
EARNINGS: 10/28/2021 (AMC)
CubeSmart operates as a self-managed and self-administered real estate investment trust with its operations conducted solely through CubeSmart LP and its subsidiaries. It owns, operates, develops, manages, and acquires self-storage properties. The company was founded in July 2004 and is headquartered in Malvern, PA.
Predefined Scans Triggered: Elder Bar Turned Green, Bullish MACD Crossovers and Entered Ichimoku Cloud.
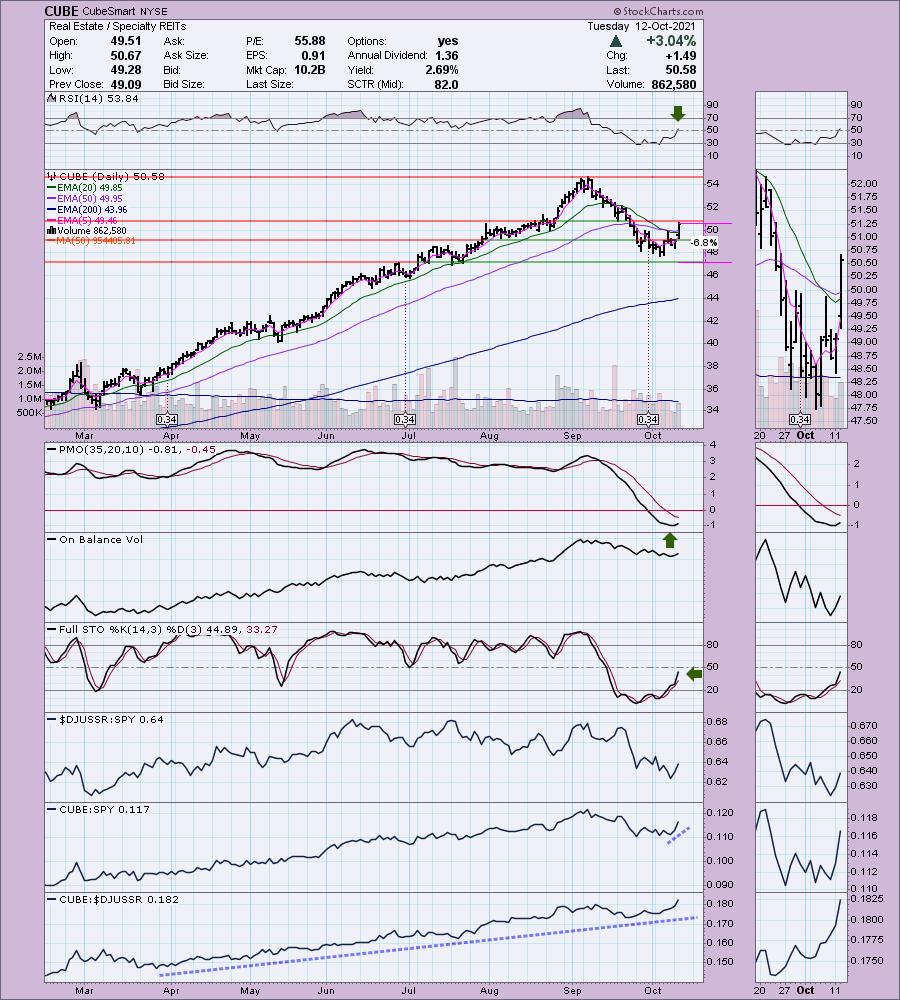
CUBE is unchanged in after hours trading. I covered three storage companies on January 27th 2021 including CUBE. The stop was never hit so the position is up 42%.
All three of these charts are very similar. We have a lengthy pullback after a very long bull run. Price found some support and has been forming a cup shaped bottom. We could be in for the formation of a handle down the road, but for now the set up on these charts are very bullish. The RSI has just entered positive territory and the PMO has decompressed into oversold territory. It is now turning up. Stochastics are strong and suggest further upside ahead. While the Specialty REITs group isn't doing that great, these storage companies are outperforming in a big way. The stop is set below support at the October low.
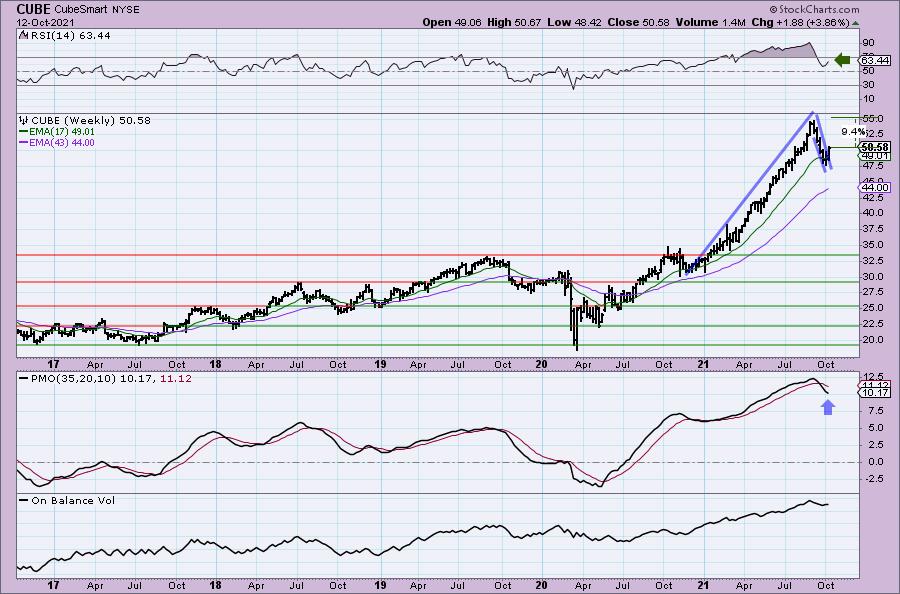
On all three of these weekly charts for the storage companies, we have very large bull flag formations. The weekly RSI managed to escape overbought territory and turned up just above net neutral (50) which is also bullish. The weekly PMO is on an overbought SELL signal, but it does look like it is decelerating. Upside potential should be well above the current all-time highs based on the length of that flagpole.
Extra Space Storage Inc. (EXR)
EARNINGS: 10/27/2021 (AMC)
Extra Space Storage, Inc. is a real estate investment trust. It operates through the following segments: Self-Storage Operations and Tenant Reinsurance. The Self-Storage Operations segment includes rental operations of wholly-owned stores. The Tenant Reinsurance segment includes reinsurance of risks relating to the loss of goods stored by tenants in stores. The company was founded by Kenneth Musser Woolley on April 30, 2004 and is headquartered in Salt Lake City, UT.
Predefined Scans Triggered: Bullish MACD Crossovers.
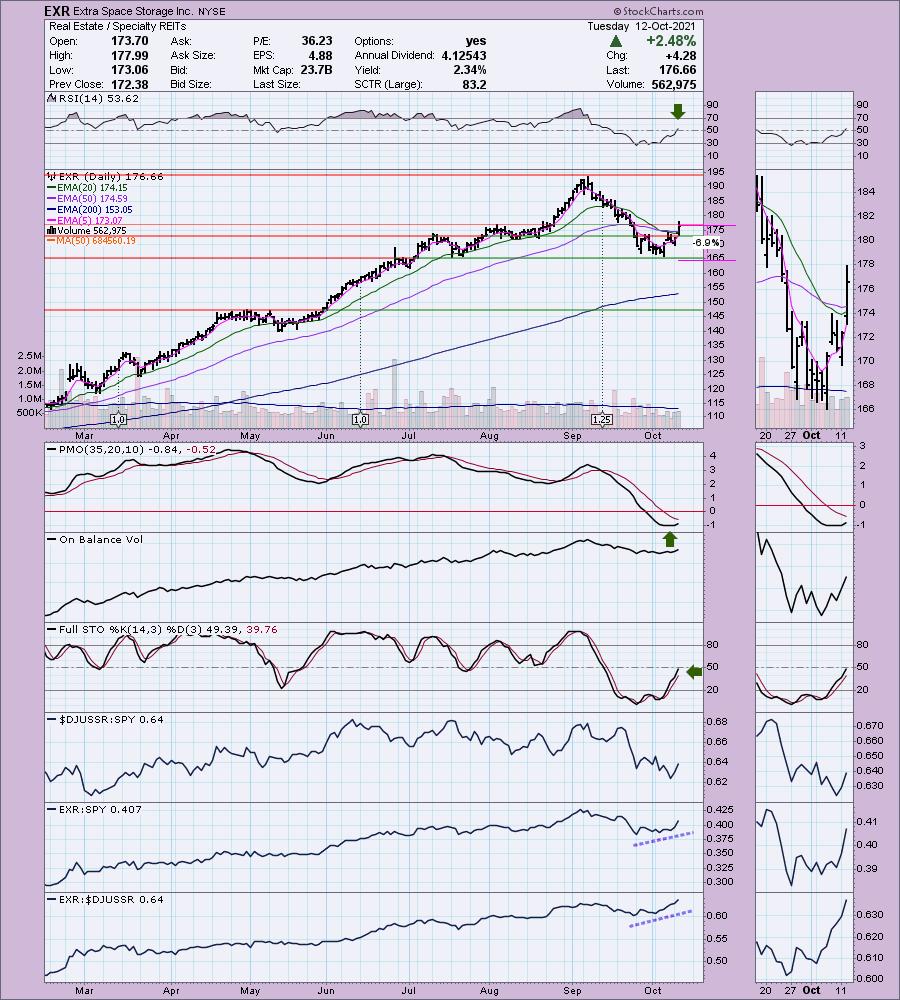
EXR is unchanged in after hours trading. I covered EXR in the May 11th 2020 Diamonds Report. The timing on this one was just a bit off. After the breakout, it declined and just barely hit the 10% stop. If the position were opened about a week later, the position would be up a whopping 92.3%.
As noted above these charts are almost identical so I won't spend a lot of time reviewing. The RSI is now positive, the PMO is turning up in oversold territory. The 5-EMA is headed for a positive crossover the 20-EMA for a ST Trend Model BUY signal. Like CUBE it is outperforming. In this case the stop can be set a bit tighter at 6.9%.
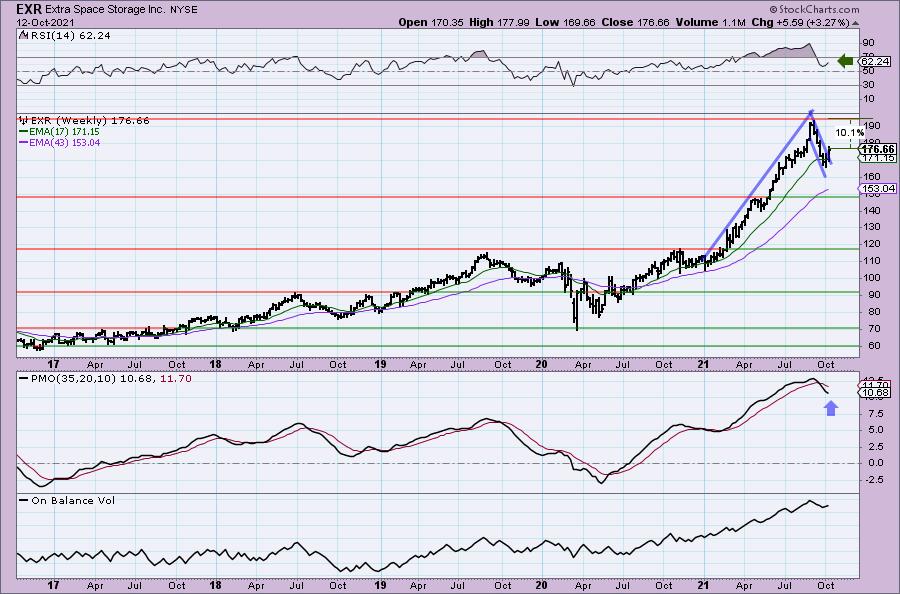
The weekly chart is nearly identical to CUBE. Decelerating weekly PMO and positive weekly RSI, along with a bullish flag formation.
Life Storage, Inc. (LSI)
EARNINGS: 11/4/2021 (AMC)
Life Storage, Inc. is a real estate investment trust, which engages in the acquisition, ownership, and management of self-storage properties. It offers commercial, vehicle, and wine storage services. The company was founded by Robert J. Attea, David L. Rogers, Kenneth F. Myszka, and Charles E. Lannon in 1982 and is headquartered in Buffalo, NY.
Predefined Scans Triggered: None.
LSI is unchanged in after hours trading. I covered this one in the January 27th 2021 Diamonds Report along with CUBE. It had a 3:2 split right after we picked it so the starting price is $80.27 after the adjustment. The stop was never hit so the position is up 50.4%.
The RSI is just entering positive territory and the PMO is nearing an oversold crossover BUY signal. The 5-EMA crossed above the 20-EMA triggering a ST Trend Model BUY signal. Stochastics are strong and it saw a lot of volume today. It is outperforming like the others I've presented today. The stop is set below support at the September low.
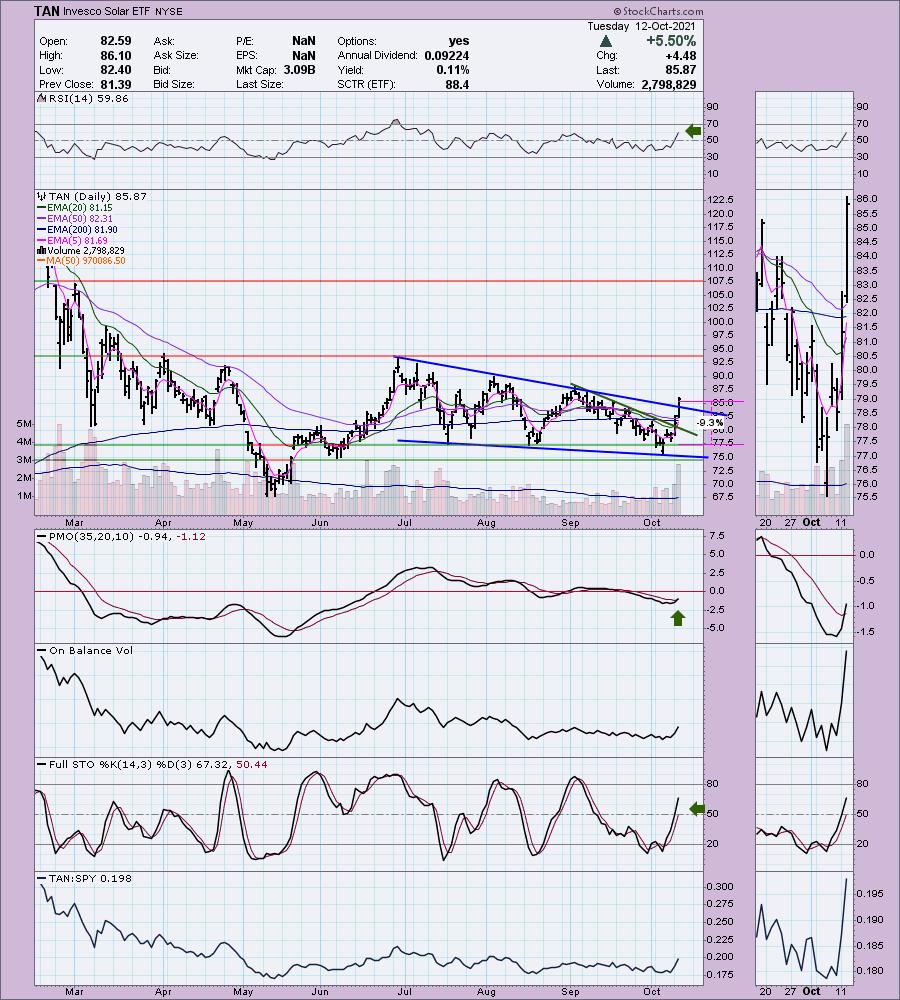
The weekly RSI is positive. The weekly PMO isn't decelerating much yet, but it's only a matter of time. We have another bull flag formation. It's about 7.8% away from its all-time highs. I am looking for it to move higher than that.
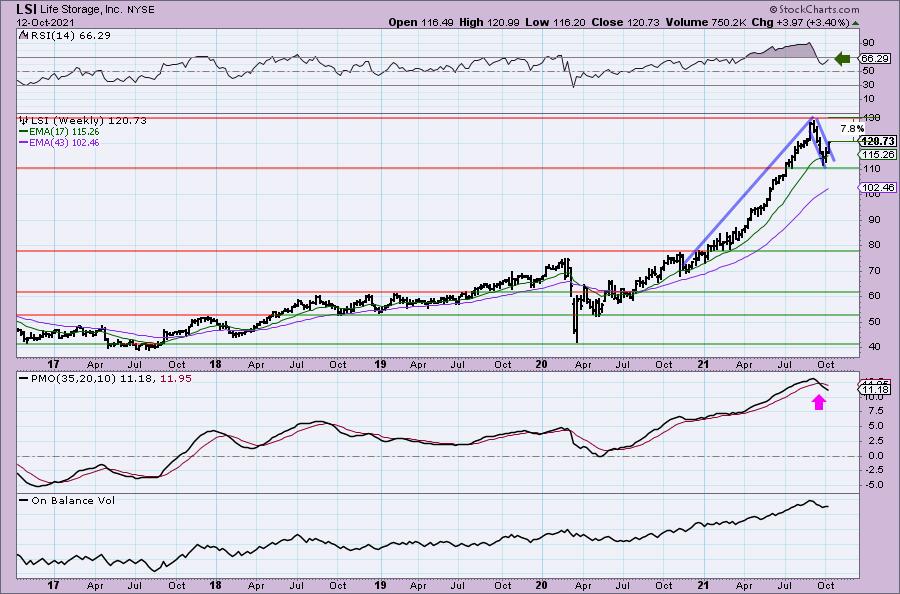
Invesco Solar ETF (TAN)
EARNINGS: N/A
TAN tracks an index of global solar energy companies selected based on the revenue generated from solar related business.
Predefined Scans Triggered: None.
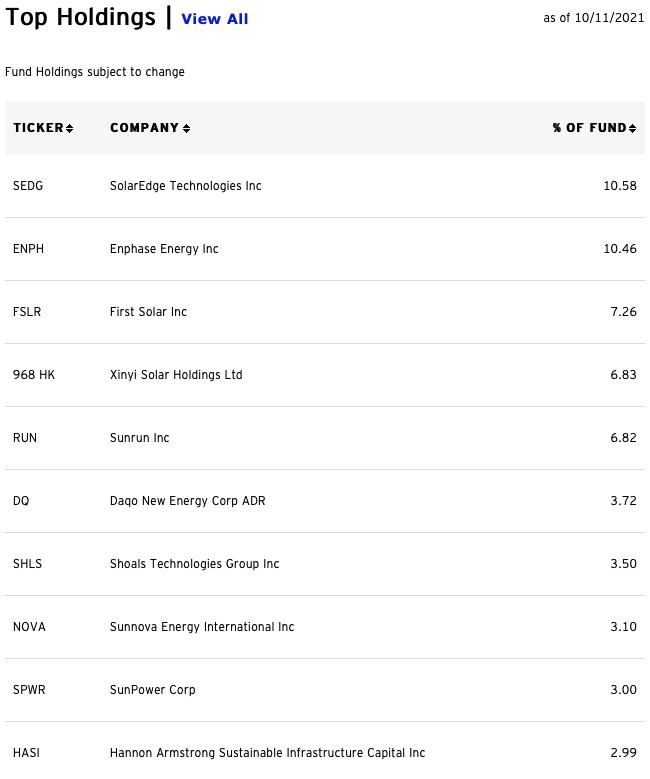
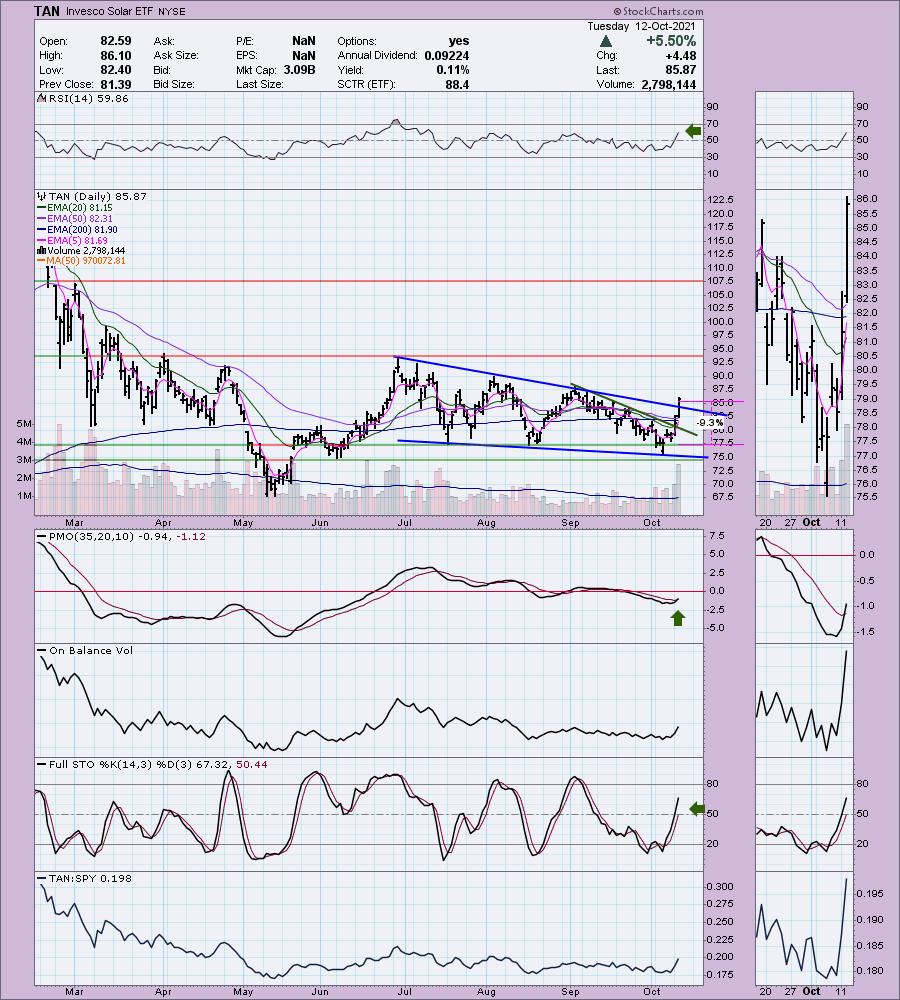
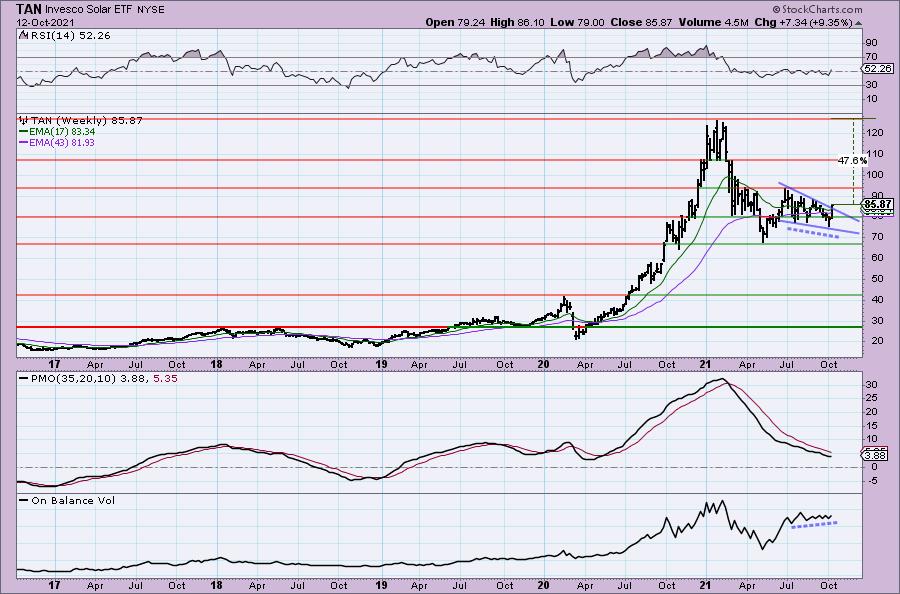
TAN is down -0.43% in after hours trading. I covered it on March 31st 2021. The position was stopped out on a deep 10% stop unfortunately. It was one of many times that Solar burned me (no pun intended) on a fake out breakout. I put it away after that and only looked at it if I saw it show up in the top ten on my ETF Tracker ChartList (If you'd like that ChartList, email me and I'll send a link). I noticed it yesterday and very nearly sent out a quick alert to Diamonds readers, but to be honest, I didn't want to get burned again. I needed more confirmation. Today's breakout from the bullish falling wedge was the confirmation I needed. Since it is down in after hours trading, there may be a good entry coming this week. The RSI is positive now and rising. The PMO had a crossover BUY signal today (more confirmation). It beginning to outperform the SPY. I'm setting another deep stop on it, but you can assess your own risk tolerance and put it wherever you'd like.
The weekly chart is beginning to look good. The weekly RSI just moved into positive territory and the PMO is bottoming in oversold territory. We also have a positive OBV divergence on this breakout from the wedge. Upside potential is excellent.
Don't forget, on Thursdays I look at reader-requested symbols, click HERE to shoot me an email. I read every email I receive and try to answer them all!
Current Market Outlook:
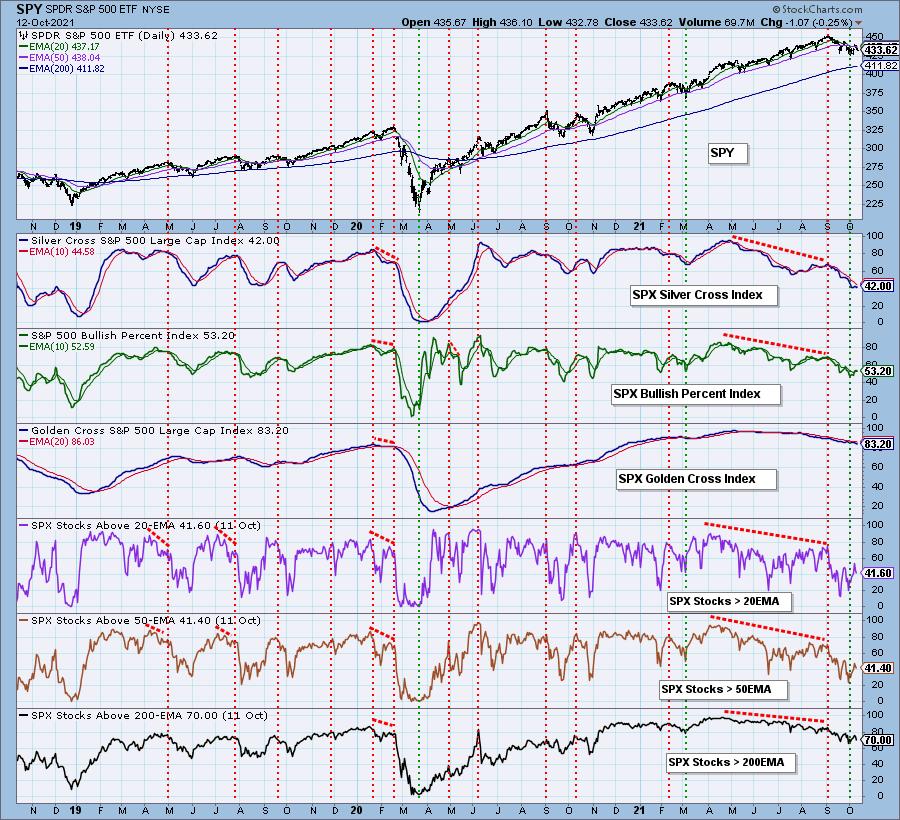
Market Environment: It is important to consider the odds for success by assessing the market tides. The following chart uses different methodologies for objectively showing the depth and trend of participation for intermediate- and long-term time frames.
- The Silver Cross Index (SCI) shows the percentage of SPX stocks on IT Trend Model BUY signals (20-EMA > 50-EMA)
- The Golden Cross Index (GCI) shows the percentage of SPX stocks on LT Trend Model BUY signals (50-EMA > 200-EMA)
- The Bullish Percent Index (BPI) shows the percentage of SPX stocks on Point & Figure BUY signals.
Don't forget that as a "Diamonds" member, you have access to our GCI/SCI curated ChartList on DecisionPoint.com. You'll find it under "Members Only" links on the left side on the Blogs and Links Page.
Here is the current chart:
Full Disclosure: I'm about 70% invested and 30% is in 'cash', meaning in money markets and readily available to trade with. Contemplating adding a small position in TAN, especially if it pulls back a bit tomorrow.
I'm required to disclose if I currently own a stock and if I may buy it within the next 72 hours.
Technical Analysis is a windsock, not a crystal ball.
Happy Charting!
- Erin
erin@decisionpoint.com
Watch the latest episode of DecisionPoint with Carl & Erin Swenlin on Mondays 7:00p EST or on the DecisionPoint playlist on the StockCharts TV YouTube channel here!
NOTE: The stocks reported herein are from mechanical trading model scans that are based upon moving average relationships, momentum and volume. DecisionPoint analysis is then applied to get five selections from the scans. The selections given should prompt readers to do a chart review using their own analysis process. This letter is not a call for a specific action to buy, sell or short any of the stocks provided. There are NO sure things or guaranteed returns on the daily selection of "Diamonds in the Rough."
Helpful DecisionPoint Links:
DecisionPoint Shared ChartList and DecisionPoint Chart Gallery
Price Momentum Oscillator (PMO)
Swenlin Trading Oscillators (STO-B and STO-V)
For more links, go to DecisionPoint.com