
I already brought the Solar ETF (TAN) to the table yesterday. Today, I scoured that group and found a list of excellent candidates that you will see in the "Stocks to Review". I will also go over two of my favorites right now. This industry group has been beat down and appears to be finding favor again. This could be due to a renewed emphasis on clean energy in the upcoming infrastructure package. Whatever the reason, technically the charts are telling me this group has a lot of room to run higher. One subscriber sent me information on Plug Power (PLUG) pairing up with Phillips 66 (PSX) on hydrogen powered vehicles. PLUG was on my radar (wish I'd presented it yesterday when I noticed it!) and hit my scan results again today. So that was a very timely email.
While recording Chartwise Women today, Mary Ellen McGonagle, my co-host, displayed IGV, the ETF that tracks the North American Technology/Software industry. It is breaking out and showing new strength. I've been watching this group closely as well given it had pulled back, leaving us plenty of options. I've brought one stock that Mary Ellen mentioned, but it also came up in my scans so I'm not stealing it completely! The other is a name you likely haven't heard of (I know I hadn't) in this group with plenty of upside potential.
Today's "Diamonds in the Rough": BEEM, CRWD, DCT and PLUG.
"Stocks to Review" (no order): SEDG, ENPH, RUN, SPWR, ACN, CLOU, EPAM and IHAK.

RECORDING LINK Friday (10/8):
Topic: DecisionPoint Diamond Mine (10/8/2021) LIVE Trading Room
Start Time : Oct 8, 2021 09:00 AM
Meeting Recording Link HERE.
Access Passcode: October@8
REGISTRATION FOR FRIDAY 10/15 Diamond Mine:
When: Oct 15, 2021 09:00 AM Pacific Time (US and Canada)
Topic: DecisionPoint Diamond Mine (10/15/2021) LIVE Trading Room
Register in advance for this webinar HERE.
Save the registration confirmation email with login instructions in case Zoom doesn't notify you in time.

Free DP Trading Room (10/11) RECORDING LINK:
Topic: DecisionPoint Trading Room
Start Time : Oct 11, 2021 09:00 AM
Meeting Recording LINK.
Access Passcode: October#11
For best results, copy and paste the access code to avoid typos.
Welcome to DecisionPoint Daily Diamonds, wherein I highlight five "Diamonds in the Rough." These are selected from the results of my DecisionPoint scans, which search for stocks that could benefit from the trend and condition of the market. Remember, these are not recommendations to buy or sell, but are the most interesting of the stocks that surfaced in my scans. My objective is to save you the work of the initial, tedious culling process, but you need to apply your own analysis to see if these stocks pique your interest as well. There are no guaranteed winners here!
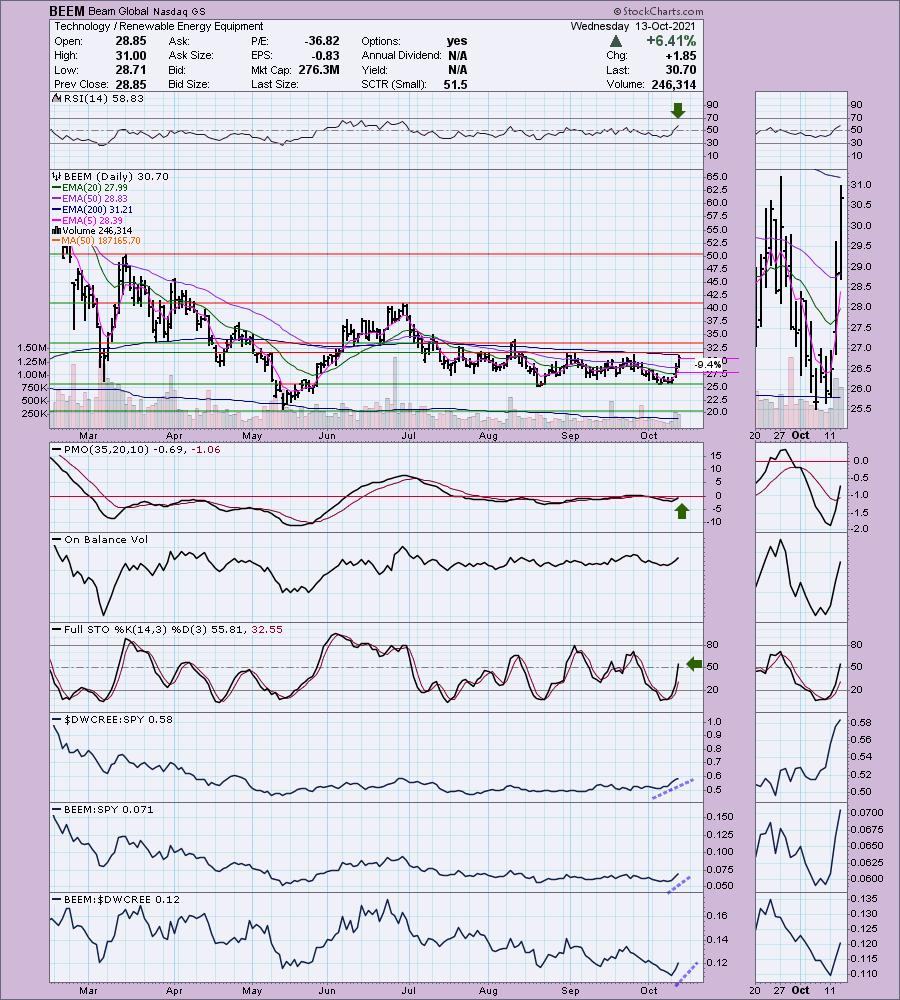
Beam Global (BEEM)
EARNINGS: 11/11/2021 (AMC)
Beam Global engages in the invention, design, engineering, manufacture, and sale of solar powered products. It offers solar powered products and proprietary technology solutions for electric vehicle charging infrastructure, out of home advertising platforms, and energy security and disaster preparedness. The company was founded by Robert Lane Noble on June 12, 2006 and is headquartered in San Diego, CA.
Predefined Scans Triggered: New CCI Buy Signals, Bullish MACD Crossovers and Entered Ichimoku Cloud.
BEEM is already up +0.98% in after hours trading. While BEEM hasn't actually broken from its trading range, it has the underlying momentum to do so. The PMO just triggered a crossover BUY signal. The RSI is now firmly in positive territory, something we haven't seen since June. Stochastics are rising and %K is now above 50 which is very bullish. Volume is beginning to come in. The stop is deep, but what can you do when the stock was up 6.4% today?
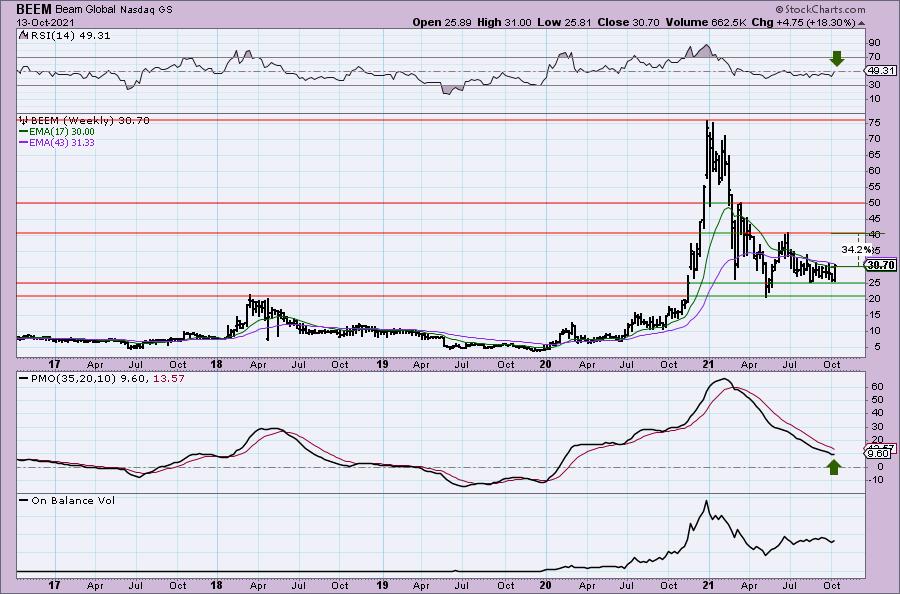
The weekly chart is very favorable. The weekly RSI is rising and has nearly hit positive territory. The weekly PMO is bottoming just as price has bounced once again of intermediate-term support at $25. Even if it can only reach overhead resistance at $40, that would be a tidy 34% gain. However, I think it will go even higher.
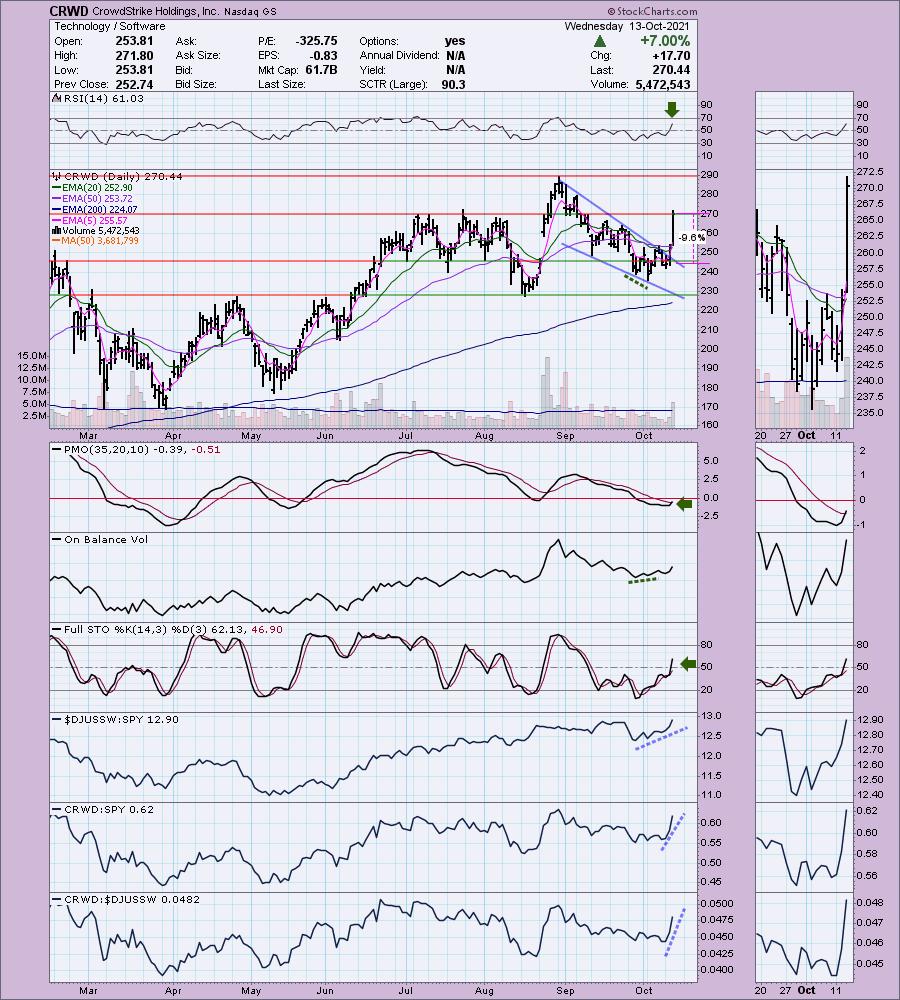
CrowdStrike Holdings, Inc. (CRWD)
EARNINGS: 12/1/2021 (AMC)
CrowdStrike Holdings, Inc. is a holding company, which engages in the provision of cloud-delivered solution for next-generation endpoint protection that offers cloud modules on its Falcon platform through SaaS subscription-based model. It operates through Domestic and International geographical segments. The firm's services include incident response services; proactive services, tabletop exercises, adversary emulation, clod security assessment, and blue team exercises. The company was founded by George P. Kurtz, Marston Gregg, and Dmitri Alperovitch on November 7, 2011 and is headquartered in Sunnyvale, CA.
Predefined Scans Triggered: New CCI Buy Signals, P&F Spread Triple Top Breakout, Moved Above Upper Bollinger Band, Moved Above Ichimoku Cloud, Moved Above Upper Price Channel and P&F Double Top Breakout
CRWD is up +0.21% in after hours trading. I've covered CRWD twice before. First on August 3rd 2020 where the position was stopped out quickly. Timing was slightly off given after that fall, it proceeded to march higher. Last time was on May 20th 2021. The timing was excellent on that position. The stop has not been hit so the position is up 32.5%.
Today's giant breakout follows yesterday's break from the bullish falling wedge. It was a stunning 7% move today, but given the chart setup, I believe we will see it move much higher. The RSI is positive and the PMO triggered a crossover BUY signal today. Stochastics are rising and are not yet overbought. We have a positive OBV divergence that led into the current rally. Setting the stop is difficult given today's gain, but I have set it up just below support at the July lows.
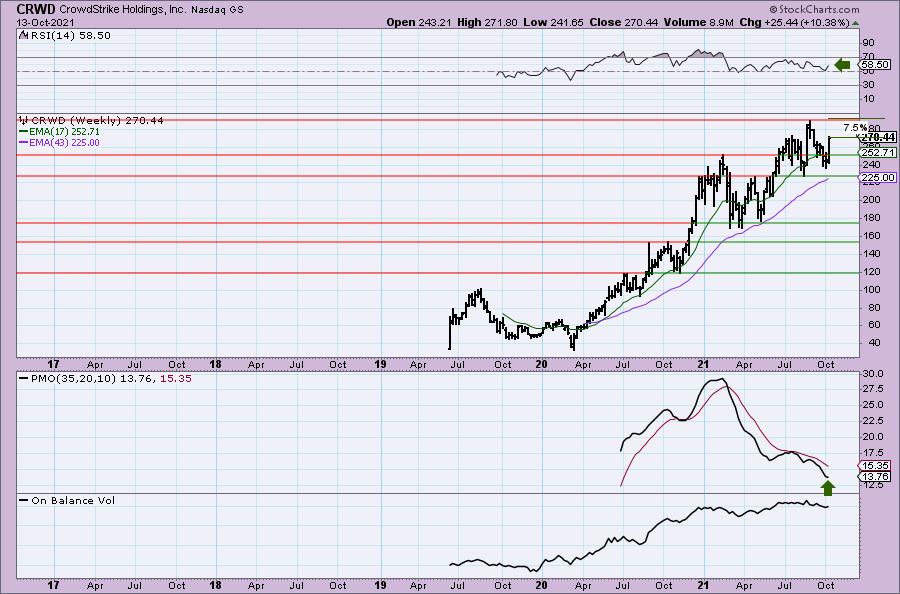
The weekly PMO is turning back up in oversold territory and the weekly RSI is positive. It's only about 7% from its all-time high, but I am looking for at least a 20%+ upside target.
Duck Creek Technologies Inc. (DCT)
EARNINGS: 10/14/2021 (AMC)
Duck Creek Technologies, Inc. provides SaaS platform solutions for the property and casualty insurance industry. Its products include Duck Creek policy, billing, claims, insights, ratings, distribution management, digital engagement, reinsurance management, and Duck Creek industry content. The company was founded in 2000 and is headquartered in Boston, MA.
Predefined Scans Triggered: None.
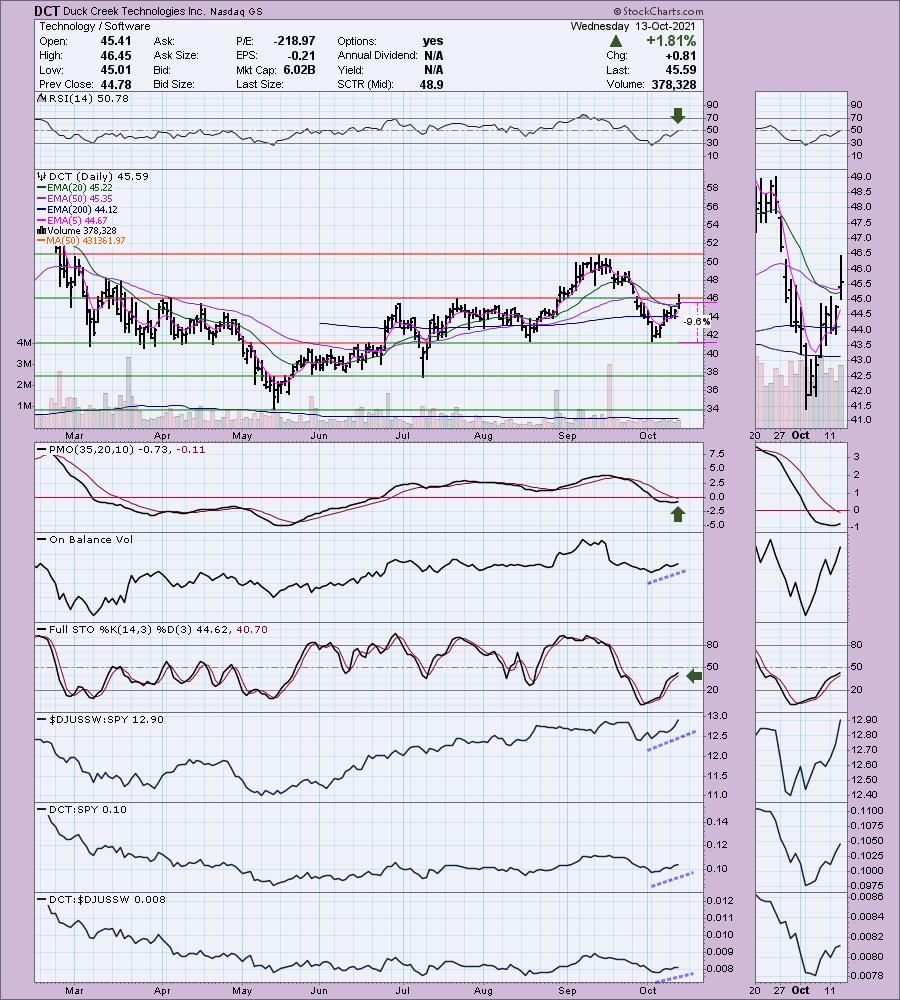
DCT is up +1.34% in after hours trading. NOTE: It reports earnings tomorrow! It should do well given the technicals. The RSI just entered positive territory and the PMO is turning back up just below the zero line. We have a "V" bottom pattern that has retraced more than 1/3rd of the pattern moving back up. The expectation is a breakout above the left side of the "V". The OBV is confirming the rally and Stochastics are ripening as %K is nearly above net neutral (50). The stop is deep here. You could tighten it up considerable by moving it just below the 200-EMA.
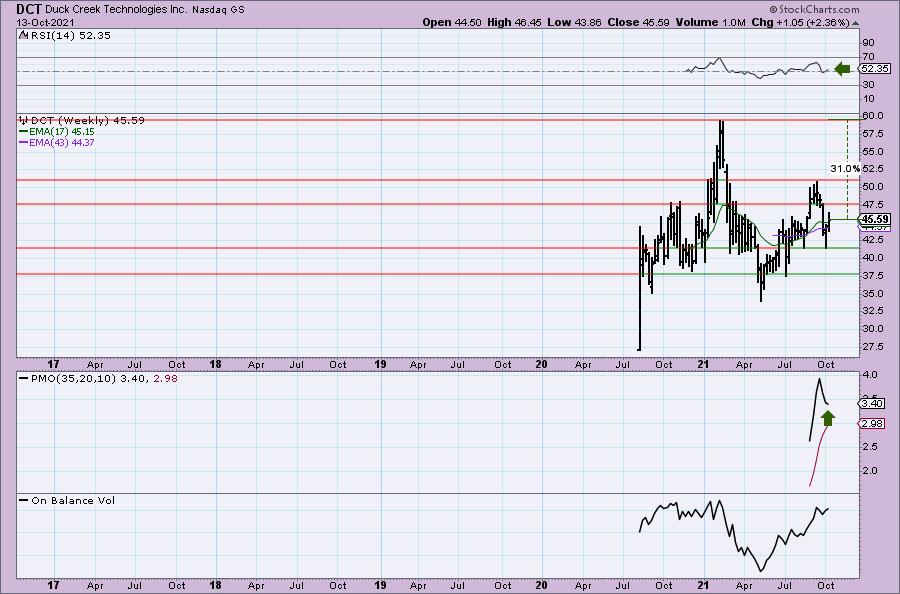
Not much data on the weekly chart, but we do know the weekly PMO is decelerating and the weekly RSI is positive and rising. It may not be a sexy software stock, but there is upside potential of 31%.
Plug Power, Inc. (PLUG)
EARNINGS: 11/9/2021 (AMC)
Plug Power, Inc. provides alternative energy technology, which focuses on the design, development, commercialization, and manufacture of hydrogen and fuel cell systems used primarily for the material handling and stationary power markets. Its fuel cell system solution is designed to replace lead-acid batteries in electric material handling vehicles and industrial trucks for some distribution and manufacturing businesses. The company was founded by George C. McNamee and Larry G. Garberding on June 27, 1997 and is headquartered in Latham, NY.
Predefined Scans Triggered: Gap Ups, Moved Above Ichimoku Cloud, Runaway Gap Ups, P&F Ascending Triple Top Breakout, P&F Double Top Breakout and Strong Volume Gainers
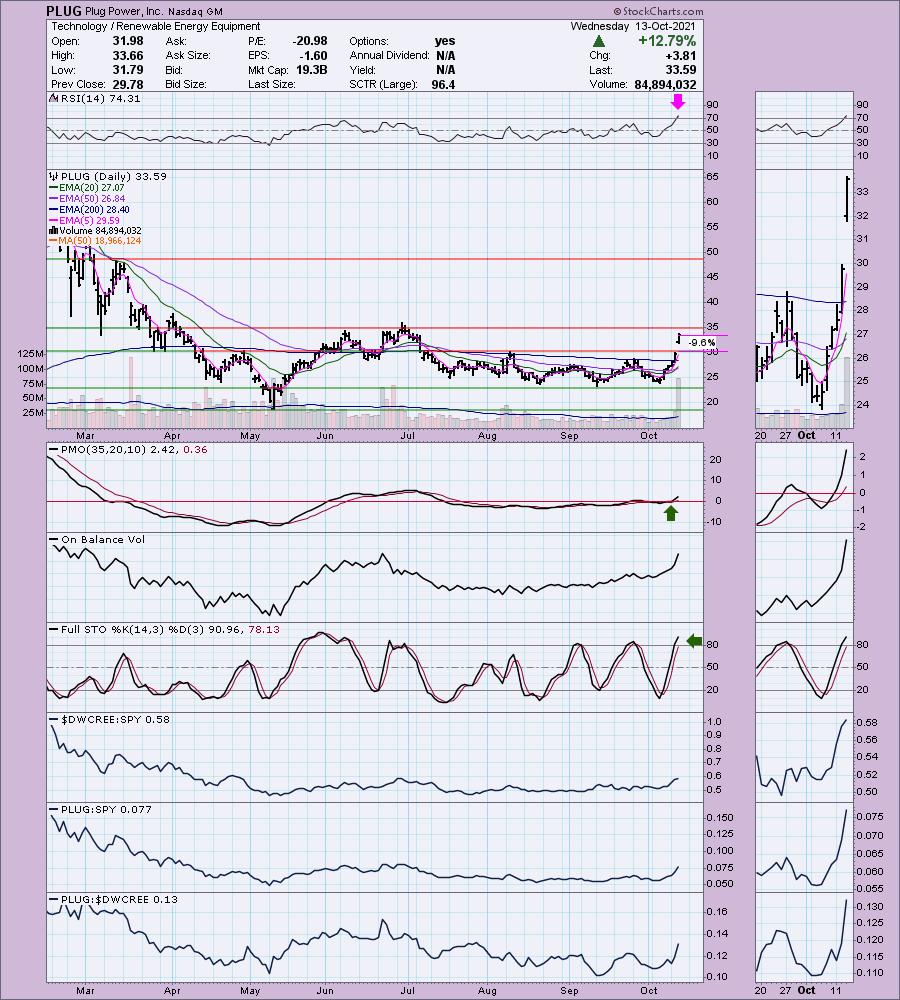
PLUG is up +1.25% in after hours trading. I covered PLUG on August 10th 2021. I believed it was ready to breakout, but it meandered in this trading range further with the stop being hit on the mid-August pullback. The indicators are ripe again only this time we have a strong breakout. It is getting ready to hit overhead resistance, but we have what appears to be a strong breakaway gap up. Today a new IT Trend Model "Silver Cross" BUY signal was triggered as the 20-EMA crossed above the 50-EMA. The last time PLUG was on a "Silver Cross" BUY signal was early July. The RSI and Stochastics are overbought, but I suspect they will continue to stay overbought until price finds overhead resistance and that could be at the June top or the March top. The PMO looks very healthy as it rises in positive territory. Clearly volume is coming in. The stop is deep, but it is set on strong support.
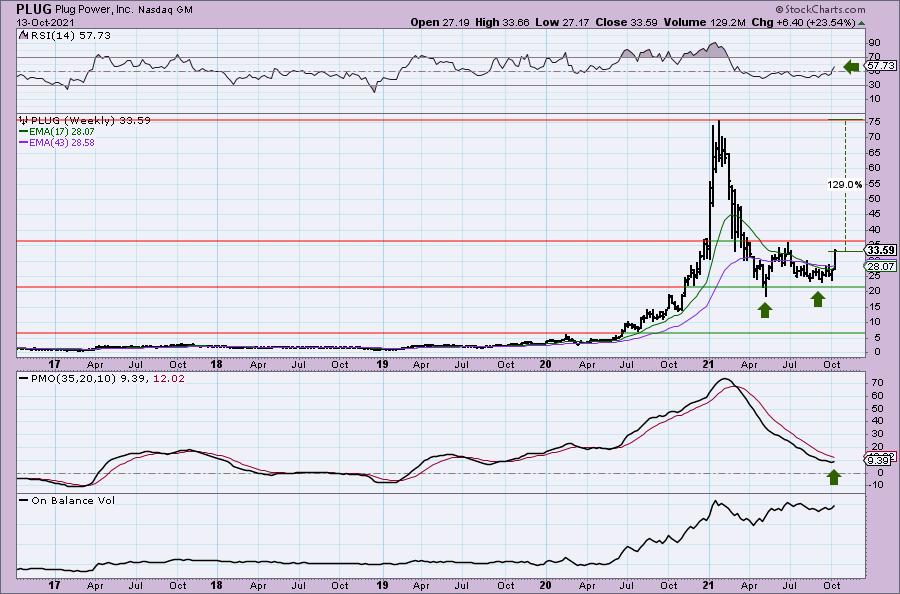
The weekly chart tells me this could be an excellent intermediate-term investment. The weekly RSI is now in positive territory and the weekly PMO has turned up. We have an Adam and Eve double-bottom pattern. The confirmation line is at the June top which shouldn't be a problem based on the daily chart. Once above this level, there isn't much in the way of overhead resistance. This one could actually see an over 100% gain. As a side note, this is an excellent example of a parabolic breakdown. It's now set a new basing pattern with this double-bottom.
Don't forget, on Thursdays I look at reader-requested symbols, click HERE to shoot me an email. I read every email I receive and try to answer them all!
Current Market Outlook:
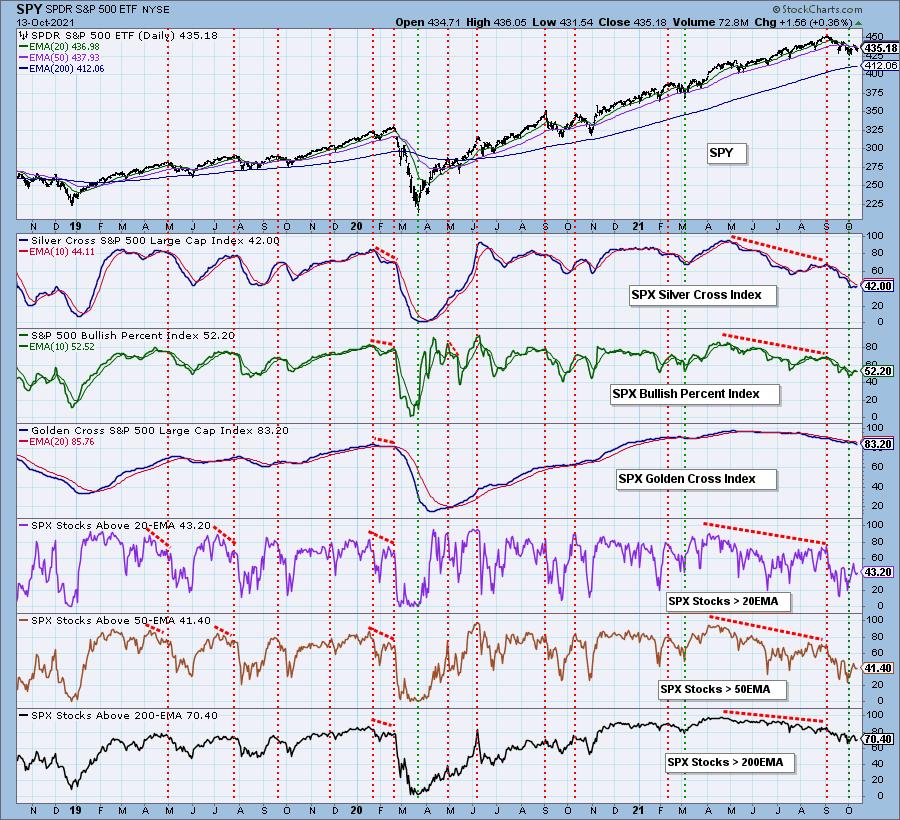
Market Environment: It is important to consider the odds for success by assessing the market tides. The following chart uses different methodologies for objectively showing the depth and trend of participation for intermediate- and long-term time frames.
- The Silver Cross Index (SCI) shows the percentage of SPX stocks on IT Trend Model BUY signals (20-EMA > 50-EMA)
- The Golden Cross Index (GCI) shows the percentage of SPX stocks on LT Trend Model BUY signals (50-EMA > 200-EMA)
- The Bullish Percent Index (BPI) shows the percentage of SPX stocks on Point & Figure BUY signals.
Don't forget that as a "Diamonds" member, you have access to our GCI/SCI curated ChartList on DecisionPoint.com. You'll find it under "Members Only" links on the left side on the Blogs and Links Page.
Here is the current chart:
Full Disclosure: I'm about 65% invested and 35% is in 'cash', meaning in money markets and readily available to trade with. I was stopped out of a position so it has lowered my exposure. It was a busy morning and sadly I didn't get a position in solar... yet! I want PLUG on a pullback.
I'm required to disclose if I currently own a stock and if I may buy it within the next 72 hours.
Technical Analysis is a windsock, not a crystal ball.
Happy Charting!
- Erin
erin@decisionpoint.com
Watch the latest episode of DecisionPoint with Carl & Erin Swenlin on Mondays 7:00p EST or on the DecisionPoint playlist on the StockCharts TV YouTube channel here!
NOTE: The stocks reported herein are from mechanical trading model scans that are based upon moving average relationships, momentum and volume. DecisionPoint analysis is then applied to get five selections from the scans. The selections given should prompt readers to do a chart review using their own analysis process. This letter is not a call for a specific action to buy, sell or short any of the stocks provided. There are NO sure things or guaranteed returns on the daily selection of "Diamonds in the Rough."
Helpful DecisionPoint Links:
DecisionPoint Shared ChartList and DecisionPoint Chart Gallery
Price Momentum Oscillator (PMO)
Swenlin Trading Oscillators (STO-B and STO-V)
For more links, go to DecisionPoint.com