
Reader Requests were weighted heavily toward the Consumer Discretionary sector (XLY). With the holidays coming up and many people shopping early for end of year gift giving, this sector could see some positive action moving forward.
We also had a rather new Trucking company requested. The Truckers are moving quickly to the upside. With supply chain issues still an issue, the Truckers should continue to outperform.
I have also listed an opportunity below to download an eBook compilation that includes 16 chapters by some of the industry's premier technical analysts. I've written a chapter on the Golden/Silver Cross Indexes and participation. If you download the eBook, you're automatically registered to attend the live webinar on November 3rd and 4th. I'll be presenting LIVE an in depth look at Climax Analysis and how it helps identify key pivot points in the market. Your support is DEFINITELY appreciated! So whether you can attend or not, download the book! Here is the link.
Don't forget to sign up to attend tomorrow's live Diamond Mine trading room! If you can't attend live, you'll always find the links in each and every DP Diamonds Report. Here is the link to register.
Today's "Diamonds in the Rough": DENN, HAS, MCD, TSP and UAA.

RECORDING LINK Friday (10/22):
Topic: DecisionPoint Diamond Mine (10/22/2021) LIVE Trading Room
Start Time : Oct 22, 2021 09:00 AM
Meeting Recording Link HERE.
Access Passcode: October@22
REGISTRATION FOR FRIDAY 10/29 Diamond Mine:
When: Oct 29, 2021 09:00 AM Pacific Time (US and Canada)
Topic: DecisionPoint Diamond Mine (10/29/2021) LIVE Trading Room
Register in advance for this webinar HERE.
Save the registration confirmation email with login instructions in case Zoom doesn't notify you in time.

Free DP Trading Room (10/18) RECORDING LINK:
Topic: DecisionPoint Trading Room
Start Time: Oct 25, 2021 09:00 AM
Meeting Recording LINK.
Access Passcode: October#25
For best results, copy and paste the access code to avoid typos.
Welcome to DecisionPoint Daily Diamonds, wherein I highlight five "Diamonds in the Rough." These are selected from the results of my DecisionPoint scans, which search for stocks that could benefit from the trend and condition of the market. Remember, these are not recommendations to buy or sell, but are the most interesting of the stocks that surfaced in my scans. My objective is to save you the work of the initial, tedious culling process, but you need to apply your own analysis to see if these stocks pique your interest as well. There are no guaranteed winners here!
Denny's Corp. (DENN)
EARNINGS: 11/2/2021 (AMC)
Denny's Corp. engages in the operation of restaurants and franchised, and licensed restaurants. It offers offers a wide selection of lunch and dinner items including burgers, sandwiches, salads and skillet entrées, along with an assortment of beverages, appetizers, and desserts. The company was founded by Harold Butler and Richard Jezak in 1953 and is headquartered in Spartanburg, SC.
Predefined Scans Triggered: Elder Bar Turned Green, Bullish MACD Crossovers and Parabolic SAR Buy Signals.
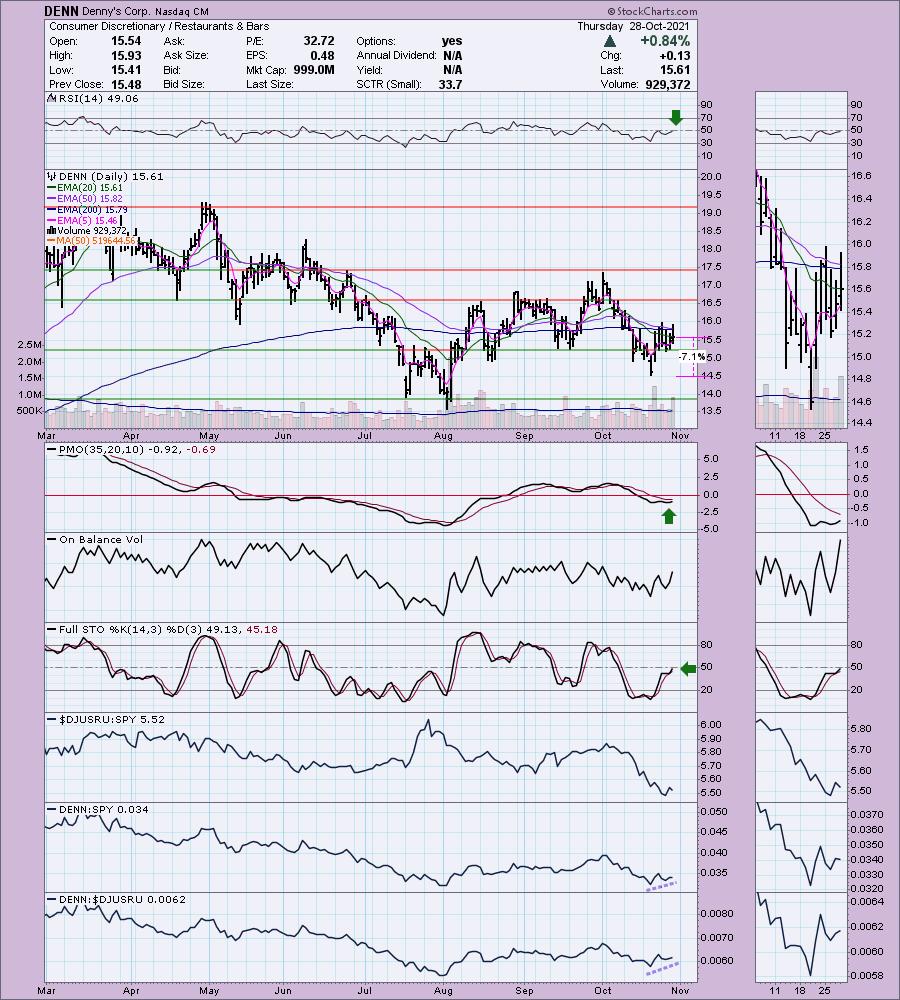
DENN is up +1.60% in after hours trading. I like the bottoming formation on price. I would like to see price get above all four moving averages. It is razor close to a "death cross" LT SELL signal. The PMO is rising again and the RSI is nearing positive territory. Stochastics are very bullish as they head upward and toward positive territory. The group has been distressed, but it could be ready to outperform again. DENN is performing well against the group and the SPY. The stop is about 7% which lines up just below the October low.
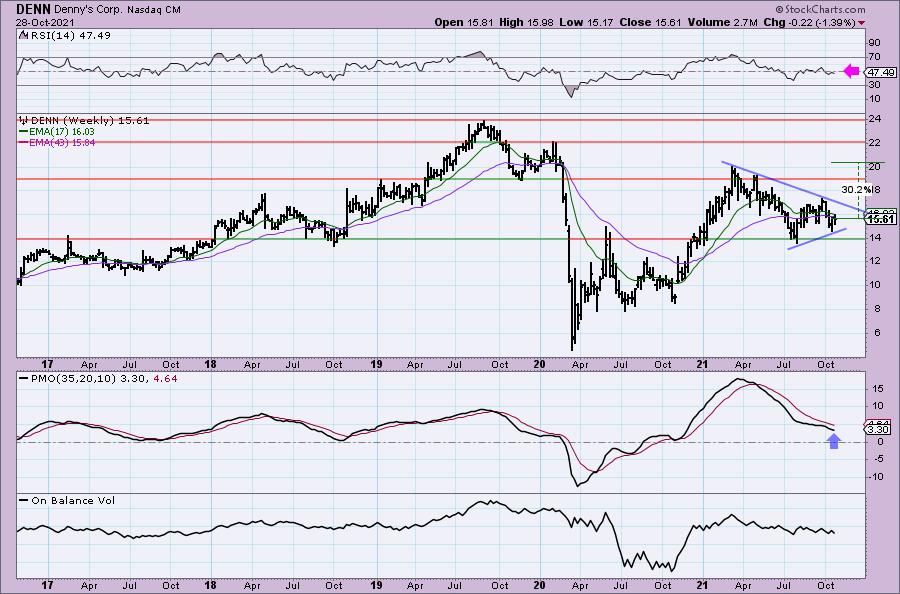
The weekly chart somewhat bearish. The RSI is negative, although not far from positive territory. The weekly PMO is headed lower but may be decelerating. We have a symmetrical triangle pattern that implies a breakout ahead.
Hasbro, Inc. (HAS)
EARNINGS: 2/8/2022 (BMO)
Hasbro, Inc. engages in the provision of children and family leisure time products and services with a portfolio of brands and entertainment properties. The firm operates under the following brands: Littlest Pet Shop and Magic: The Gathering, Monopoly, My Little Pony, Nerf, Play-Doh and Transformers. It operates through the following segments: United States and Canada, International, and Entertainment, Licensing and Digital and eOne. The United States and Canada segment refers to the marketing and sale of products in the United States and Canada which include the innovation and reinvention of toys and games. The International segment engages in the marketing and sale of product categories to retailers and wholesalers in Europe, Latin and South America, and the Asia Pacific region and through distributors in those countries where there is no direct presence. The Entertainment, Licensing and Digital segment conducts movie, television and digital gaming entertainment operations. The eOne segment engages in the development, acquisition, production, financing, distribution and sale of entertainment content and also consists of all legacy eOne operations. The company was founded by Henry Hassenfeld and Hilal Hassenfeld in 1923 and is headquartered in Pawtucket, RI.
Predefined Scans Triggered: Stocks in a New Uptrend (Aroon), P&F Ascending Triple Top Breakout, entered Ichimoku Cloud and P&F Double Top Breakout.
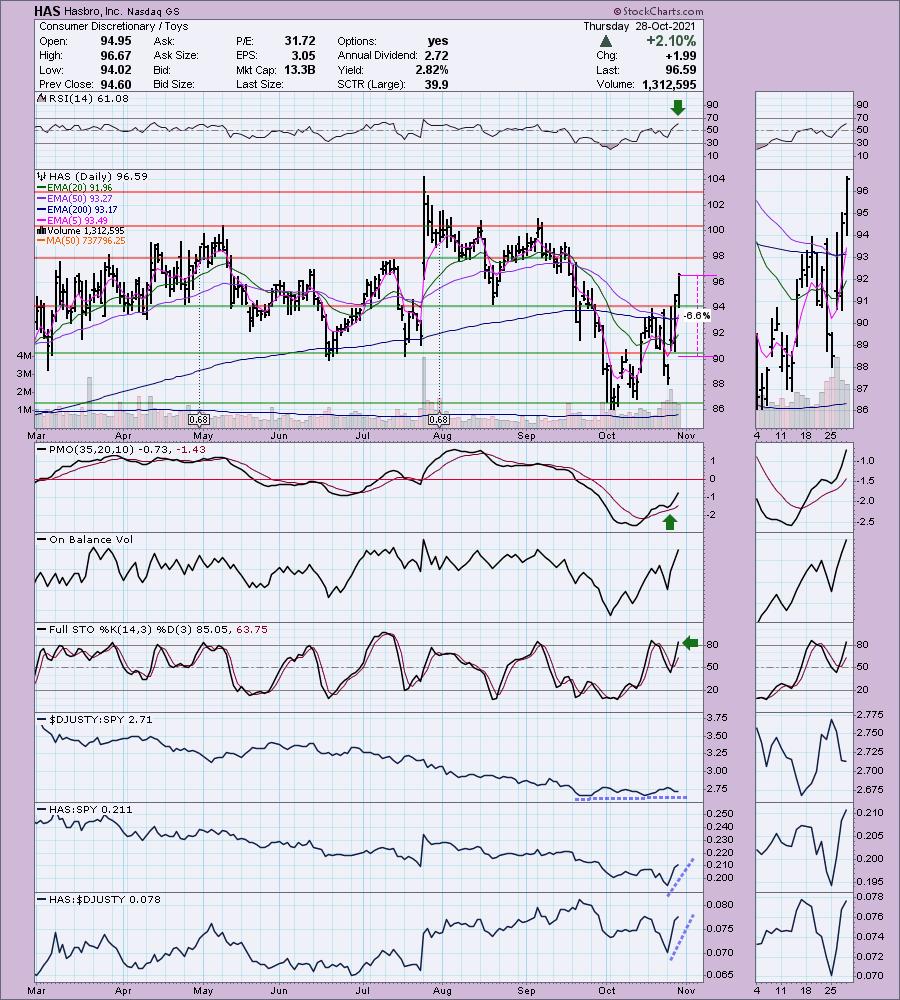
HAS is down -1.13% in after hours trading. Price is coming out of a trading zone between $86 and $94. It triggered a "Death Cross" of the 50/200-EMAs, but promptly whipsawed back into a LT Trend Model "Golden Cross" BUY signal. The RSI is firmly planted in positive territory and the PMO is accelerating upward on an oversold crossover BUY signal. Stochastics are rising, albeit overbought. The group has been performing in line with the SPY, but HAS has been outperforming both by leaps and bounds on this recent rally. The stop is set below support at the June/July lows at 6.6%.
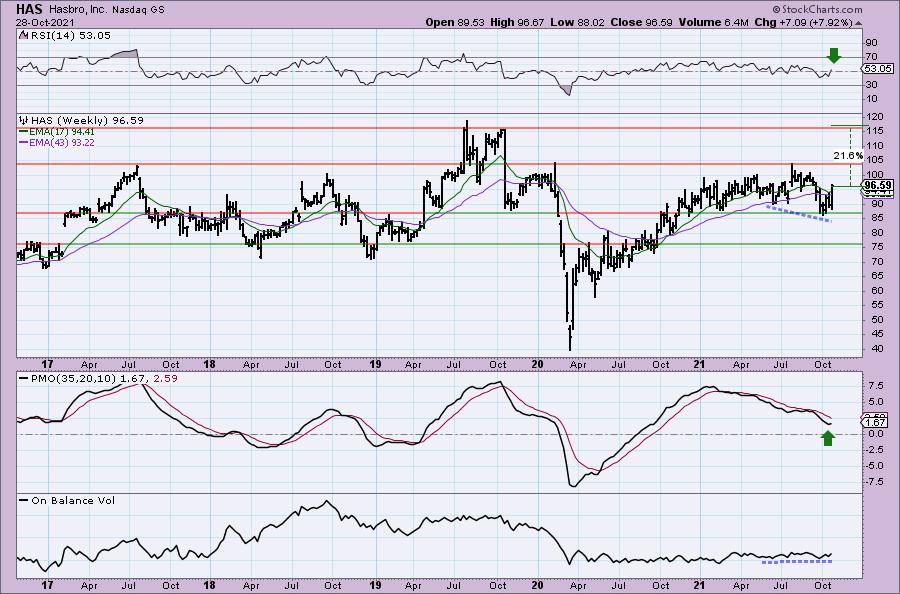
The weekly chart is firming up with the weekly RSI just now hitting positive territory and the weekly PMO turning back up above the zero line. I even spot a slight positive OBV divergence going into this rally. Despite being a mostly sideways trading stock, if it can get above overhead resistance at the 2020/2021 highs, we could get a gain of over 21%.
McDonalds Corp. (MCD)
EARNINGS: 1/27/2022 (BMO)
McDonald's Corp. engages in the operation and franchising of restaurants. It operates through the following segments: U.S.; International Operated Markets, and International Developmental Licensed Markets and Corporate. The U.S. segment focuses its operations in the United States. The International Operated Markets segment comprises operations and franchising of restaurant in Australia, Canada, France, Germany, Italy, the Netherlands, Russia, Spain, and the U.K. The International Developmental Licensed Markets and Corporate segment consists developmental licensee and affiliate markets in the McDonald's system. The firm's products include Big Mac, Quarter Pounder with Cheese, Filet-O-Fish, several chicken sandwiches, Chicken McNuggets, wraps, McDonald's Fries, salads, oatmeal, shakes, McFlurry desserts, sundaes, soft serve cones, pies, soft drinks, coffee, McCafe beverages, and other beverages. The company was founded by Raymond Albert Kroc on April 15, 1955 and is headquartered in Oak Brook, IL.
Predefined Scans Triggered: Parabolic SAR Buy Signals and P&F Double Top Breakout.
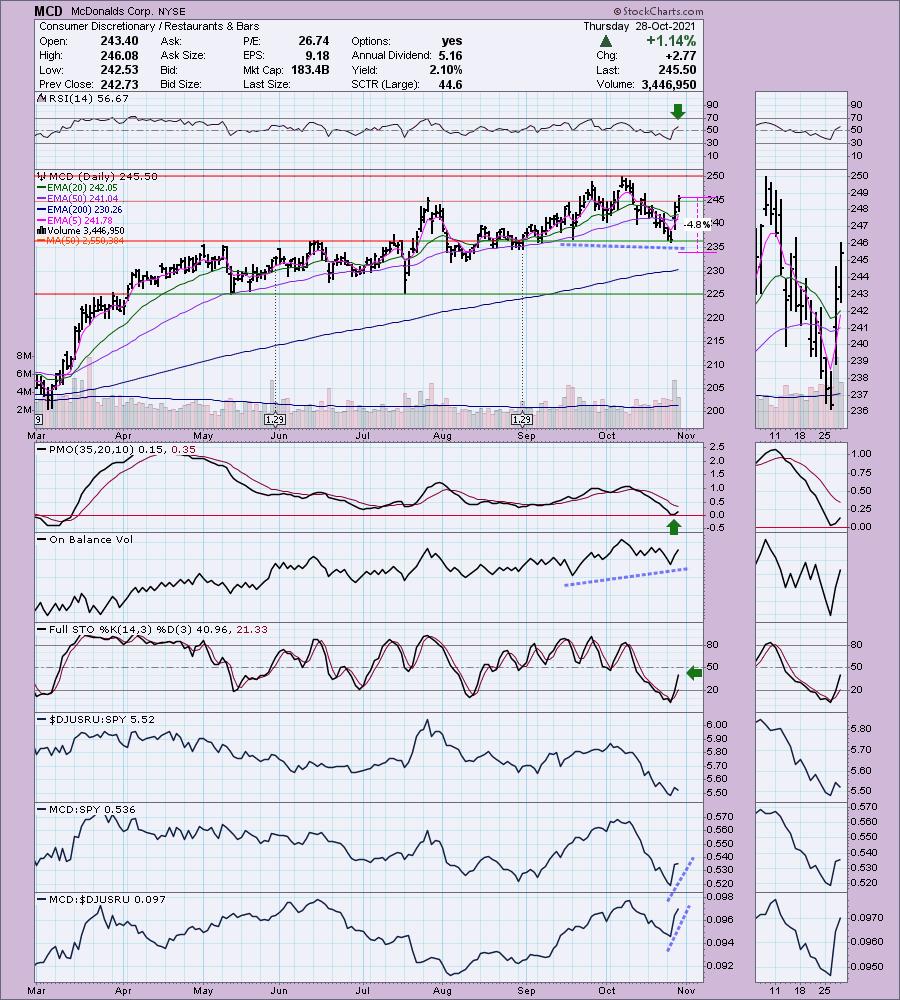
MCD is down -0.03% in after hours trading. MCD just reported earnings and price is rallying on big volume. This is usually a characteristic of a stock that will see an upcoming breakout. The RSI is now positive and the PMO has turned up just above the zero line. There is a positive OBV divergence leading into this rally which also suggests a breakout ahead. Stochastics are rising quickly. Again, this group has been struggling, but MCD is showing great relative strength. The stop can be set thinly at around 5% or even 6%.
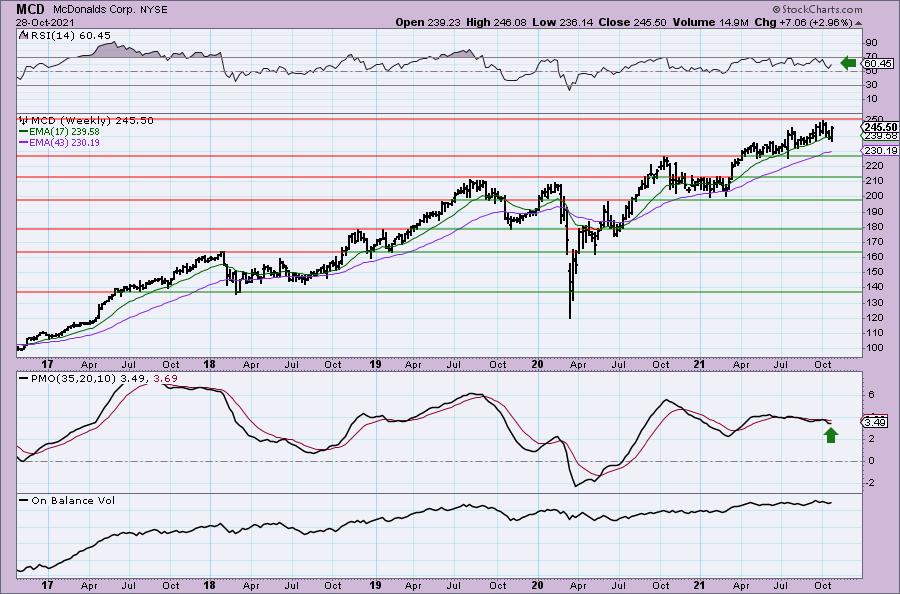
The weekly PMO is turning up. The weekly RSI has been in positive territory for months and is not overbought. Upside potential can't be listed as it is nearing all-time highs, but I would set my upside target at least 18%.

In light of the holiday season, I'd like to present you a special gift...
It contains my chapter on the Golden and Silver Cross Indexes. I believe these are the best breadth indicators out there so read all about it! It's all contained in this new eBook:
Are You a Naughty Trader?
Discover: 16 Proven Strategies to Capture Holiday Market Moves
You can get it here at no cost.
Best,
Erin
P.S. I almost forgot to mention...when you grab this eBook you will receive complimentary access to a 2-day virtual live event happening on November 3rd and 4th where I will be presenting my strategy, live! I will dive into the power of trading during a "climax day" and help you identify both upside and downside climax days and whether
you should trade, or let it be... You can watch live on November 3rd at 5:00p ET. Click here to get a copy today!
TuSimple Holdings Inc. (TSP)
EARNINGS: 11/3/2021 (AMC)
TuSimple Holdings, Inc. engages in the operation and development of autonomous trucks. It develops autonomous technology specifically designed for semi-trucks, which build the autonomous freight network in partnership with shippers, carriers, railroads, freight brokers, fleet asset owners, and truck hardware partners. The company was founded by Mo Chen and Xiao Di Hou in 2015 and is headquartered in San Diego, CA.
Predefined Scans Triggered: Parabolic SAR Buy Signals, Elder Bar Turned Green, New CCI Buy Signals, Bullish MACD Crossovers and Entered Ichimoku Cloud.
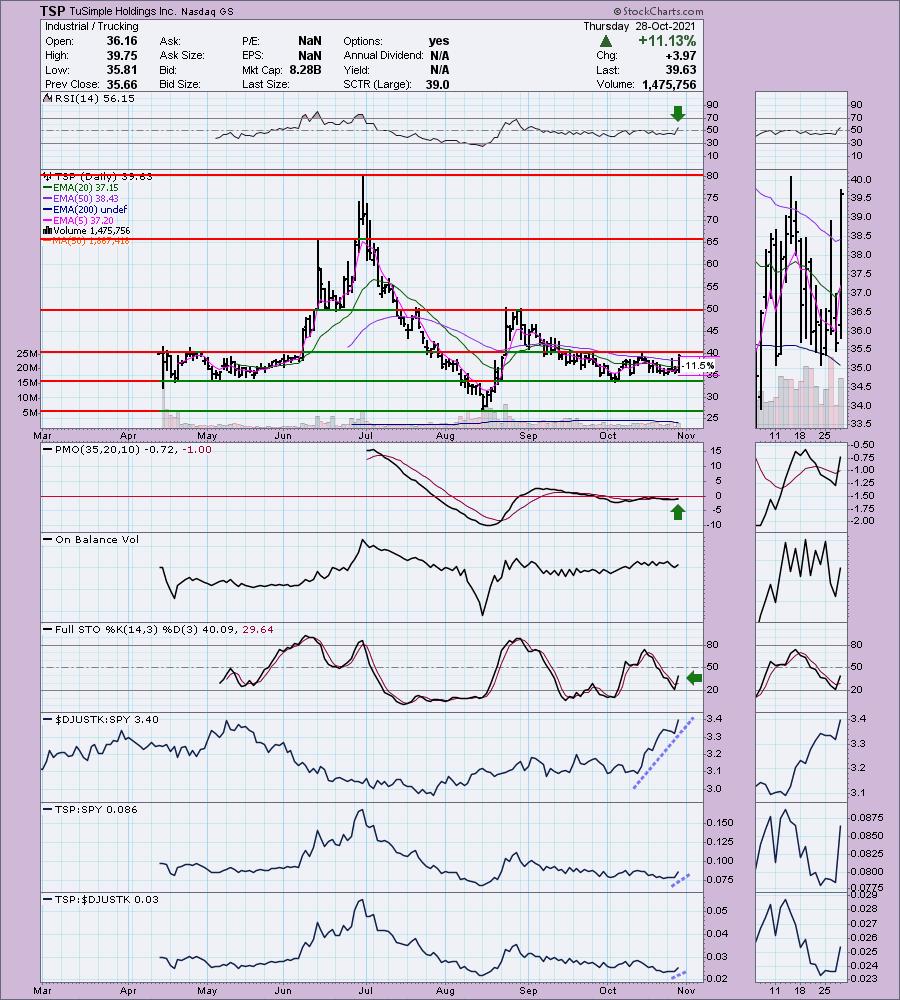
TSP is down -1.59% in after hours trading. I don't like to see after hours trading suffering on "Diamonds in the Rough", but there you are. It did have a huge 11%+ rally today, so consider this an opportunity to buy on a pullback if it does continue lower tomorrow. It's in a trading range, but today was the first time that it has closed above the 50-EMA since it dropped below back in early September. The PMO has triggered a new crossover BUY signal on today's big rally. Be aware they do report earnings next week. Stochastics are just starting to rise. The group has been killing it but this one not so much. However, it is beginning to get some love. Because we had an over 11% move today, the stop is really deep, but you can adjust that if you get in lower. I'd want to set it below this trading range.
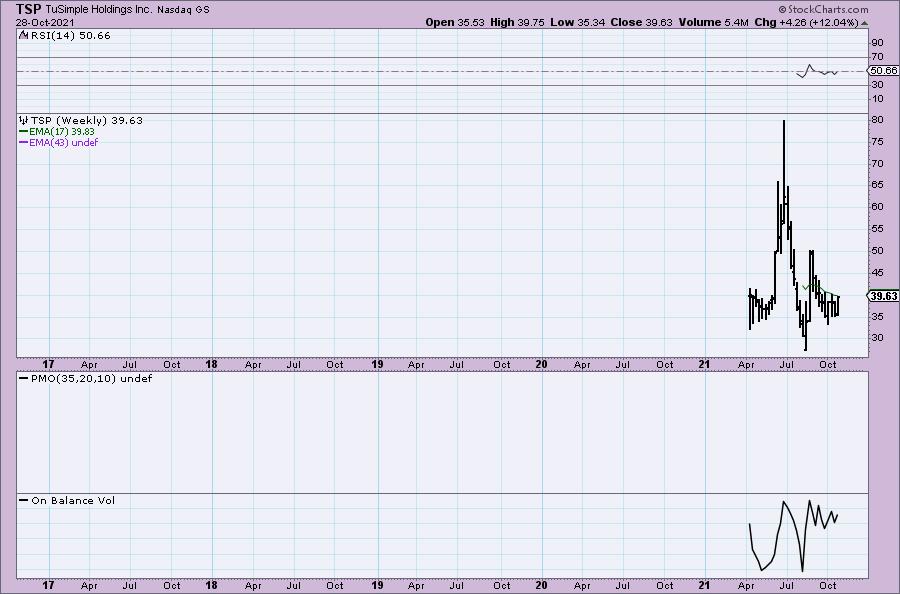
Nothing to comment on, not enough data, but the weekly RSI is positive right now.
Under Armour, Inc. (UAA)
EARNINGS: 11/2/2021 (BMO)
Under Armour, Inc. engages in the development, marketing, and distribution of branded performance apparel, footwear, and accessories for men, women, and youth. It operates through the following segments: North America, EMEA, Asia-Pacific, Latin America, and Connected Fitness. The North America segment comprises of U.S. and Canada. The Connected Fitness segment offers digital fitness subscriptions, along with digital advertising through its MapMyFitness, MyFitnessPal, and Endomondo. applications. The company was founded by Kevin A. Plank in 1996 and is headquartered in Baltimore, MD.
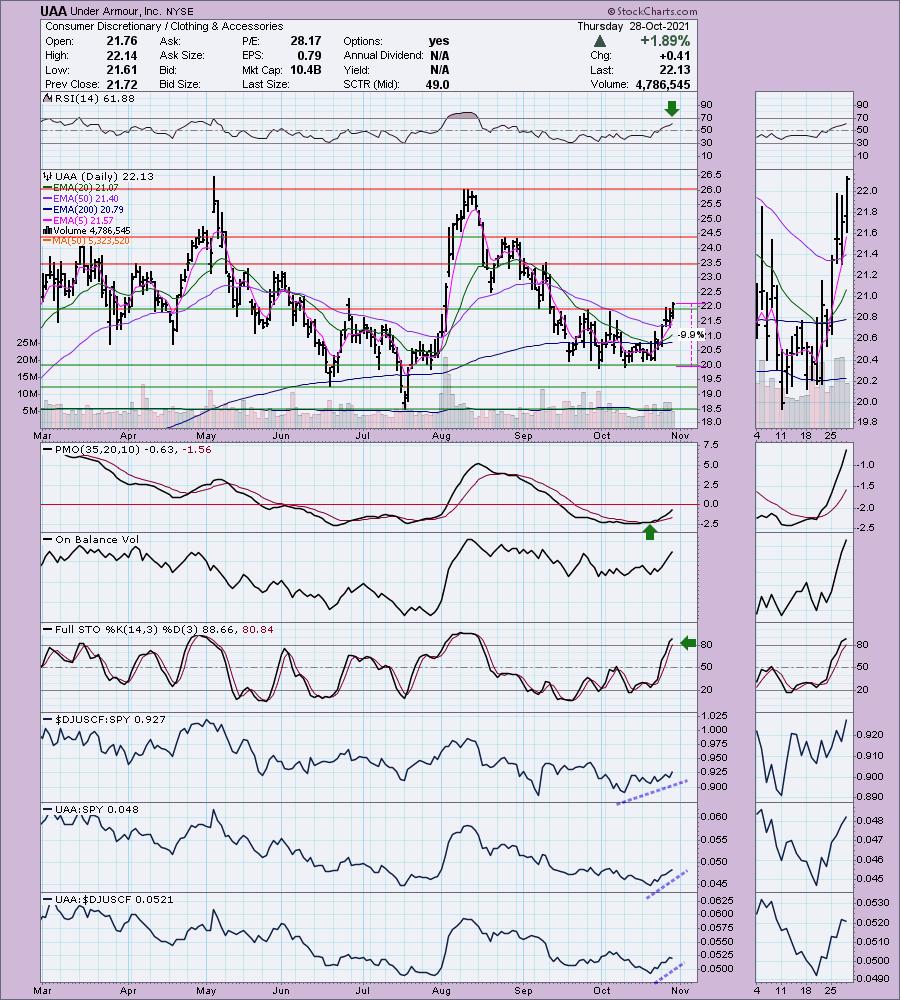
Predefined Scans Triggered: P&F High Pole, Moved Above Upper Price Channel and Ichimoku Cloud Turned Red.
UAA is down -0.20% in after hours trading. I like today breakout from the September/October trading range. The RSI is positive and the PMO is rising on an oversold crossover BUY signal. Stochastics are rising, although they are overbought. Relative performance is strong across the board. The stop is deep. You could thin it out by moving up to the 200-EMA.
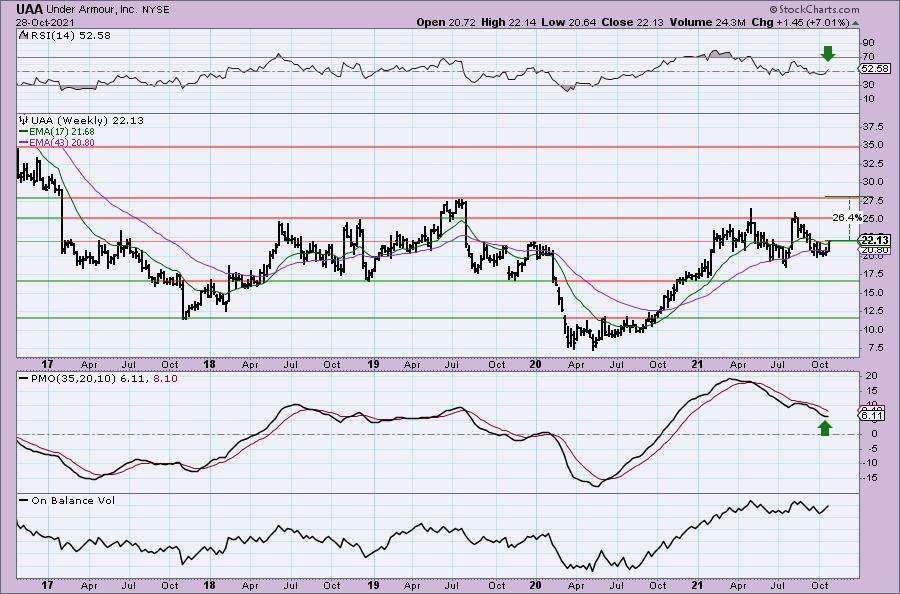
The weekly chart is very encouraging. The weekly RSI just hit positive territory and the weekly PMO is turning up. If it can reach its 2019 high that would be an over 26% gain.
Don't forget, on Thursdays I look at reader-requested symbols, click HERE to shoot me an email. I read every email I receive and try to answer them all!
Current Market Outlook:
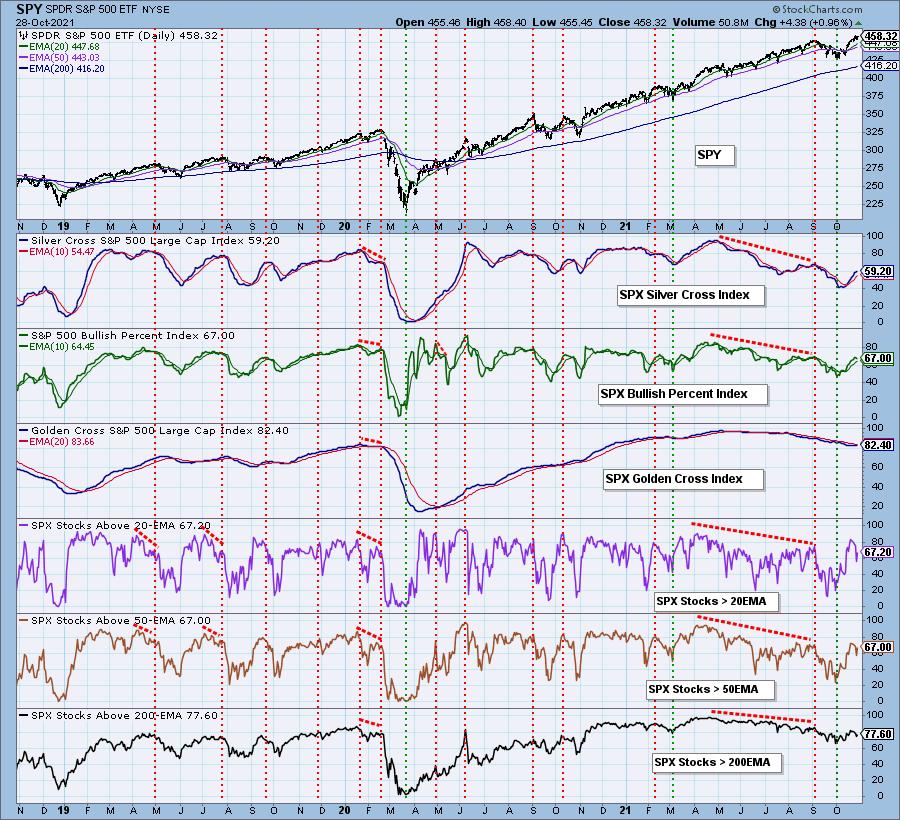
Market Environment: It is important to consider the odds for success by assessing the market tides. The following chart uses different methodologies for objectively showing the depth and trend of participation for intermediate- and long-term time frames.
- The Silver Cross Index (SCI) shows the percentage of SPX stocks on IT Trend Model BUY signals (20-EMA > 50-EMA)
- The Golden Cross Index (GCI) shows the percentage of SPX stocks on LT Trend Model BUY signals (50-EMA > 200-EMA)
- The Bullish Percent Index (BPI) shows the percentage of SPX stocks on Point & Figure BUY signals.
Don't forget that as a "Diamonds" member, you have access to our GCI/SCI curated ChartList on DecisionPoint.com. You'll find it under "Members Only" links on the left side on the Blogs and Links Page.
Here is the current chart:
Full Disclosure: I'm back to 85% invested and 15% is in 'cash', meaning in money markets and readily available to trade with.
I'm required to disclose if I currently own a stock and/or may buy it within the next 72 hours.
Technical Analysis is a windsock, not a crystal ball.
Happy Charting!
- Erin
erin@decisionpoint.com
Watch the latest episode of DecisionPoint with Carl & Erin Swenlin on Mondays 7:00p EST or on the DecisionPoint playlist on the StockCharts TV YouTube channel here!
NOTE: The stocks reported herein are from mechanical trading model scans that are based upon moving average relationships, momentum and volume. DecisionPoint analysis is then applied to get five selections from the scans. The selections given should prompt readers to do a chart review using their own analysis process. This letter is not a call for a specific action to buy, sell or short any of the stocks provided. There are NO sure things or guaranteed returns on the daily selection of "Diamonds in the Rough."
Helpful DecisionPoint Links:
DecisionPoint Shared ChartList and DecisionPoint Chart Gallery
Price Momentum Oscillator (PMO)
Swenlin Trading Oscillators (STO-B and STO-V)
For more links, go to DecisionPoint.com