
The decline continued today in earnest which left my scans bare. Rather than spend another hour trying to find buying opportunities, I decided to take a look at my "Diamond Dog" scan results. Basically it is the polar and mathematical opposite of my bullish "Diamond PMO Scan". For example, instead of looking for a stock that has had three days of new upside momentum, it looks for stocks that are showing new downside momentum for three days. The results of that scan had 36 results. The Diamond PMO Scan only returned three results, one of which was Public Storage (PSA) which I presented yesterday.
Consequently I decided to hunt for some shorting opportunities from the "Diamond Dog" scan. Confirming this, I noted that we had a "downside initiation climax" for the SPY. This means we should look for prices to move even lower. Beat down stocks will likely be beat down further.
Once I decided to look for shorts, it was easy. There are quite a few losers out there that appear ready to lose even more. Just be careful, profit potential on shorts is compressed, they can only go so low. Whereas longs mathematically have almost infinite profit potential.
It will be interesting to see how these shorts finish out the week. I don't have a "short list" today as it was just so easy to find these shorts so I didn't look further. I would say that on the buy side, Just Eat Takeaway (GRUB) looks bullish right now, but its industry group doesn't impress me.
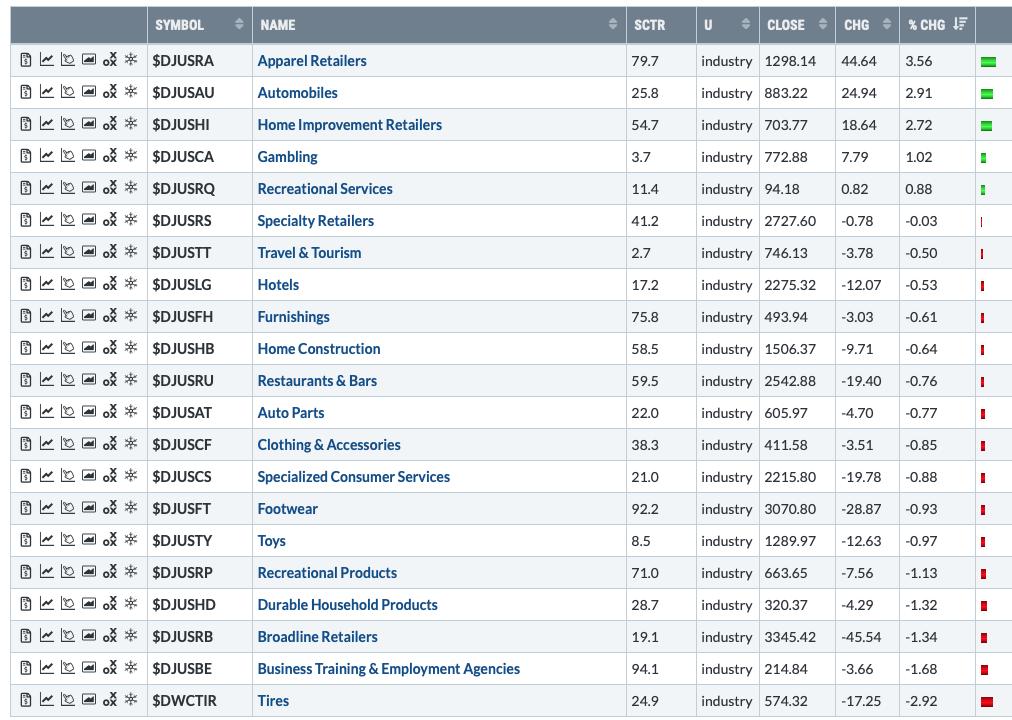
The only profitable sector today was Consumer Discretionary (XLY), but not all of that sector participated in today's rise. Notice the industry group summary below. Today's rally was primarily off the back of Apparel Retailers, Autos and Home Improvement Retailers. There wasn't broad participation in this rally for XLY. Today's rally doesn't impress me so just because we have a "growth" group moving higher, I don't see this as a spark to a big rally.
I've updated my chart style for Diamonds. I've decided to use thick OHLC bars on an 8-month daily chart. I believe the price movement is easier to decipher and I don't need as much back data.
Today's "Diamonds in the Rough" are: Shorts--MERC, TUP and VNET.

RECORDING LINK Friday (8/13):
Topic: DecisionPoint Diamond Mine (8/13/2021) LIVE Trading Room
Start Time : Aug 13, 2021 09:01 AM
Meeting Recording Link HERE.
Access Passcode: August/13
REGISTRATION FOR FRIDAY 8/20 Diamond Mine:
When: Aug 20, 2021 09:00 AM Pacific Time (US and Canada)
Topic: DecisionPoint Diamond Mine (8/20/2021) LIVE Trading Room
Register in advance for this webinar HERE.
Save the registration confirmation email with login instructions in case Zoom doesn't notify you in time.

Free DP Trading Room (8/16) RECORDING LINK:
Topic: DecisionPoint Trading Room
Start Time : Aug 16, 2021 09:01 AM
Meeting Recording Link HERE.
Access Passcode: August-16
For best results, copy and paste the access code to avoid typos.
Welcome to DecisionPoint Daily Diamonds, wherein I highlight five "Diamonds in the Rough." These are selected from the results of my DecisionPoint scans, which search for stocks that could benefit from the trend and condition of the market. Remember, these are not recommendations to buy or sell, but are the most interesting of the stocks that surfaced in my scans. My objective is to save you the work of the initial, tedious culling process, but you need to apply your own analysis to see if these stocks pique your interest as well. There are no guaranteed winners here!
Mercer Intl, Inc. (MERC)
EARNINGS: 10/28/2021 (AMC)
Mercer International, Inc. is engaged in the manufacture and sale of pulp. It operates through Pulp and Wood Products segments. The Pulp segment consists of the manufacture, sales, and distribution of NBSK pulp, electricity, and other by-products at three pulp mills. The Wood Products segment involves in manufacture, sales, and distribution of lumber, electricity and other wood residuals at the Friesau Facility. The company was founded on July 1, 1968 and is headquartered in Vancouver, Canada.
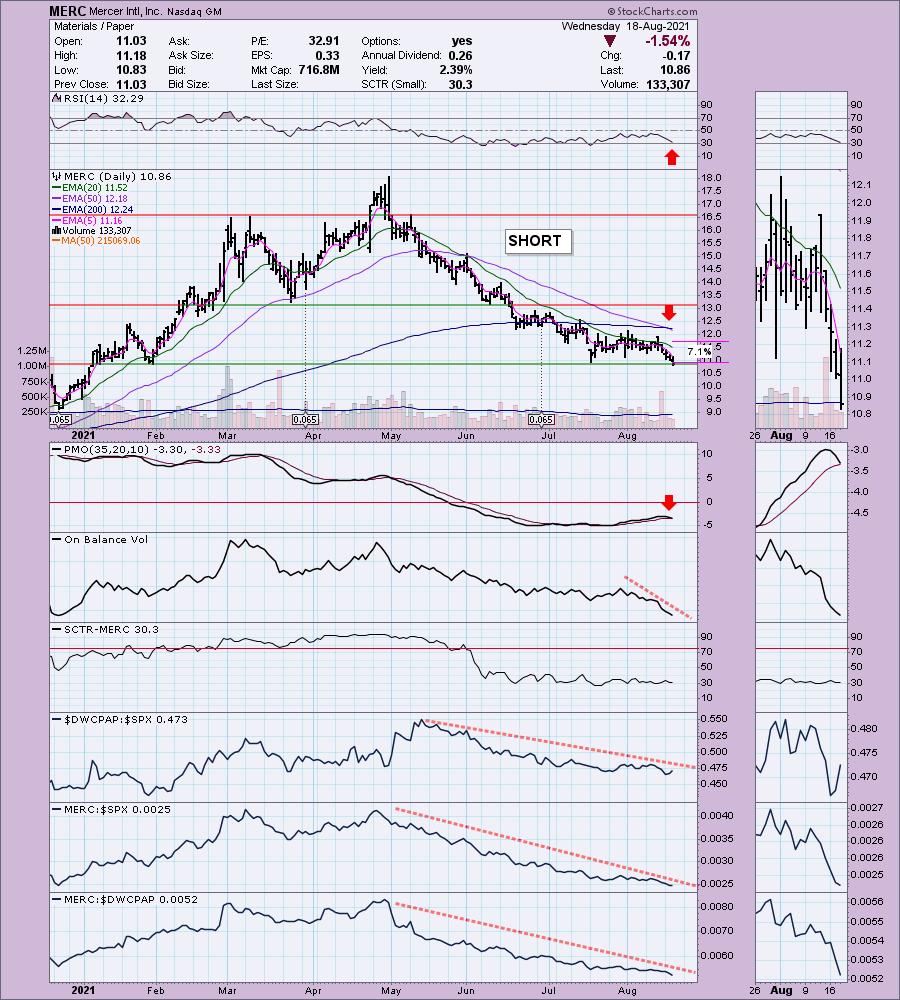
MERC is unchanged in after hours trading. Today price broke down and closed beneath support. A new LT Trend Model SELL signal was triggered on the "death cross" of the 50/200-EMAs. The RSI is negative and still falling. Even if the RSI gets oversold, you can see based on history that rally are short-lived. The PMO has topped well-below the zero line and should trigger a crossover SELL signal soon. The OBV is confirming the decline. Relative performance stinks which is exactly what we want when looking for shorting opportunities. The stop to the upside is set above the 20-EMA. Note that it generally fails at the 20-EMA to we want to account for that by setting the stop higher.
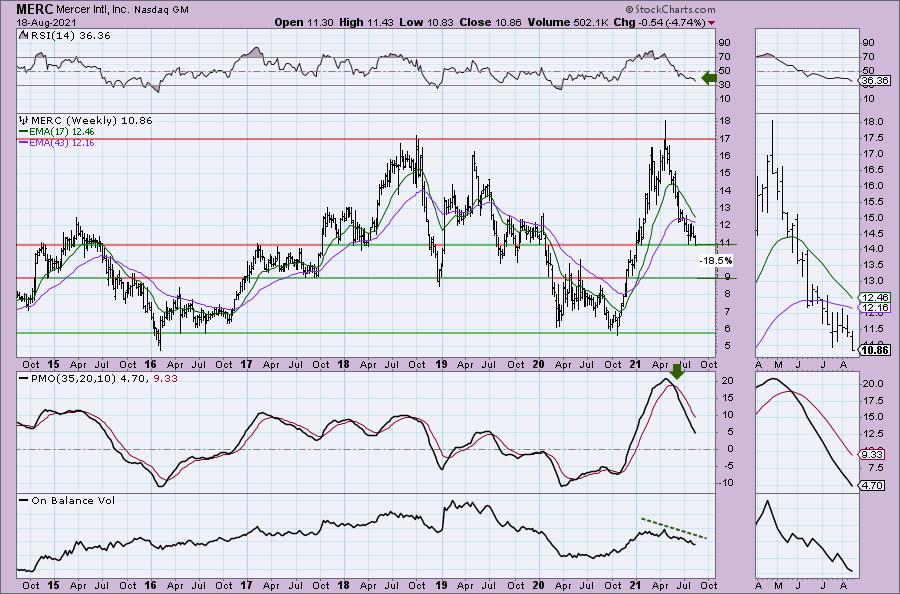
The weekly chart is ugly with a negative and not oversold RSI and a PMO pointed downward. The weekly PMO is not at all oversold. The OBV is confirming the declining trend out of the April top. I think it will drop another 18% before its all over.
Tupperware Brands Corp. (TUP)
EARNINGS: 11/3/2021 (BMO)
Tupperware Brands Corp. operates as a direct-to-consumer marketer of products across multiple brands and categories. It operates through the following geographical segments: Europe, Asia Pacific, North America and South America. product brands and categories include design-centric preparation, storage and serving solutions for the kitchen and home through the Tupperware brand, and beauty and personal care products through the Avroy Shlain, BeautiControl, Fuller, NaturCare, Nutrimetics and Nuvo brands. The company was founded on February 8, 1996 and is headquartered in Orlando, FL.
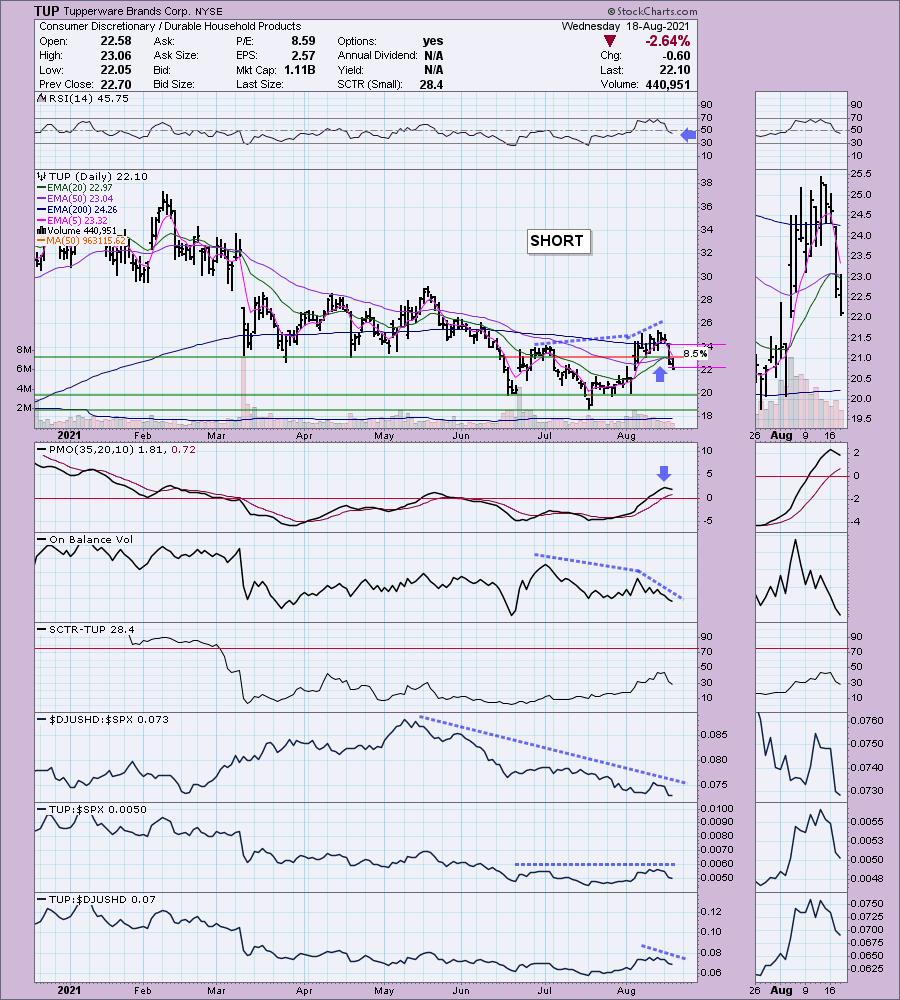
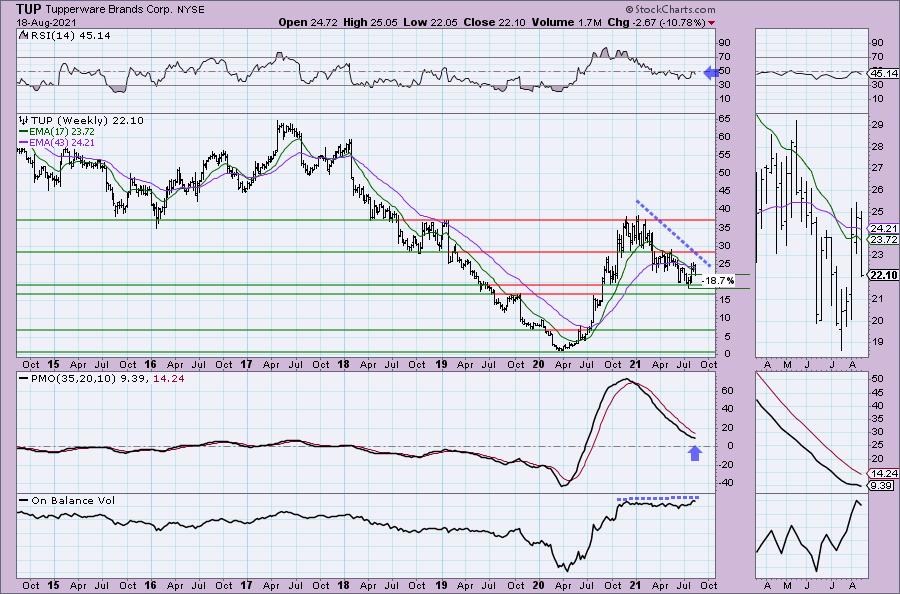
TUP is already down -0.50% in after hours trading. The RSI only recently hit negative territory and it is still moving lower. The PMO has topped. Notice the negative divergences on the OBV. That is excellent if we are looking for a stock to move lower. The group itself hasn't had a great 4 months. TUP underperforms its group anyway and is beginning to lose strength against the SPX. The stop is set at the 200-EMA to the upside. We have seen price fail after breaking above that level, but if a short starts to go the wrong way it's best to let it go. Notice the 20-EMA failed to cross above the 50-EMA so the Neutral signal generated on the negative crossover back in March is still in force.
The weekly chart supports taking a short position. The weekly RSI is negative and just recently failed to get above net neutral (50). The PMO had slowed on the rally a few weeks ago, but it is back to moving down. There is a reverse divergence with the OBV. Despite volume rising based on higher highs for the OBV, price lost a lot of ground. Price should follow volume and when it doesn't that suggests internal weakness. Profit potential is over 18% if it just test the July low, but this one looks like it will move lower still.
21Vianet Group Inc. (VNET)
EARNINGS: 8/24/2021 (AMC) ** Reports Earnings Next Week **
21Vianet Group, Inc. is a holding company, which engages in the provision of carrier-neutral internet data center services. Its services include interconnectivity, colocation or data center managed hosting services, and cloud services. The company was founded by Sheng Chen and Jun Zhang on October 16, 1999 and is headquartered in Beijing, China.
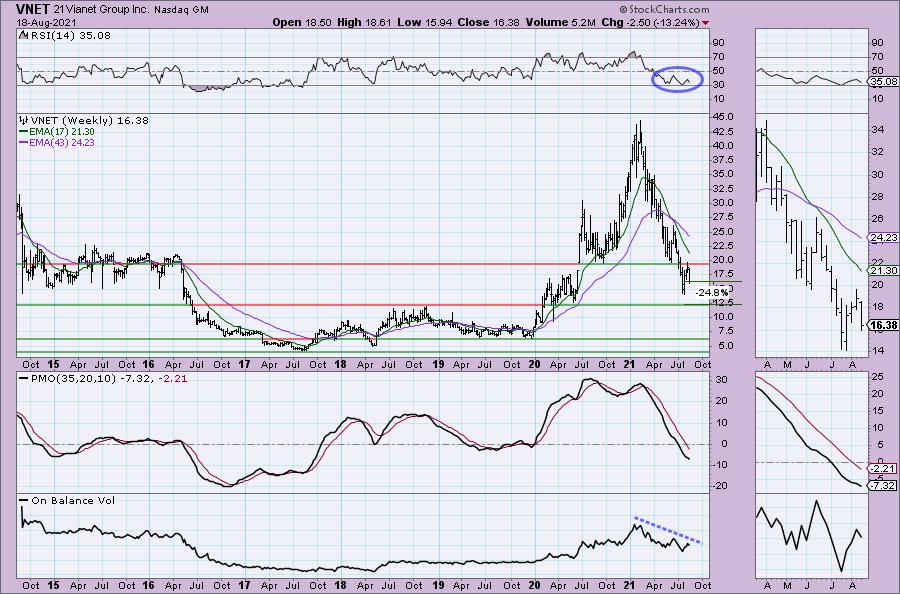
VNET is unchanged in after hours trading. It does report next week so that is a crap shoot. Notice that this stock is headquartered in China. We know the recent meddling by the Chinese government has hit many China centric stocks. The latest news was that President Xi will be asking the wealthy to give back. This could mean continued regulation on "private" companies within China which will mean lower stock prices will likely continue. VNET saw heavy selling over the past few days. The RSI is very negative and not oversold yet. Notice price failed to overcome resistance at the 50-EMA and the PMO has topped well below the zero line. I would consider the stop level to be above the 20-EMA. I'd like to bring it to the 50-EMA but that would mean a large loss on a short position. Relative strength shows a sickly group and a stock that is underperforming both the SPX and this sickly industry group.
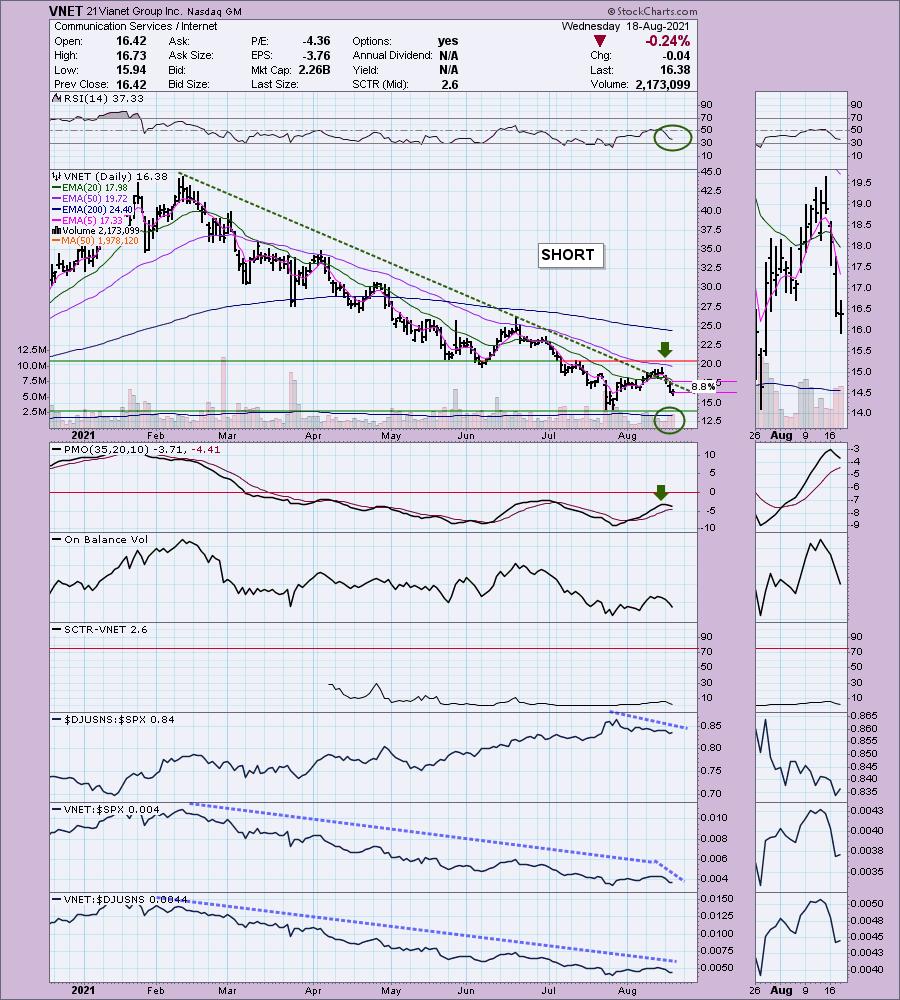
VNET fell below support at $20. The next strong area of support is around $12.50. If it travels there, that will be a 24% profit on this short.
Don't forget, on Thursdays I look at reader-requested symbols, so shoot me an email at erin@decisionpoint.com. I read every email I receive and try to answer them all!
Current Market Outlook:
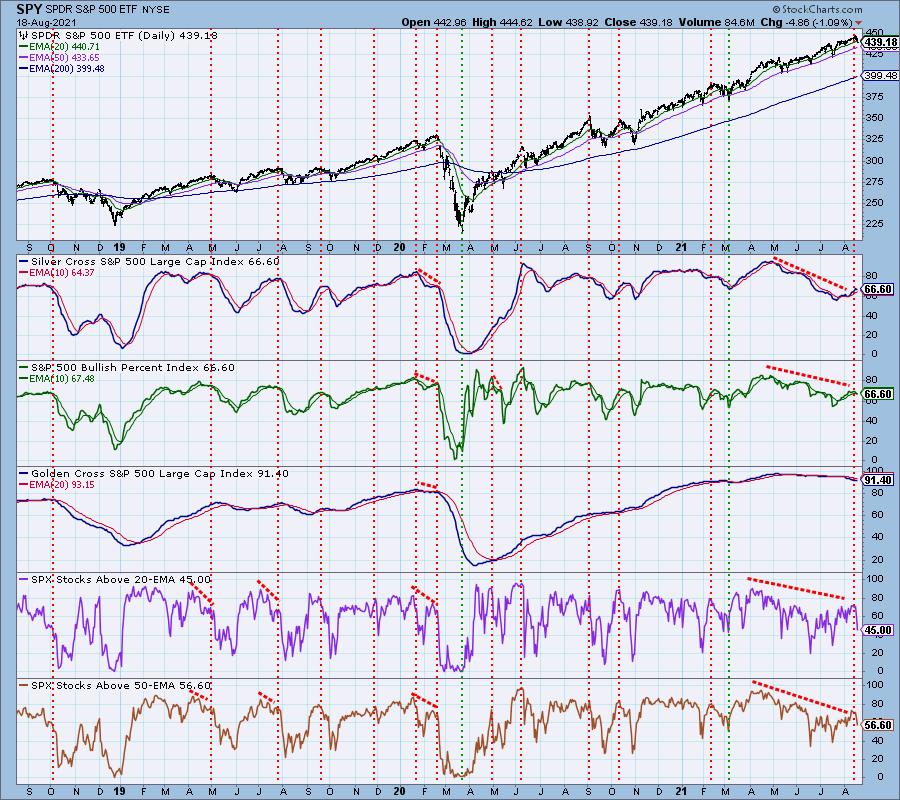
Market Environment: It is important to consider the odds for success by assessing the market tides. The following chart uses different methodologies for objectively showing the depth and trend of participation for intermediate- and long-term time frames.
- The Silver Cross Index (SCI) shows the percentage of SPX stocks on IT Trend Model BUY signals (20-EMA > 50-EMA)
- The Golden Cross Index (GCI) shows the percentage of SPX stocks on LT Trend Model BUY signals (50-EMA > 200-EMA)
- The Bullish Percent Index (BPI) shows the percentage of SPX stocks on Point & Figure BUY signals.
Don't forget that as a "Diamonds" member, you have access to our GCI/SCI curated ChartList on DecisionPoint.com. You'll find it under "Members Only" links on the left side on the Blogs and Links Page.
Here is the current chart:
Full Disclosure: I'm about 45% invested and 55% is in 'cash', meaning in money markets and readily available to trade with.
Technical Analysis is a windsock, not a crystal ball.
Happy Charting!
- Erin
erin@decisionpoint.com
Watch the latest episode of DecisionPoint with Carl & Erin Swenlin on Mondays 7:00p EST or on the DecisionPoint playlist on the StockCharts TV YouTube channel here!
NOTE: The stocks reported herein are from mechanical trading model scans that are based upon moving average relationships, momentum and volume. DecisionPoint analysis is then applied to get five selections from the scans. The selections given should prompt readers to do a chart review using their own analysis process. This letter is not a call for a specific action to buy, sell or short any of the stocks provided. There are NO sure things or guaranteed returns on the daily selection of "Diamonds in the Rough."
Helpful DecisionPoint Links:
DecisionPoint Shared ChartList and DecisionPoint Chart Gallery
Price Momentum Oscillator (PMO)
Swenlin Trading Oscillators (STO-B and STO-V)
For more links, go to DecisionPoint.com