
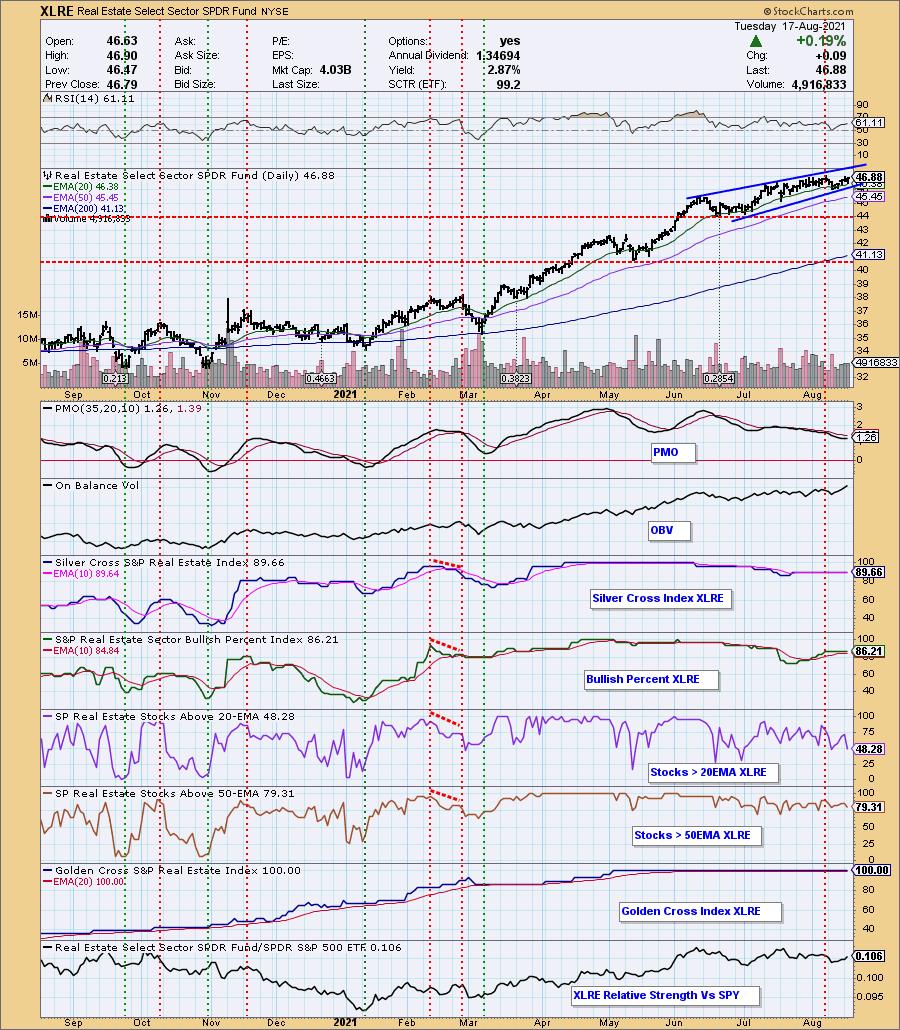
It was a rocky trading day, but not entirely unexpected. What we did find out was where leadership is and where it isn't. One area of the market that is being overlooked somewhat is Real Estate (XLRE). These stocks were outperforming in a big way, but many of them took a break. It appears strength is coming in as the PMO is beginning to turn back up.
Looking at the sector chart we can see that the PMO is now curling up. Additionally, in the last window you can see that XLRE is beginning to outperform the market. Participation could look better, but current readings are near-term oversold. We will need to watch that bearish rising wedge, but the RSI is positive and not overbought and we can see plenty of volume coming in right now.
Food Product stocks are still looking good. You'll see some in the stocks to review. Kudos to the Diamond subscribers who brought CHD, K, GIS and SJM to the table. CHD and SJM came up in my scans, but I also liked Kellogg (K), particularly on the weekly chart.
I've updated my chart style for Diamonds. I've decided to use thick OHLC bars on an 8-month daily chart. I believe the price movement is easier to decipher and I don't need as much back data.
Today's "Diamonds in the Rough" are: CCI, O and PSA.
Stocks to Review ** (no order): ACRE, CHD, SJM, GIS, K and NSRGY.
** The "Stocks to Review" are stocks that were on my short list for the day.

RECORDING LINK Friday (8/13):
Topic: DecisionPoint Diamond Mine (8/13/2021) LIVE Trading Room
Start Time : Aug 13, 2021 09:01 AM
Meeting Recording Link HERE.
Access Passcode: August/13
REGISTRATION FOR FRIDAY 8/13 Diamond Mine:
When: Aug 20, 2021 09:00 AM Pacific Time (US and Canada)
Topic: DecisionPoint Diamond Mine (8/20/2021) LIVE Trading Room
Register in advance for this webinar HERE.
Save the registration confirmation email with login instructions in case Zoom doesn't notify you in time.

Free DP Trading Room (8/9) RECORDING LINK:
Topic: DecisionPoint Trading Room
Start Time : Aug 16, 2021 09:01 AM
Meeting Recording Link HERE.
Access Passcode: August-16
For best results, copy and paste the access code to avoid typos.
Welcome to DecisionPoint Daily Diamonds, wherein I highlight five "Diamonds in the Rough." These are selected from the results of my DecisionPoint scans, which search for stocks that could benefit from the trend and condition of the market. Remember, these are not recommendations to buy or sell, but are the most interesting of the stocks that surfaced in my scans. My objective is to save you the work of the initial, tedious culling process, but you need to apply your own analysis to see if these stocks pique your interest as well. There are no guaranteed winners here!
Crown Castle Intl Corp. (CCI)
EARNINGS: 10/20/2021 (AMC)
Crown Castle International Corp. is a real estate investment trust company, which engages in the provision of access to wireless infrastructure via long-term contacts. It operates through the following segments: Towers and Fiber. The Towers segment offers access, including space or capacity towers dispersed throughout the United States. The Fiber segment covers access, including space or capacity of fiber primarily supporting small cell networks and fiber solutions. The company was founded by Ted B. Miller Jr. and Edward C. Hutcheson Jr. in 1994 and is headquartered in Houston, TX.
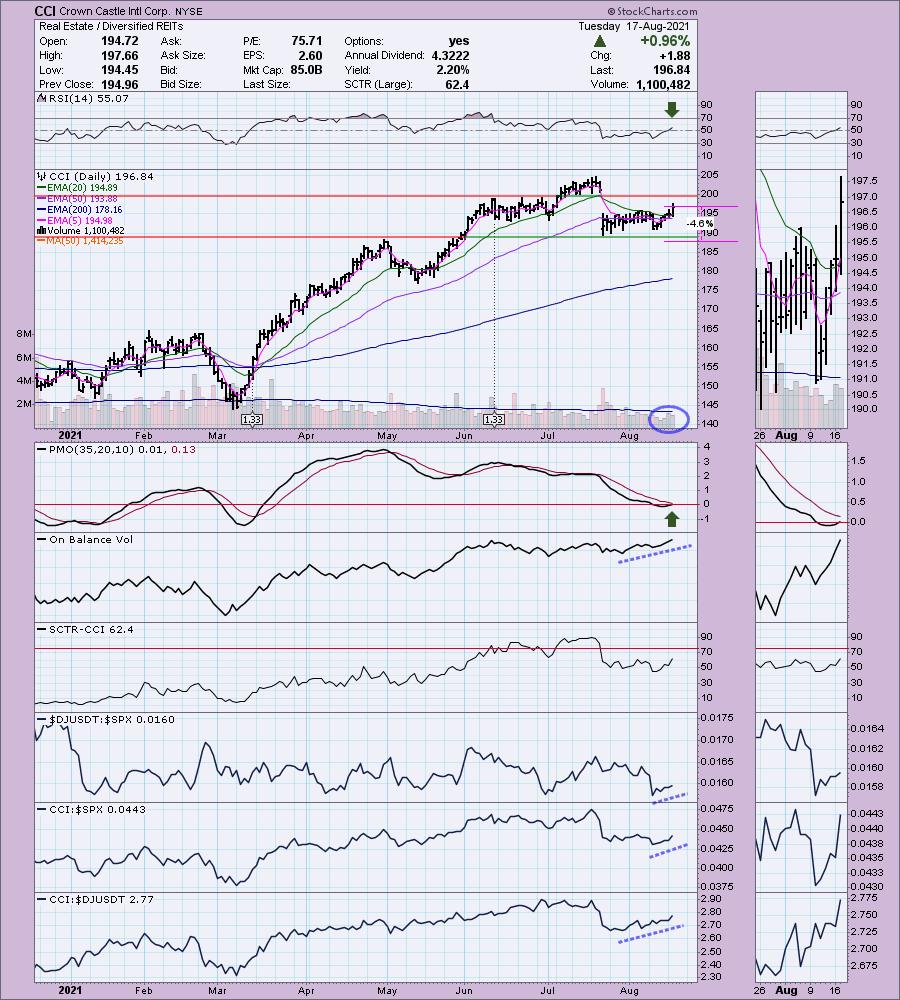
CCI is down -0.46% in after hours trading. I've covered CCI a number of times. First on April 9th 2020 (it just barely hit its 8.3% stop in May 2020), second on December 29th 2020 (the stop was nearly hit, but since it wasn't, it is up +26.3%) and most recently on July 8th 2021 (the stop hasn't been hit, but the position is down -1.94%).
I like today's breakout, particularly on a day where most stocks were lower. Volume started to coming in before the breakout. Right now its job is to cover the gap from July. I think it will. We have a new ST Trend Model BUY signal on the 5/20-EMA positive crossover. The PMO is rising from oversold territory just below the zero line. The RSI has moved into positive territory. The OBV is rising strongly. Relative strength shows us that this group is beginning to outperform and CCI is generally a winner within the group. The stop can be set tightly at only 4.6%
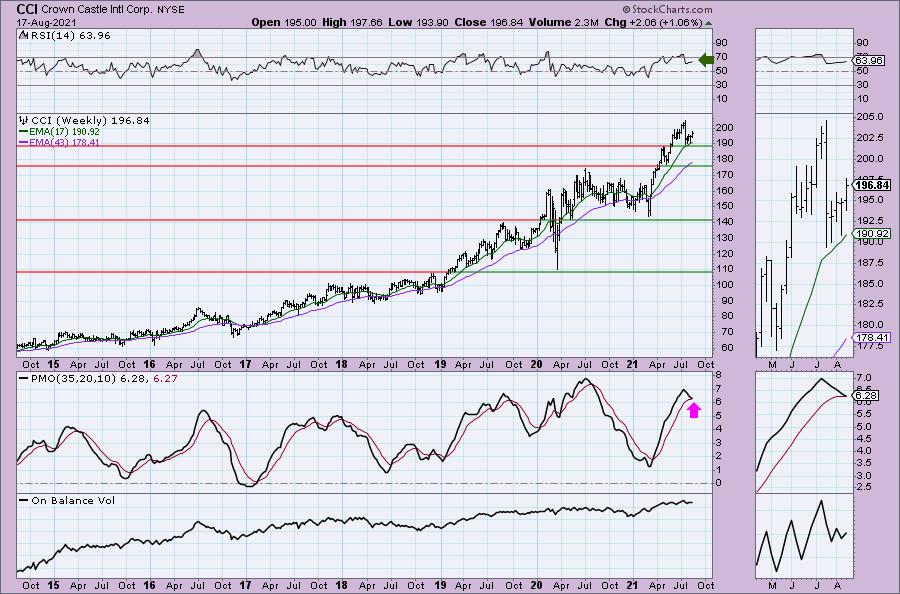
The weekly chart isn't great given the PMO nearing a crossover SELL signal, but the RSI is positive and we have rising bottoms on the OBV. I would set an upside target of 12% which would put price at $220.46.
Realty Income Corp. (O)
EARNINGS: 11/1/2021 (AMC)
Realty Income Corp. is a real estate company, which engages in generating dependable monthly cash dividends from a consistent and predictable level of cash flow from operations. The company was founded by William E. Clark, Jr. and Evelyn Joan Clark in 1969 and is headquartered in San Diego, CA.
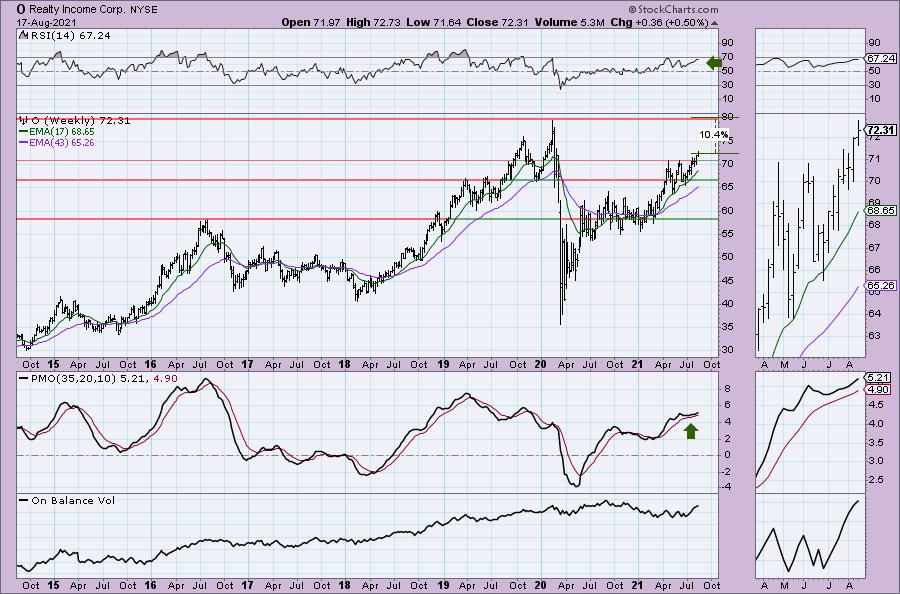
O is up +0.07% in after hours trading. I like the breakout last week and today's pullback toward that breakout point. This put the RSI in positive, not overbought territory. The PMO bottomed above the signal line which is especially bullish. The OBV is confirming the rising trend. Relative strength for the group is okay, it's not underperforming, but it isn't really outperforming either. In any case, O is outperforming. Bonus: It is a stock that pays a regular dividend. The stop is set tightly below the 50-EMA and support at the April/May highs.
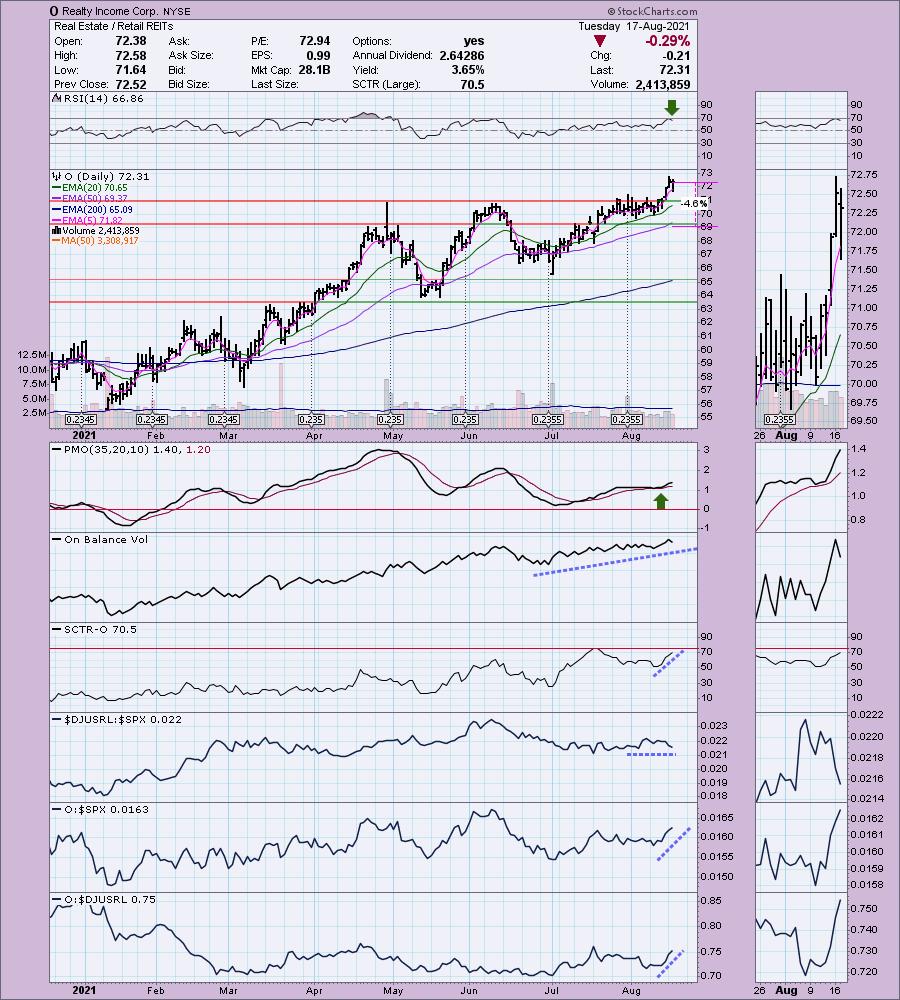
The weekly chart looks great with another PMO bottom above the signal line. The PMO nor the RSI are overbought. Volume is coming in based on the OBV. It's a tight stop so you can set a small upside target at overhead resistance, but I suspect it will overcome that resistance level and move higher.
Public Storage, Inc. (PSA)
EARNINGS: 11/3/2021 (AMC)
Public Storage operates as a real estate investment trust. The firm engages in acquiring, developing, owning and operating self-storage facilities. It operates through the following segments: Self-storage Operations, Ancillary Operations, Investment in PS Business Parks and Investment in Shurgard. The Self-storage Operations segment reflects the rental operations from all self-storage facilities. The Ancillary Operations segment deals with the sale of merchandise and reinsurance of policies against losses to goods stored by self-storage tenants, activities which are incidental to the primary self-storage rental activities. The Investment in PS Business Parks segment includes commercial properties, primarily multi-tenant flex, office, and industrial parks. The Investment in Shurgard segment owns self-storage facilities located in seven countries in Western Europe operated under the Shurgard brand name. The company was founded by Bradley Wayne Hughes, Sr. and Kenneth Q. Volk, Jr. in 1972 and is headquartered in Glendale, CA.
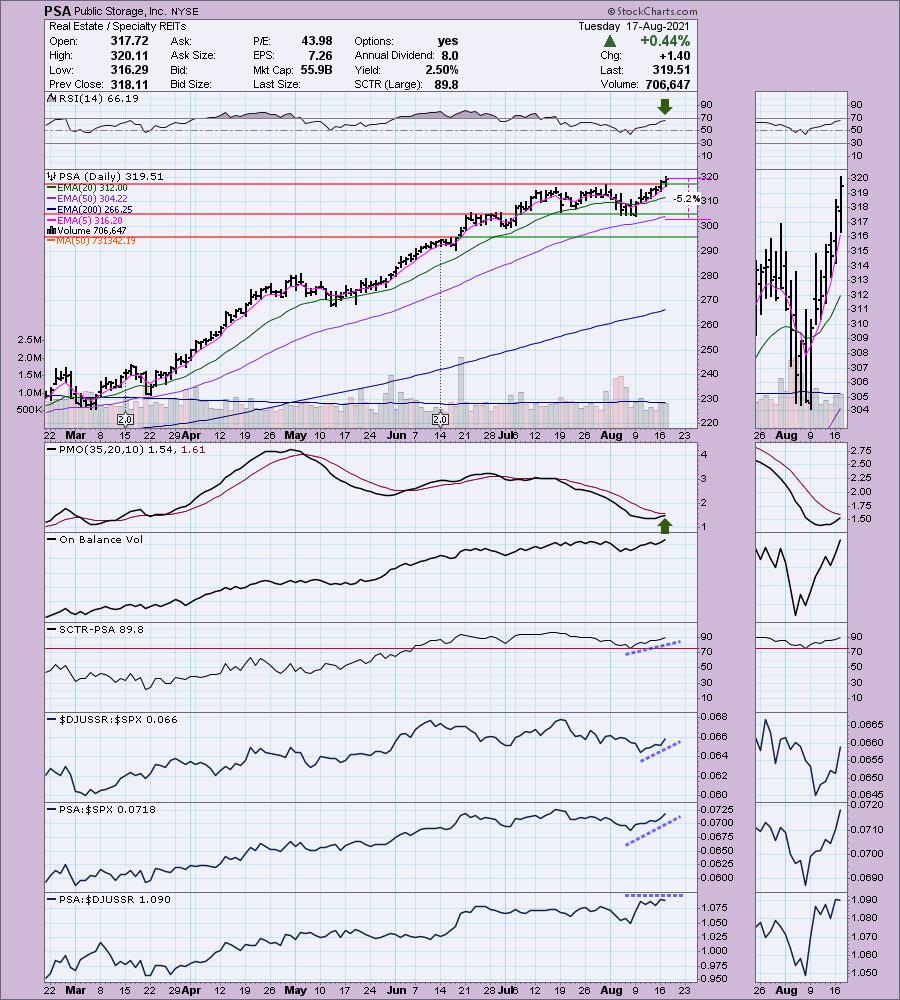
PSA is up +0.08% in after hours trading. I've covered PSA twice before. December 15th 2020 (It's up 41.9%) and on January 27th 2021 (position is up 40.1%).
It broke out yesterday and continued higher today. The last month has provided PSA an opportunity to digest the rally out of the May low. It has also relieved overbought conditions on the RSI. The PMO is nearing a positive crossover BUY signal in oversold territory. The OBV is confirming the rally. The SCTR is improving within the "hot zone" above 75. Finally the group is started outperforming this month with PSA outperforming the SPX and keeping up with its industry group. The stop can be set tightly at 5.2%. Notice this one also pays a nice dividend.
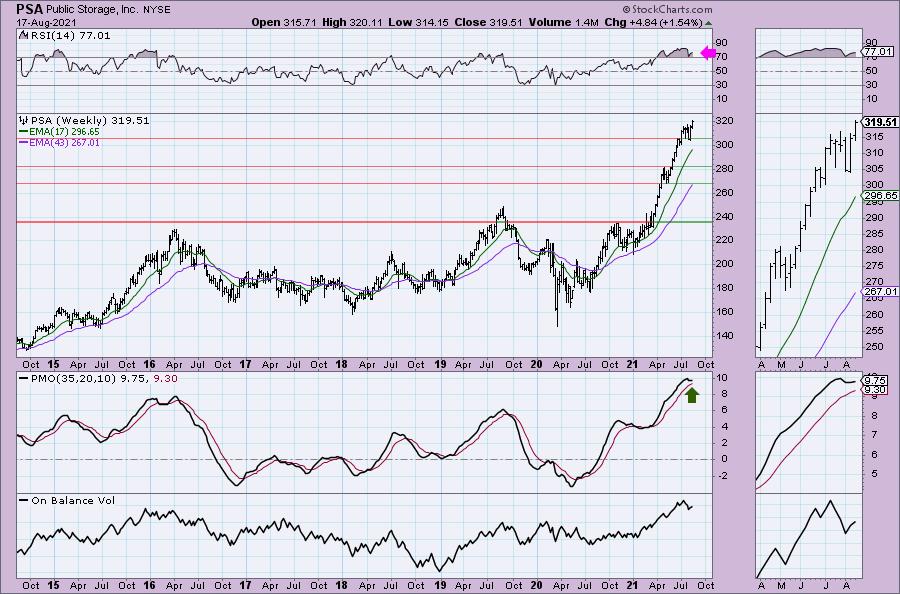
Admittedly the RSI and PMO are overbought on the weekly chart. However, the PMO is bottoming above the signal line. I believe we'll see some legs on this breakout, but I would set a conservative upside target of 14% at around $357.85.
Don't forget, on Thursdays I look at reader-requested symbols, so shoot me an email at erin@decisionpoint.com. I read every email I receive and try to answer them all!
Current Market Outlook:
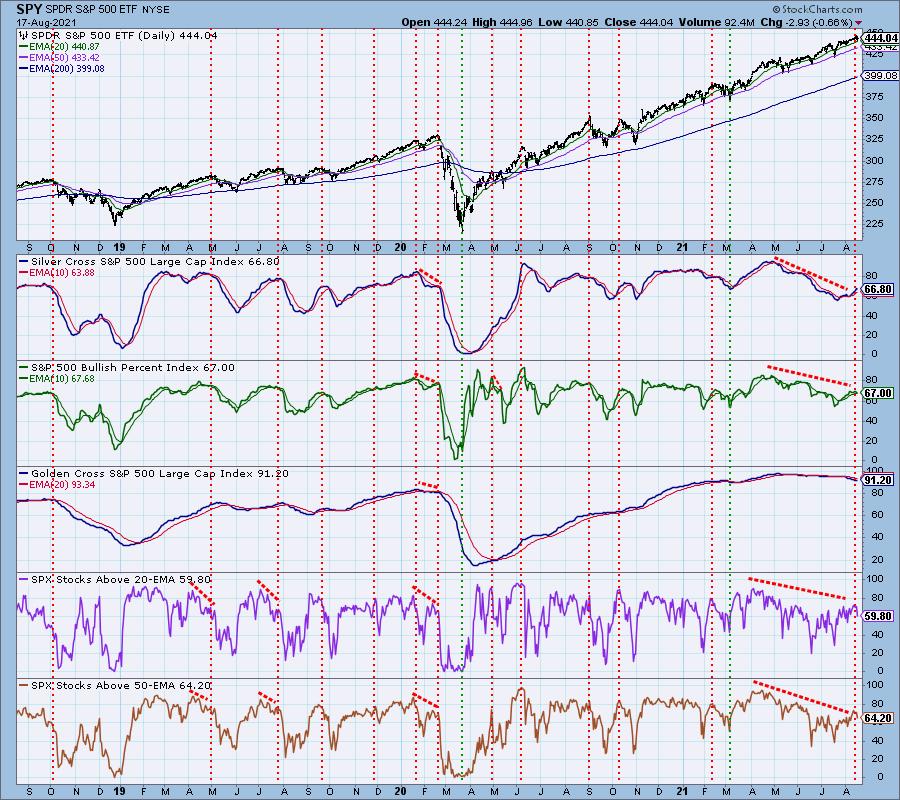
Market Environment: It is important to consider the odds for success by assessing the market tides. The following chart uses different methodologies for objectively showing the depth and trend of participation for intermediate- and long-term time frames.
- The Silver Cross Index (SCI) shows the percentage of SPX stocks on IT Trend Model BUY signals (20-EMA > 50-EMA)
- The Golden Cross Index (GCI) shows the percentage of SPX stocks on LT Trend Model BUY signals (50-EMA > 200-EMA)
- The Bullish Percent Index (BPI) shows the percentage of SPX stocks on Point & Figure BUY signals.
Don't forget that as a "Diamonds" member, you have access to our GCI/SCI curated ChartList on DecisionPoint.com. You'll find it under "Members Only" links on the left side on the Blogs and Links Page.
Here is the current chart:
Full Disclosure: I'm about 50% invested and 50% is in 'cash', meaning in money markets and readily available to trade with.
Technical Analysis is a windsock, not a crystal ball.
Happy Charting!
- Erin
erin@decisionpoint.com
Watch the latest episode of DecisionPoint with Carl & Erin Swenlin on Mondays 7:00p EST or on the DecisionPoint playlist on the StockCharts TV YouTube channel here!
NOTE: The stocks reported herein are from mechanical trading model scans that are based upon moving average relationships, momentum and volume. DecisionPoint analysis is then applied to get five selections from the scans. The selections given should prompt readers to do a chart review using their own analysis process. This letter is not a call for a specific action to buy, sell or short any of the stocks provided. There are NO sure things or guaranteed returns on the daily selection of "Diamonds in the Rough."
Helpful DecisionPoint Links:
DecisionPoint Shared ChartList and DecisionPoint Chart Gallery
Price Momentum Oscillator (PMO)
Swenlin Trading Oscillators (STO-B and STO-V)
For more links, go to DecisionPoint.com