
Money poured into Home Builders, Metals & Mining and Gold Miners. I'm suspect of Gold Miners right now. Gold recovered somewhat today and that is likely the reason we saw Gold Miners do well. It's certainly a group to watch given it has been beaten down, but I would tread carefully.
Yesterday's "Diamonds in the Rough" were slammed as money quickly rotated out of Renewable Energy and Biotechs today. They aren't likely down for the count and if you did enter one today, a better entry point was had than yesterday's closes. However, this mass exodus tells me that if you are ahead on a position in these groups, it might be a good idea to keep a very short leash on it.
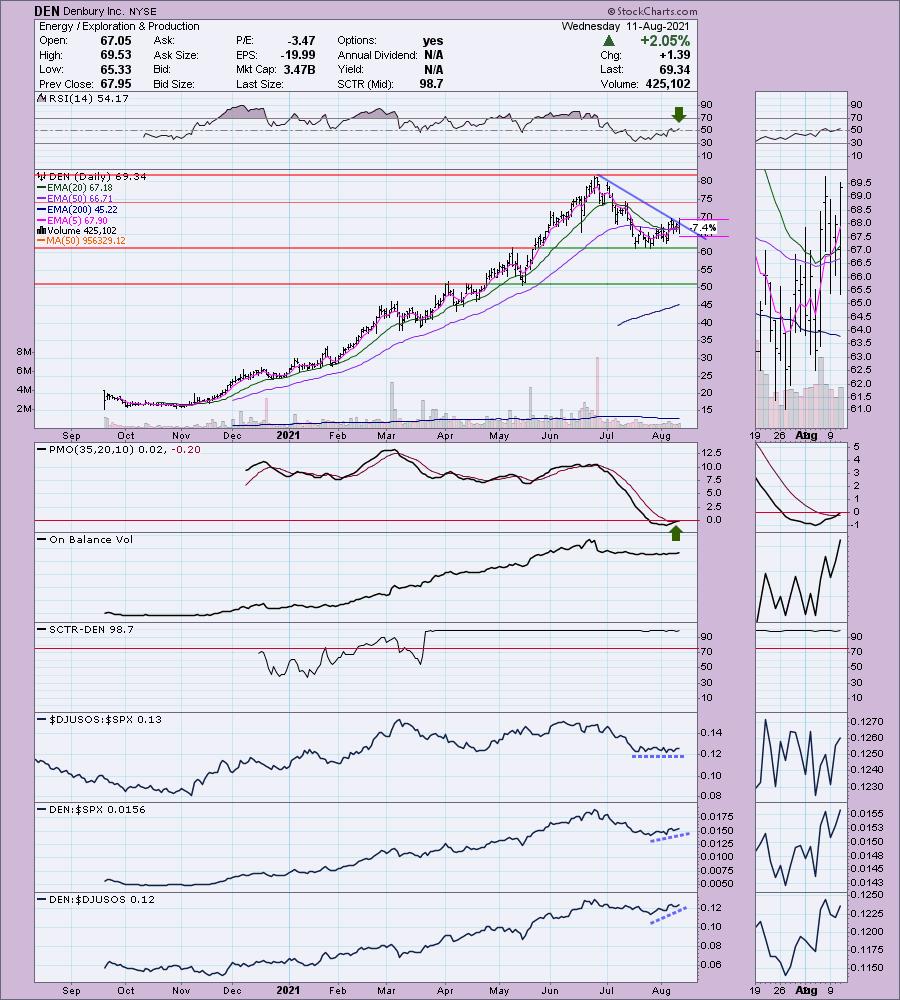
I talked yesterday about seeing Energy stocks in most of my scans. I found an Exploration & Production chart that looks interesting, Denbury Inc (DEN). I would just note that the industry group is not outperforming the market, it is keeping pace.
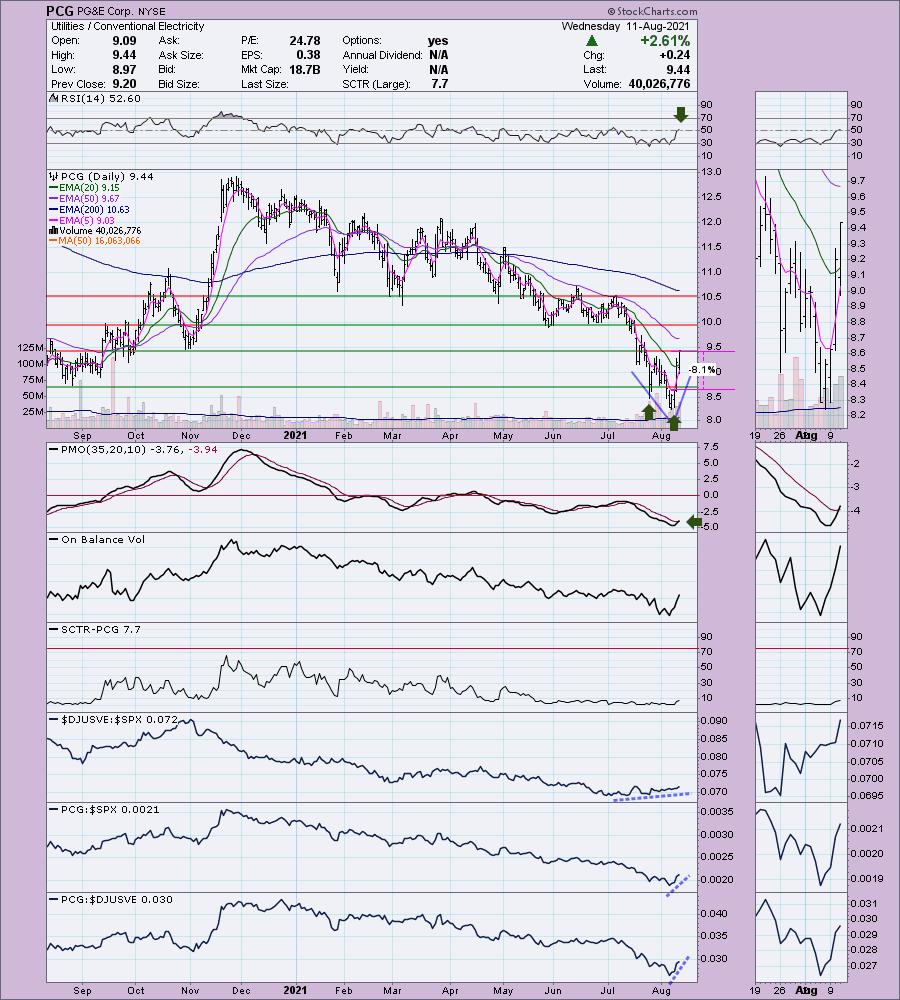
I have a beat down Utility to consider so upside potential is killer. It's low priced and therefore a bit risky so be sure to set a stop on PG&E (PCG).
One of my past winners was a "ChartWatchers" Diamond of the Week. You can read the article here about Harley Davidson (HOG). I really like the chart again!
Today's "Diamonds in the Rough" are: DEN, HOG, MAC and PCG.
Stocks to Review ** (no order): AEE, CE, NOG, ESXB, DEN, OXM, PDCE, TITN, SKT and EQH.
** The "Stocks to Review" are stocks that were on my short list for the day.

RECORDING LINK FOR Wednesday 8/4 Bonus Diamond Mine:
Topic: DecisionPoint Make-Up Diamond Mine (8/4/2021) LIVE Trading Room
Start Time : Aug 4, 2021 09:00 AM
Meeting Recording Link HERE.
Access Passcode: August/4
RECORDING LINK Friday (8/6):
Topic: DecisionPoint Diamond Mine (8/6/2021) LIVE Trading Room
Start Time : Aug 6, 2021 08:59 AM
Meeting Recording Link HERE.
Access Passcode: August/6
REGISTRATION FOR FRIDAY 8/13 Diamond Mine:
When: Aug 13, 2021 09:00 AM Pacific Time (US and Canada)
Topic: DecisionPoint Diamond Mine (8/13/2021) LIVE Trading Room
Register in advance for this webinar HERE.
Save the registration confirmation email with login instructions in case Zoom doesn't notify you in time.

Free DP Trading Room (8/9) RECORDING LINK:
Topic: DecisionPoint Trading Room
Start Time : Aug 9, 2021 09:00 AM
Meeting Recording Link HERE.
Access Passcode: August-9th
For best results, copy and paste the access code to avoid typos.
Welcome to DecisionPoint Daily Diamonds, wherein I highlight five "Diamonds in the Rough." These are selected from the results of my DecisionPoint scans, which search for stocks that could benefit from the trend and condition of the market. Remember, these are not recommendations to buy or sell, but are the most interesting of the stocks that surfaced in my scans. My objective is to save you the work of the initial, tedious culling process, but you need to apply your own analysis to see if these stocks pique your interest as well. There are no guaranteed winners here!
Denbury Inc. (DEN)
EARNINGS: 11/4/2021 (BMO)
Denbury Inc. is an independent energy company, which engages in the operation and production of oil and natural gas reserves. The firm holds interests in the Gulf Coast and Rocky Mountain regions. It aims to develop significant stranded reserves of American oil from depleted reservoirs through carbon dioxide enhanced oil recovery (CO2 EOR). The company was founded by Gareth G. Roberts in 1951 and is headquartered in Plano, TX.
DEN is unchanged in after hours trading. As noted in the intro, if Crude Oil is going to rebound, this industry group could begin to outperform. Given I've seen stocks from this group hit my scan results for a few days, I felt it was time to make a pick. DEN just broke a declining trend. Price is above all of the key moving averages. There is a ST Trend Model BUY signal that just came through when the 5-EMA crossed above the 20-EMA. The RSI has just reached positive territory and the PMO had a crossover BUY signal today. You can see a very large bull flag that has formed since DEN began trading. The stop is set just below the mid-June intraday low.
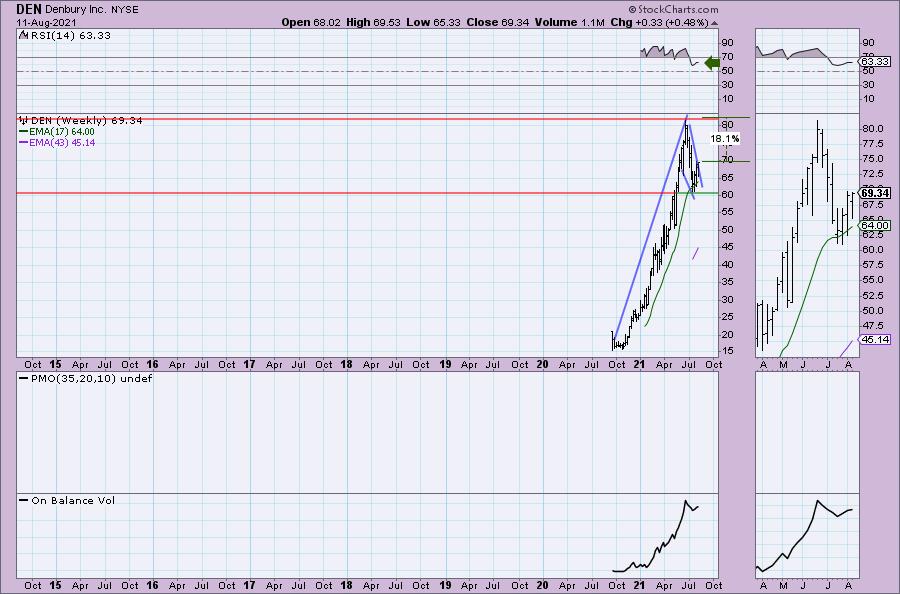
The bull flag is prominent on the weekly chart. The weekly RSI is positive. It's too new to have a weekly PMO, but we do see that price found support along the 17-week EMA.
Harley Davidson Inc (HOG)
EARNINGS: 10/26/2021 (BMO)
Harley-Davidson, Inc. is engaged in the manufacture and sale of custom, cruiser and touring motorcycles. It operates through the following segments: Motorcycles & Related Products; and Financial Services. The Motorcycles & Related Products segment manufactures, designs, and sells at wholesale on-road Harley-Davidson motorcycles as well as motorcycle parts, accessories, general merchandise, and related services. The Financial Services segment comprises of financing and servicing wholesale inventory receivables and retail consumer loans, primarily for the purchase of Harley-Davidson motorcycles. The company was founded by William Sylvester Harley, Arthur Davidson, Walter C. Davidson, Sr. and William A. Davidson in 1903 and is headquartered in Milwaukee, WI.
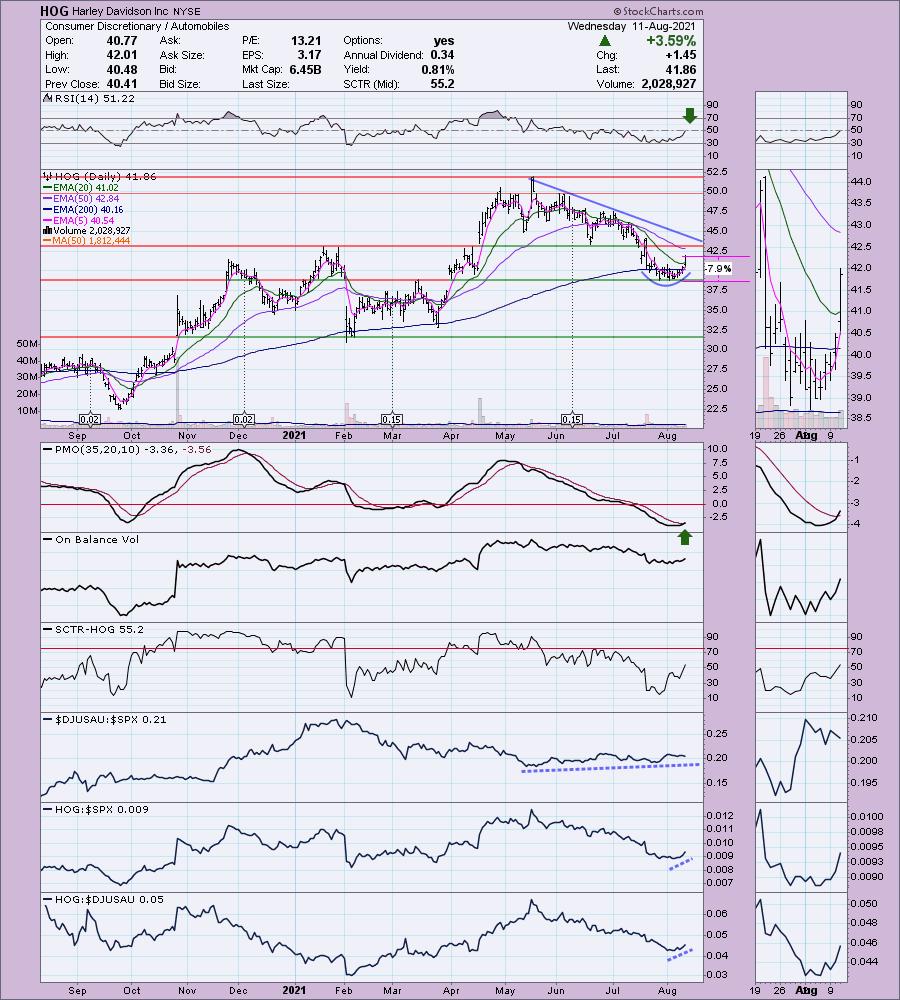
HOG is up +0.07% in after hours trading which is pretty good considering it was up nearly 3.6% today. When I covered HOG in ChartWatchers, it was priced at $25.81. The stop was never hit so the position is currently up +62.2%. If you sold near the top in May you would have definitely brought home a lot of "bacon". This chart is very nice. We have a cup shaped bottom and today a breakout above the 20-EMA. Granted overhead resistance is nearing at the 50-EMA and the June low, but given the newly positive RSI and new PMO crossover BUY signal in oversold territory, it looks ready to motor higher. The Autos industry group is performing about as well as the SPX, but HOG is outperforming them both near-term. The stop is just below support at the recent lows.
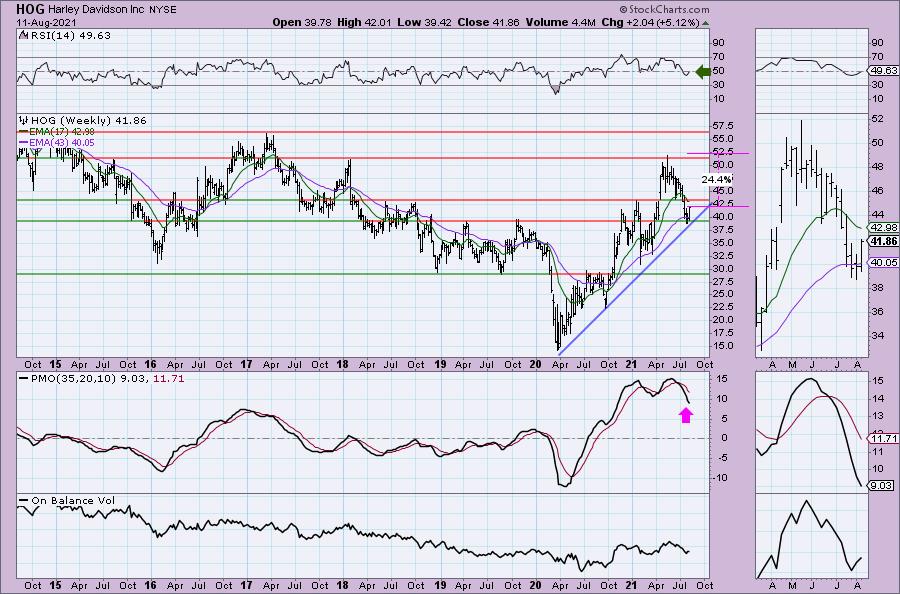
The weekly PMO could use some work, but the weekly RSI is just about to move into positive territory. Also note that price is bouncing right off the long-term rising bottoms trendline. Upside potential is great. We just need that breakout to seal it.
PG&E Corp. (PCG)
EARNINGS: 10/28/2021 (BMO)
PG&E Corp. is a holding company, which engages in generation, transmission, and distribution of electricity and natural gas to customers. It specializes in energy, utility, power, gas, electricity, solar and sustainability. The company was founded in 1995 and is headquartered in San Francisco, CA.
PCG is currently down -0.11% in after hours trading. This is a low-priced stock and given the very negative configuration of the EMAs, it is also risky. However, the chart is quite favorable. We have either a "V" bottom or double-bottom. Both patterns are bullish so take your pick. I would love to have presented this on a breakout above overhead resistance at the October low, but given it closed on its high for the day, that will suffice. The RSI just moved into positive territory and the PMO triggered a PMO BUY signal today. Volume is flying in. The stop is set below the August 2020 low.
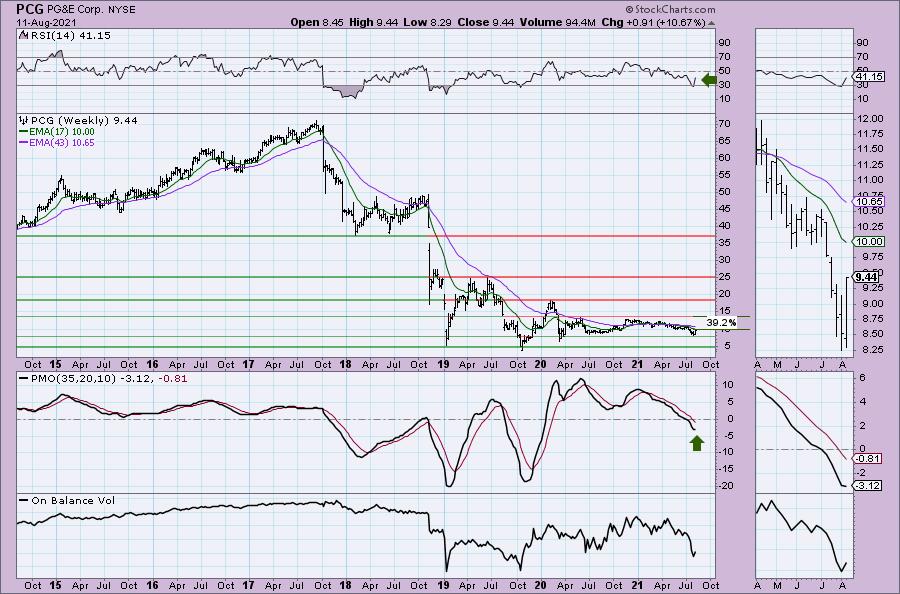
This company took a huge hit at the end of 2017 when it was proven that their faulty lines caused a major fire in Northern California that killed 84 people. The state of California ended up bailing them out in 2019 after they donated $2.1 million to California politicians' campaigns (article here). The settlement required handouts of stock in order to cover the lawsuits, diluting it further at the end of 2018. While the stock rebounded in late 2019, it did nothing to repair the damage of 2017-2018. I could go on about California's mismanagement of wildfire prevention, but this isn't the place for it (but, if you're interested, read an NPR article on how Governor Newsom cut the forest management budget! We're in the process of trying to recall him).
The stock is now basing here. The weekly RSI is rising again and the weekly PMO is attempting to bottom. While I'm not a fan of the politics of this company, I'm more than willing to make some money off their stock. Upside potential is a healthy 39.2%.
Don't forget, on Thursdays I look at reader-requested symbols, so shoot me an email at erin@decisionpoint.com. I read every email I receive and try to answer them all!
Current Market Outlook:
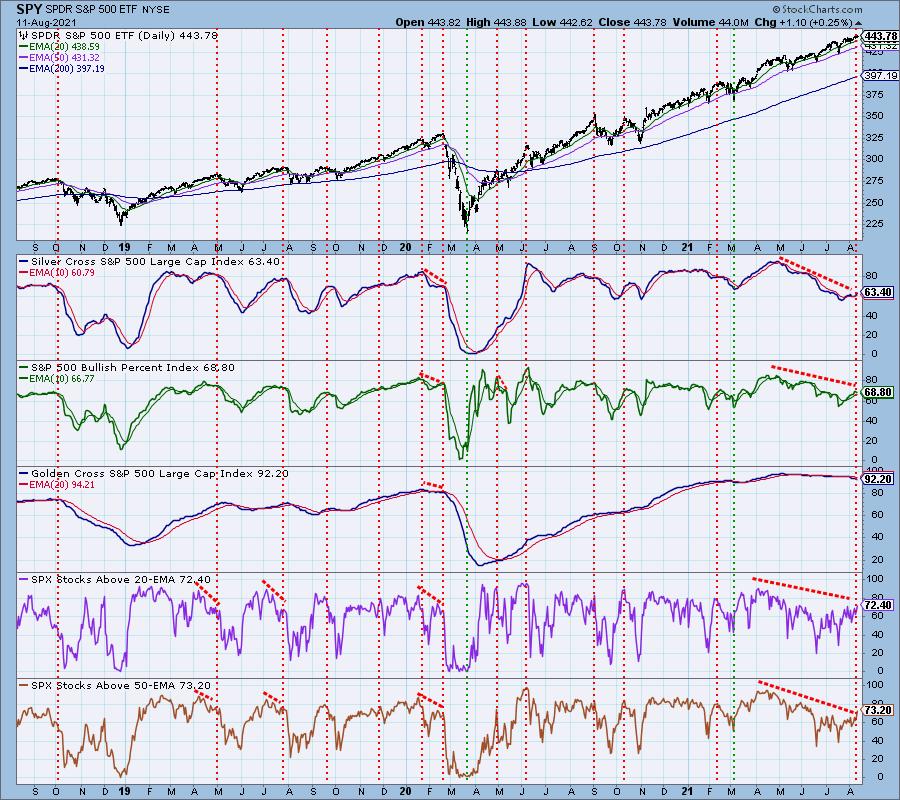
Market Environment: It is important to consider the odds for success by assessing the market tides. The following chart uses different methodologies for objectively showing the depth and trend of participation for intermediate- and long-term time frames.
- The Silver Cross Index (SCI) shows the percentage of SPX stocks on IT Trend Model BUY signals (20-EMA > 50-EMA)
- The Golden Cross Index (GCI) shows the percentage of SPX stocks on LT Trend Model BUY signals (50-EMA > 200-EMA)
- The Bullish Percent Index (BPI) shows the percentage of SPX stocks on Point & Figure BUY signals.
Don't forget that as a "Diamonds" member, you have access to our GCI/SCI curated ChartList on DecisionPoint.com. You'll find it under "Members Only" links on the left side on the Blogs and Links Page.
Here is the current chart:
Full Disclosure: I'm about 50% invested and 50% is in 'cash', meaning in money markets and readily available to trade with.
Technical Analysis is a windsock, not a crystal ball.
Happy Charting!
- Erin
erin@decisionpoint.com
Watch the latest episode of DecisionPoint with Carl & Erin Swenlin on Mondays 7:00p EST or on the DecisionPoint playlist on the StockCharts TV YouTube channel here!
NOTE: The stocks reported herein are from mechanical trading model scans that are based upon moving average relationships, momentum and volume. DecisionPoint analysis is then applied to get five selections from the scans. The selections given should prompt readers to do a chart review using their own analysis process. This letter is not a call for a specific action to buy, sell or short any of the stocks provided. There are NO sure things or guaranteed returns on the daily selection of "Diamonds in the Rough."
Helpful DecisionPoint Links:
DecisionPoint Shared ChartList and DecisionPoint Chart Gallery
Price Momentum Oscillator (PMO)
Swenlin Trading Oscillators (STO-B and STO-V)
For more links, go to DecisionPoint.com