
It was a pretty good batch of reader requests that arrived; it took me some time to evaluate each one. Determining which made the report was quite difficult as most of the charts had merit. I did whittle it down and we have coverage of five different sectors.
I struggled with my addition to the list as there were two stocks, Tandem Diabetes (TNDM) and Twilio (TWLO), that I couldn't decide to include. I opted for TWLO, but definitely take a look at TNDM.
Don't forget to sign up for tomorrow's Diamond Mine trading room! The link is below and right HERE.
Today's "Diamonds in the Rough" are: ANIX, ARES, HLI, TWLO and WMS.
Stocks to Review ** (no order): TNDM, IBB, RCUS, BLDR, CTAS, LHX, VICR, ABB, BJ, BDN, and NDAQ.
** The "Stocks to Review" are stocks that were on my short list for the day.
 Diamond Mine Information:
RECORDING LINK "Bonus" Diamond Mine Wednesday (7/14):
Topic: Make-up DecisionPoint Diamond Mine (7/14/2021) LIVE Trading Room
Start Time : Jul 14, 2021 08:59 AM
Meeting Recording LINK for 7/14 is HERE.
Access Passcode: July-14th
RECORDING LINK FRIDAY (7/16) Diamond Mine:
Topic: DecisionPoint Diamond Mine (7/16/2021) LIVE Trading Room
Start Time : Jul 16, 2021 09:02 AM
Meeting Recording Link for 7/16 is HERE.
Access Passcode: July-16th
REGISTER NOW for Friday 7/23 Diamond Mine:
When: Jul 23, 2021 09:00 AM Pacific Time (US and Canada)
Topic: DecisionPoint Diamond Mine (07/23/2021) LIVE Trading Room
Register in advance for this webinar HERE.
Save the registration confirmation email with login instructions in case Zoom doesn't notify you in time.
Free DP Trading Room (7/19) RECORDING LINK:
Topic: DecisionPoint Trading Room
Start Time : Jul 19, 2021 08:57 AM
Meeting Recording for DP Trading Room (7/19) Link is HERE.
Access Passcode: July/19th
Guest: Leslie Jouflas, CMT - Free DP Trading Room (7/12) RECORDING LINK:
Topic: DecisionPoint Trading Room
Start Time : Jul 12, 2021 09:00 AM
Meeting Recording for DP Trading Room is HERE.
Access Passcode: W72^WzSb
For best results, copy and paste the access code to avoid typos.
Welcome to DecisionPoint Daily Diamonds, wherein I highlight five "Diamonds in the Rough." These are selected from the results of my DecisionPoint scans, which search for stocks that could benefit from the trend and condition of the market. Remember, these are not recommendations to buy or sell, but are the most interesting of the stocks that surfaced in my scans. My objective is to save you the work of the initial, tedious culling process, but you need to apply your own analysis to see if these stocks pique your interest as well. There are no guaranteed winners here!
Anixa Biosciences, Inc. (ANIX)
EARNINGS: 9/8/2021 (AMC)
Anixa Biosciences, Inc. is a cancer-focused biotechnology company, which focuses on harnessing the body's immune system in the fight against cancer. It operates through the following segments: Cancer Diagnostics, Cancer Therapeutics, and Legacy Patent Licensing Activities. Cancer Diagnostic segment develops CchekTM platform, a series of inexpensive non-invasive blood tests for the early detection of solid tumors, which is based on the body's immune response to the presence of a malignancy. Cancer Therapeutics segment offers chimeric antigen receptor T-cell (CAR-T) based immune-therapy drugs which genetically engineer a patient's own immune cells to fight cancer. The company was founded on November 5, 1982 and is headquartered San Jose, CA.
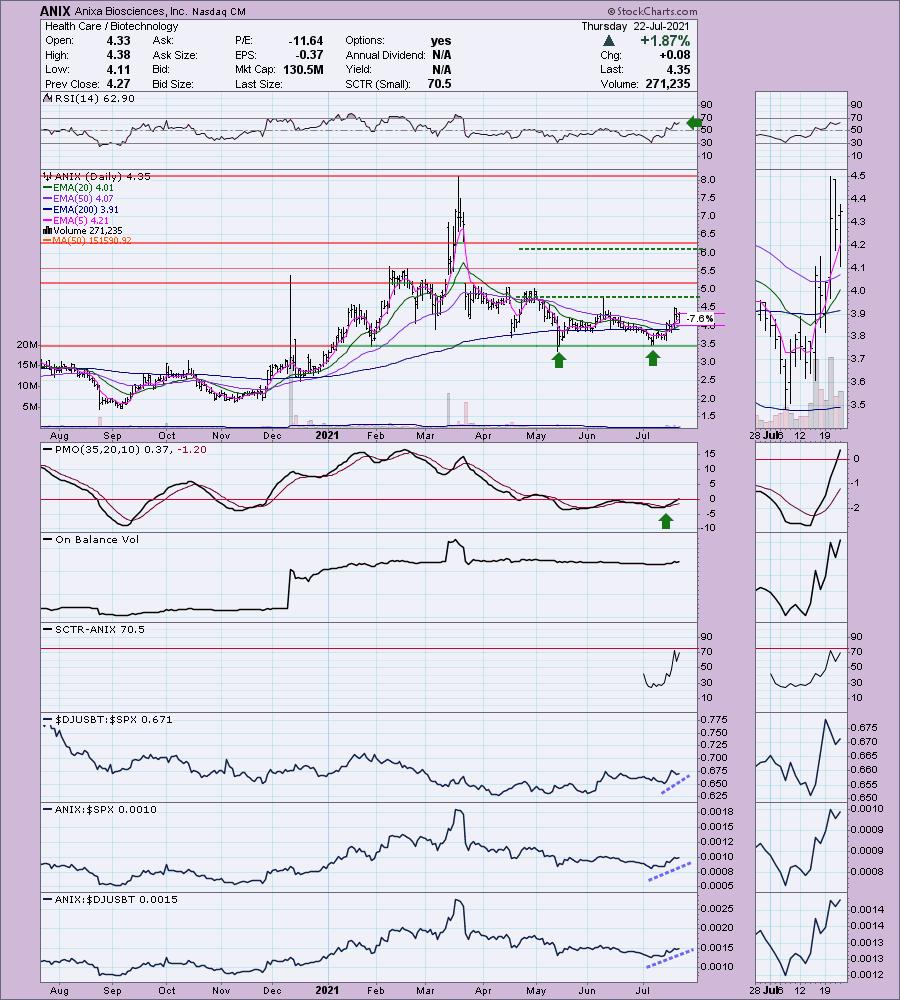
ANIX is currently up +0.23% in after hours trading. I've noticed some relative strength coming back into Biotechs since last week which is why I have IBB and RCUS in the "stocks to review". This reader request looks good, it is just very volatile given its low price point, so position size wisely. There is a double-bottom forming after price bounced off support. The minimum upside target of the pattern would take price very close to gap resistance. This chart is now ripe given the breakout above all of its EMAs. The RSI is positive and not overbought. The PMO recently generated a crossover BUY signal and has now reached positive territory above the zero line. You can see in the thumbnail that volume is picking up so the OBV is confirming the current rally. Relative strength is excellent. The stop level is around the 20/50-EMAs.
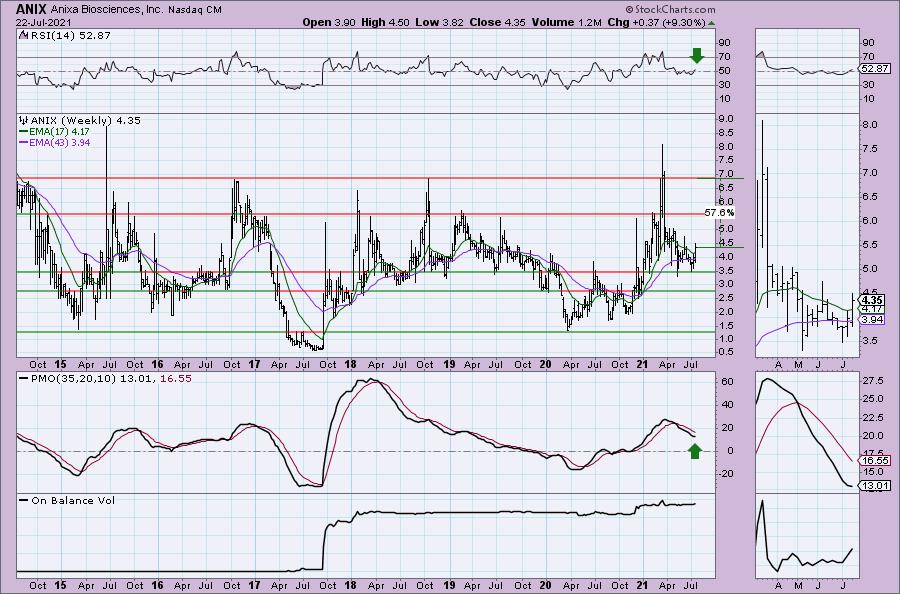
The weekly chart is just starting to get bullish with a positive weekly RSI and a weekly PMO that is turning back up. Upside potential is very good, but remember you may have to endure some volatile moves along the way. It's already up +9.3% this week.
Ares Management, LP (ARES)
EARNINGS: 7/29/2021 (BMO)
Ares Management Corp. is engaged in providing investment management and consultancy services. It operates through the following segments: Credit Group, Private Equity Group and Real Estate Group. The Credit Group segment offers credit strategies across the liquid and illiquid spectrum, including syndicated bank loans, high yield bonds, credit opportunities, special situations, asset-backed investments and U.S. and European direct lending. The Credit Group provides solutions for traditional fixed income investors seeking to access the syndicated bank loan and high yield bond markets and capitalize on opportunities across traded corporate credit. It additionally provides investors access to directly originated fixed and floating rate credit assets and the ability to capitalize on illiquidity premiums across the credit spectrum. The Private Equity Group segment manages shared control investments in corporate private equity funds. The Real Estate Group segment provides debt, mortgage loans, and equity capital to borrowers, property owners, and real estate developers. The company was by founded by Michael J. Arougheti, David B. Kaplan, John H. Kissick, Antony P. Ressler, and Bennett Rosenthal in 1997 and is headquartered in Los Angeles, CA.
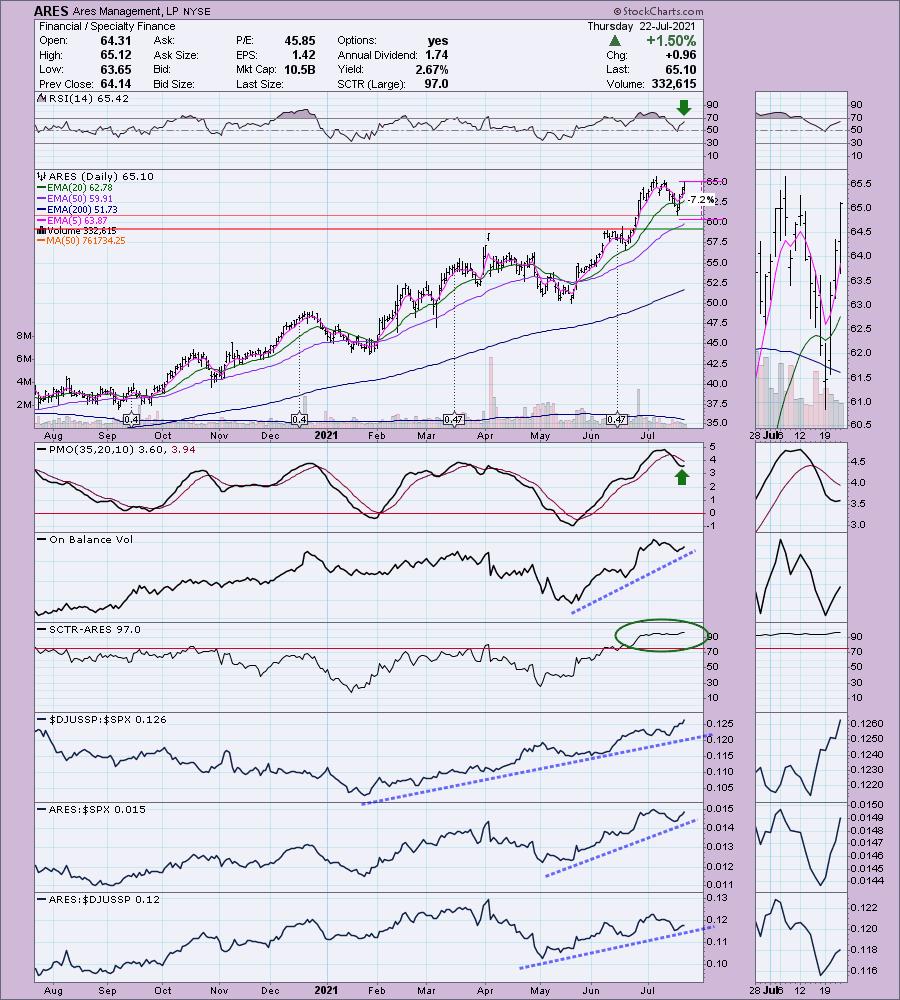
ARES is down -0.15% in after hours trading. I covered ARES back on June 2nd 2021. The stop was never hit so the position is up +17.1%. I like the recent bounce from a pullback. Price didn't have to actually touch the 50-EMA before rebounding which is very bullish. The RSI is positive and not overbought. The PMO is turning back up, but is somewhat overbought (my only complaint about this chart). The OBV is confirming the rally and relative strength is spectacular with a 97% SCTR reading and outperformance by the group since November. ARES has been outperforming the SPX and the group since May. The stop level is set in the middle of a support zone and above the 50-EMA.
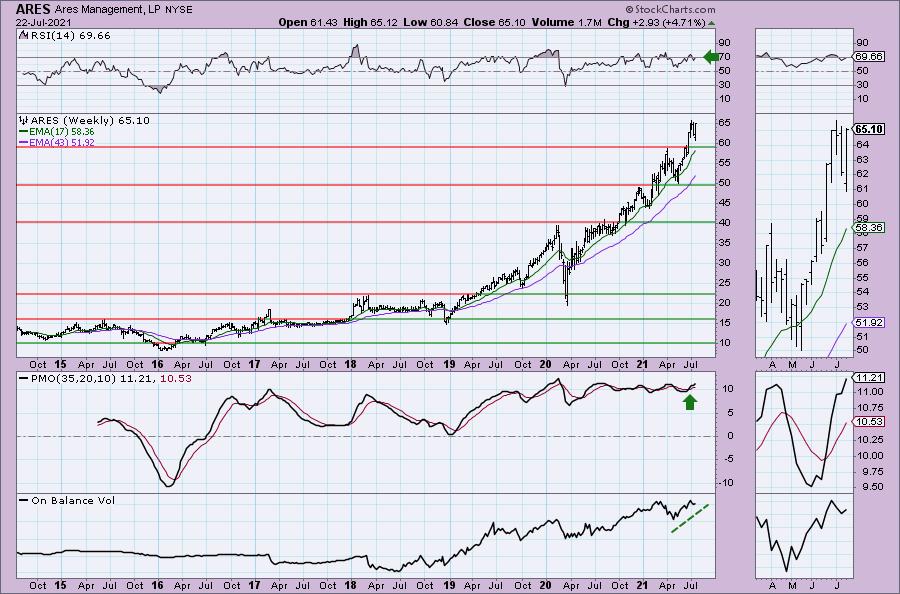
The weekly chart is positive. The RSI is getting overbought, but it can definitely stay that way. The PMO is on a BUY signal. It does appear that the PMO is overbought, but the OBV looks positive. I also know that we have a bullish engulfing candlestick based on the trading range yesterday and today.
Houlihan Lokey, Inc. (HLI)
EARNINGS: 8/3/2021 (BMO)
Houlihan Lokey, Inc. engages in the provision of investment banking services. It operates through the following segments: Corporate Finance, Financial Restructuring and Financial and Valuation Advisory. The Corporate Finance segment provides general financial advisory services in addition to advice on mergers and acquisitions and capital markets offering. The Financial Restructuring segment provides advice to debtors, Creditors and parties-in-interest in connection with recapitalization or deleveraging transactions. The Financial Valuation and Advisory Services segment provides valuation of various assets including companies, illiquid debt and equity Securities and intellectual property. The company was founded in 1972 and is headquartered in Los Angeles, CA.
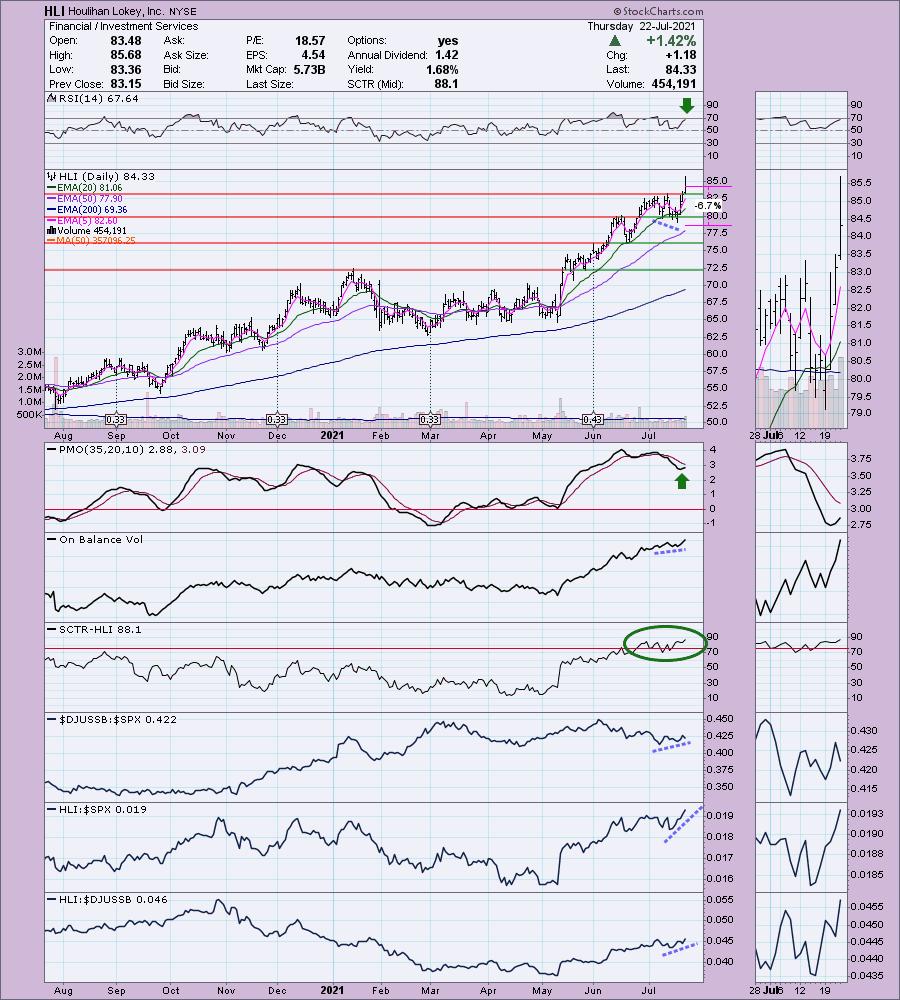
HLI is unchanged in after hours trading. Nice breakout today. The RSI is positive and not overbought. We have a PMO that has just turned up. The OBV had a nice short-term positive divergence with price lows in July prior to the bounce off the 20-EMA. The SCTR has spent the month in the "hot zone" above 75. The group is outperforming and notice the strong outperformance against the SPX for HLI. I also like that I can set a stop at just 6.7%.
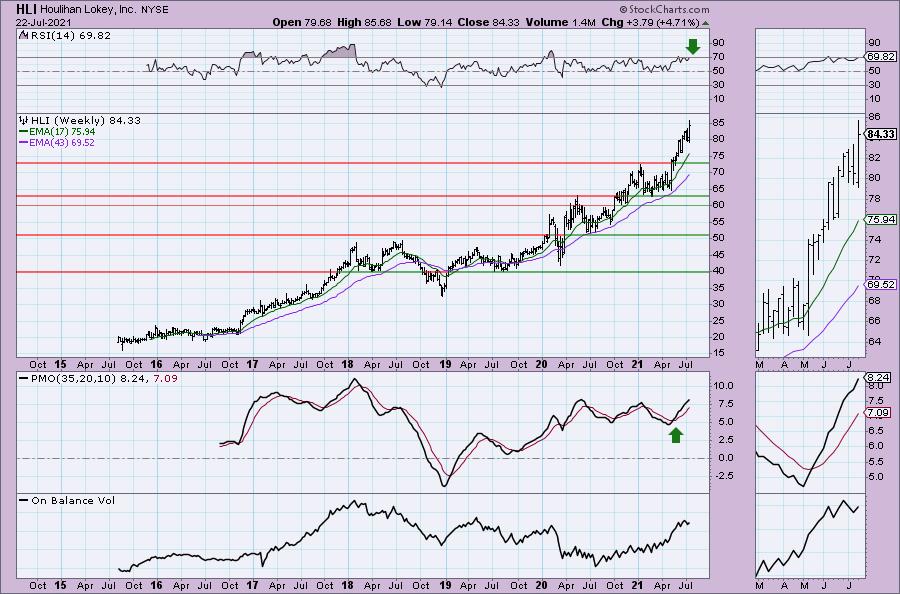
The weekly chart is very favorable. The RSI is positive, although it is beginning to enter overbought territory. The weekly PMO is on a BUY signal and not overbought. The OBV is confirming the rally.
Twilio Inc. (TWLO)
EARNINGS: 7/29/2021 (AMC)
Twilio, Inc. engages in the development of communications software, cloud-based platform, and services. Its products include Twilio flex, messaging, programmable voice, programmable video, elastic SIP trunking, and IoT. The company was founded by John Wolthuis, Jeffery G. Lawson, and Evan Cooke in March 2008 and is headquartered in San Francisco, CA.
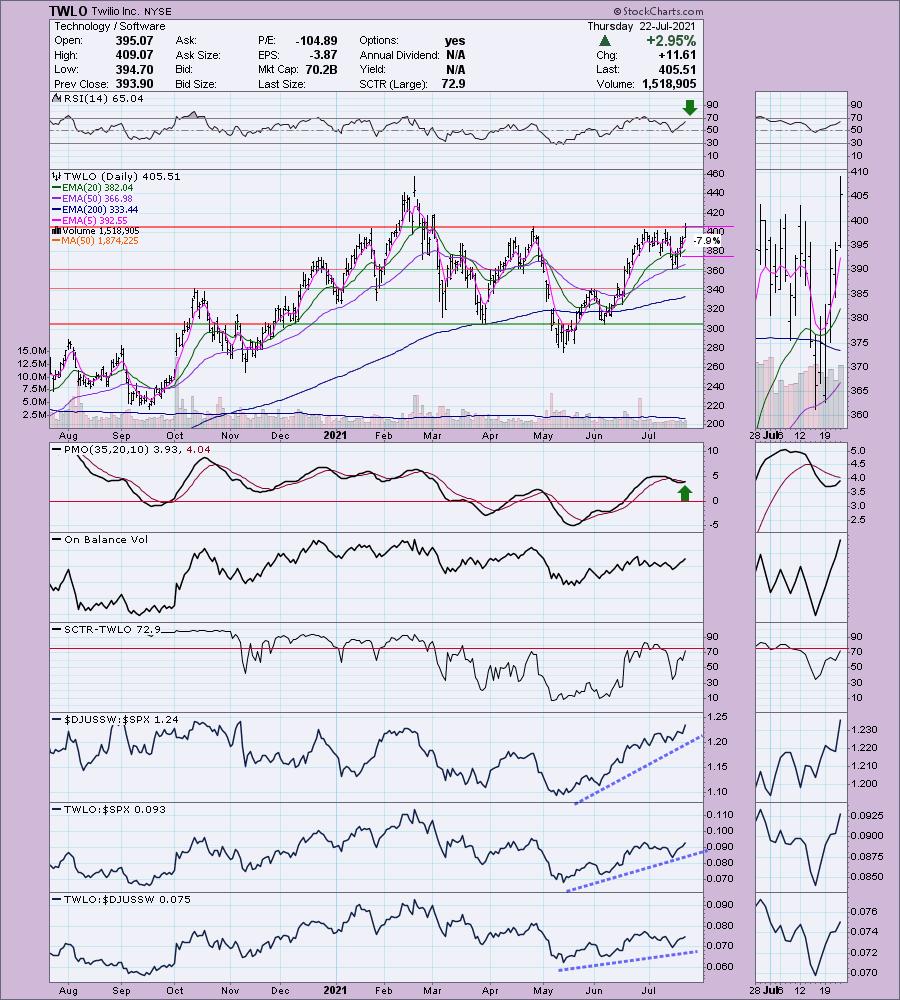
TWLO is up +0.37% in after hours trading. I will be watching both TWLO and TNDM tomorrow for a possible entry. The charts are very positive. Price broke above overhead resistance after bouncing off the 50-EMA. The PMO has switched direction and is rising toward a BUY signal. The RSI is positive and not overbought. The SCTR is nearing the "hot zone" above 75. Relative strength is strong by the group as well as TWLO which is a clear out performer within a strong industry group like Software. The stop is about 8%, landing it at around $375.
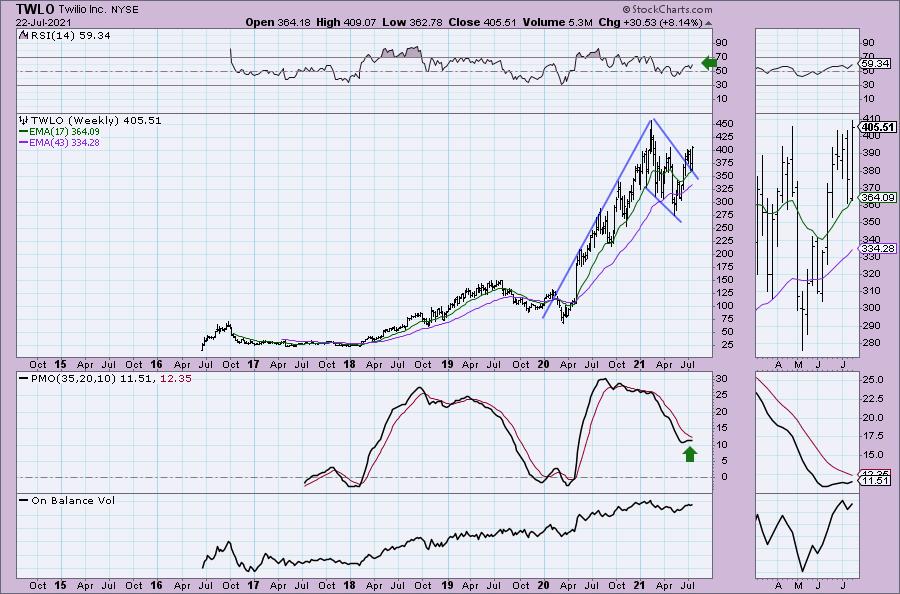
I like the weekly chart as well. There is a giant bull flag that is executing with the breakout above the declining tops trendline that forms the top of the flag. The RSI is positive and the weekly PMO has turned up.
Advanced Drainage Systems, Inc. (WMS)
EARNINGS: 8/5/2021 (BMO)
Advanced Drainage Systems, Inc. engages in the manufacture of thermoplastic corrugated pipe, which provides suite of water management products and drainage solutions for use in the construction and infrastructure marketplace. It operates through the following segments: Pipe, Infiltrator, International, and Allied Products & Other. The Pipe segment manufactures and markets thermoplastic corrugated pipe throughout the United States. The Infiltrator segment provides plastic leachfield chambers and systems, septic tanks and accessories, primarily for use in residential applications. The International segment manufactures and markets pipe and allied products in regions outside of the United States. The Allied Products & Other segment manufactures and markets products throughout the United States. Products include StormTech, Nyloplast, ARC Septic Chambers, Inserta Tee, water quality filters and structures, Fittings, and FleXstorm. The company was founded in 1966 and is headquartered in Hilliard, OH.
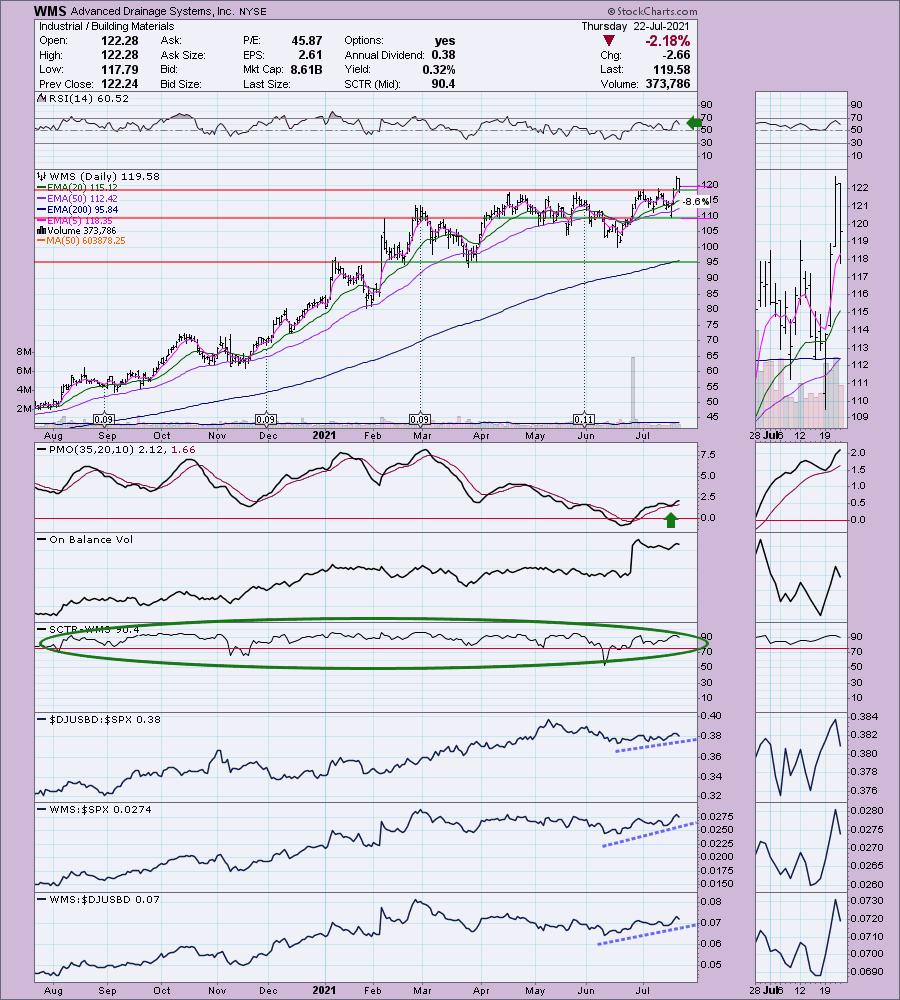
WMS is unchanged in after hours trading. I like today's pullback to the breakout point. The RSI is positive and the PMO has a bottom above the signal line which is especially bullish. My one complaint about this chart is there is a negative divergence on the OBV. The SCTR has spent the majority of the past year in the "hot zone" above 75. Relative performance is rising for the group and WMS.
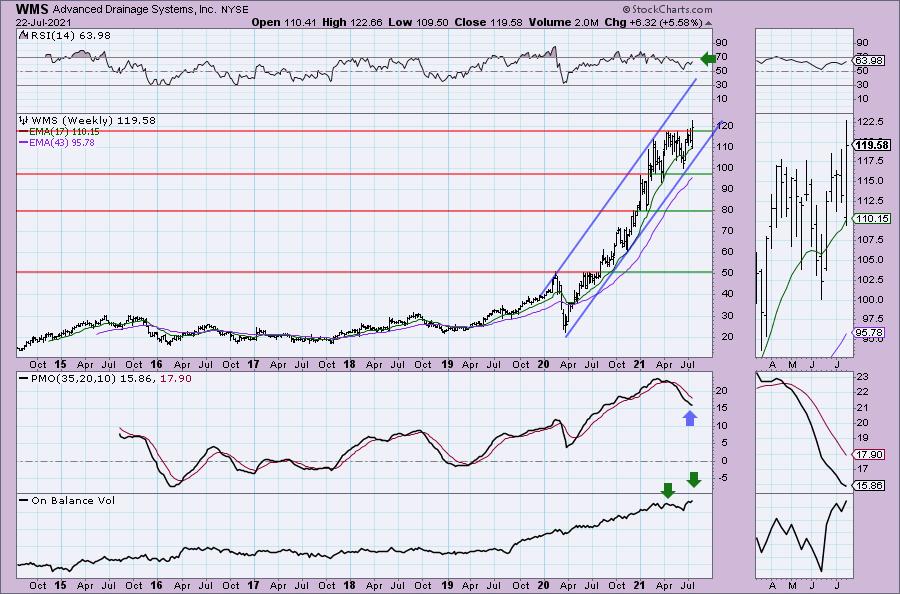
We can see that WMS is traveling in a steep rising trend channel. The steepness of the rising bottoms line does concern me somewhat as steep rising trends are hard to maintain. Of course WMS has had no problem with it for about a year. The weekly RSI is positive. The weekly PMO could use more work. The OBV is confirming the break with a higher high.
"Under the Hood" Indicators
My webinar yesterday on "Under the Hood" Indicators at the Synergy Traders event was a success. I was able to get links to the recordings for BOTH days. You'll find my presentation in the second link. I was the last presenter.
Day 1 of Synergy Traders "Favorite Indicators" educational webinar event LINK.
Day 2 of Synergy Traders "Favorite Indicators" educational webinar event with Erin's webinar LINK.
Don't forget, on Thursdays I look at reader-requested symbols, so shoot me an email at erin@decisionpoint.com. I read every email I receive and try to answer them all!
Current Market Outlook:
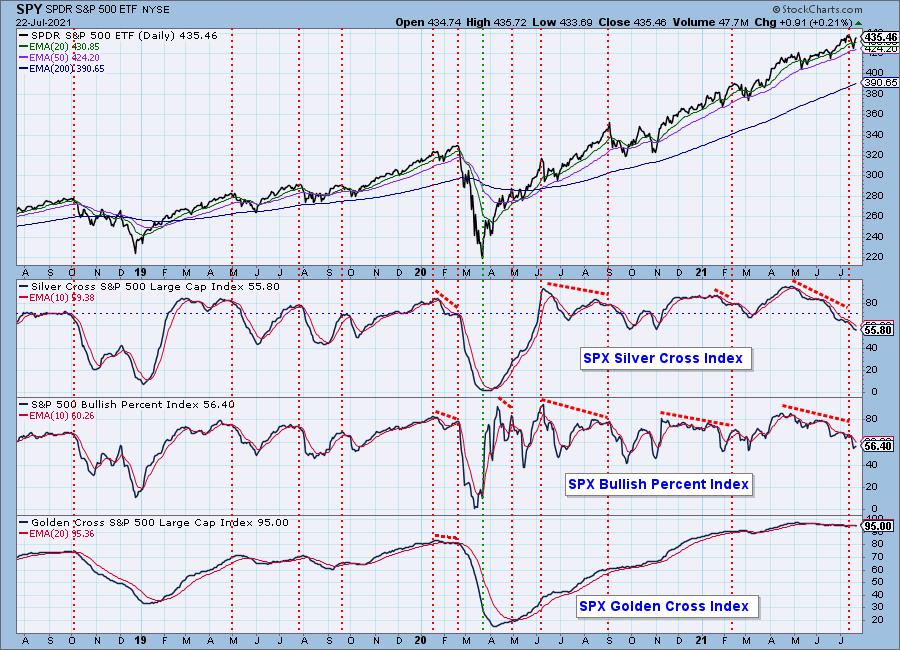
Market Environment: It is important to consider the odds for success by assessing the market tides. The following chart uses different methodologies for objectively showing the depth and trend of participation for intermediate- and long-term time frames.
- The Silver Cross Index (SCI) shows the percentage of SPX stocks on IT Trend Model BUY signals (20-EMA > 50-EMA)
- The Golden Cross Index (GCI) shows the percentage of SPX stocks on LT Trend Model BUY signals (50-EMA > 200-EMA)
- The Bullish Percent Index (BPI) shows the percentage of SPX stocks on Point & Figure BUY signals.
Don't forget that as a "Diamonds" member, you have access to our GCI/SCI curated ChartList on DecisionPoint.com. You'll find it under "Members Only" links on the left side on the Blogs and Links Page.
Here is the current chart:
Full Disclosure: I'm about 30% invested and 70% is in 'cash', meaning in money markets and readily available to trade with.
Technical Analysis is a windsock, not a crystal ball.
Happy Charting!
- Erin
erin@decisionpoint.com
Watch the latest episode of DecisionPoint with Carl & Erin Swenlin on Mondays 7:00p EST or on the DecisionPoint playlist on the StockCharts TV YouTube channel here!
NOTE: The stocks reported herein are from mechanical trading model scans that are based upon moving average relationships, momentum and volume. DecisionPoint analysis is then applied to get five selections from the scans. The selections given should prompt readers to do a chart review using their own analysis process. This letter is not a call for a specific action to buy, sell or short any of the stocks provided. There are NO sure things or guaranteed returns on the daily selection of "Diamonds in the Rough."
Helpful DecisionPoint Links:
DecisionPoint Shared ChartList and DecisionPoint Chart Gallery
Price Momentum Oscillator (PMO)
Swenlin Trading Oscillators (STO-B and STO-V)
For more links, go to DecisionPoint.com