
The market continues to trend upward despite overbought worries and negative divergences. This doesn't mean we are out of the woods, but I believe we should take short-term advantage of this "wall of worry". It requires discipline and stops to ensure safety should the market turn on a dime.
I noticed quite a few "V" bottom patterns as I scanned my choices today. The problem I had with many is that they had gotten stuck at overhead resistance at their 20/50-EMAs. I avoided that for the most part on today's selections. I did not annotate the V's on most of the charts, but they are visible in the short term. Remember, the pattern executes when price has retraced about 1/3rd of the left side of the "V". The expectation is a rally past the top of the left-side of the "V".
Today's "Diamonds in the Rough" are: ANET, CGNX, CHGG, EVLO and NEO.
** Everyone needs a vacation and I am no exception. I've planned a mini vacation to local wine country mid-week 3/23 through 3/25. The DecisionPoint Alert will be published, but I'll be taking the week off for Diamonds with the exception of the 3/26 Diamond Mine. I need to fit wine tasting in somehow! To compensate you for that week, I am adding a week to the end of all Diamond and Bundle subscribers' terms when I return, because who knows, I may end up writing a report or two. **
 Diamond Mine REGISTRATION Information:
When: Mar 19, 2021 09:00 AM Pacific Time (US and Canada)
Topic: DecisionPoint Diamond Mine (3/19/2021) LIVE Trading Room
Register in advance for this webinar HERE.
After registering, you will receive a confirmation email containing information about joining the webinar, including the password.
=======================================================================
Diamond Mine RECORDING Link from 3/12/2021:
Topic: DecisionPoint Diamond Mine (03/12/2021) LIVE Trading Room
Start Time : Mar 12, 2021 09:00 AM
Access Passcode: &hJ8Vv^P
***Click here to register for this recurring free DecisionPoint Trading Room on Mondays at Noon ET!***
+++++++++++++++++++++++++++++++++++++++++++++++++++++++++++++++++++++++++++++++
Free DP Trading Room RECORDING LINK:
Topic: DecisionPoint Trading Room
Start Time : Mar 15, 2021 08:58 AM
Free DP Trading Room Recording Link.
Access Passcode: 0f$2Pf5z
For best results, copy and paste the access code to avoid typos.
Welcome to DecisionPoint Daily Diamonds, wherein I highlight five "diamonds in the rough." These are selected from the results of my DecisionPoint scans, which search for stocks that could benefit from the trend and condition of the market. Remember, these are not recommendations to buy or sell, but are the most interesting of the stocks that surfaced in my scans. My objective is to save you the work of the initial, tedious culling process, but you need to apply your own analysis to see if these stocks pique your interest as well. There are no guaranteed winners here!
Arista Networks, Inc. (ANET)
EARNINGS: 5/4/2021 (AMC)
Arista Networks, Inc. engages in the development, marketing, and sale of cloud networking solutions. Its cloud networking solutions consist of Extensible Operating System(EOS) a set of network applications and Ethernet switching, and routing platforms. The company was founded by Andreas Bechtolsheim, David Cheriton, and Kenneth Duda in October 2004 and is headquartered in Santa Clara, CA.
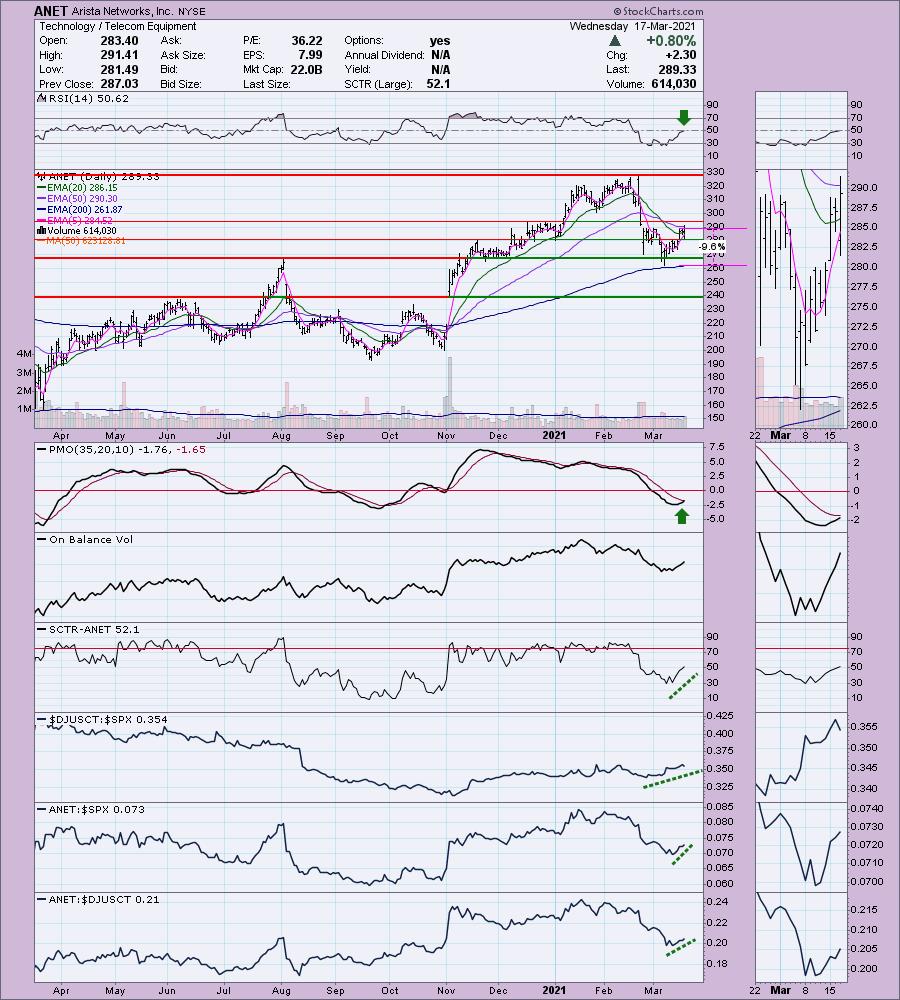
ANET is up +1.92% in after hours trading. While this one hasn't gotten above its 50-EMA, it has found support at the November top. More resistance is ahead, but the indicators are healthy (and we know it's up nearly 2% in after-hours trading). The RSI just moved into positive territory and the PMO is nearing a positive crossover. It is beginning to outperform and it is in an industry group that is already healthy. The SCTR is rising. The bounce off the 200-EMA looks good. The stop is set right around the 200-EMA. I'd prefer tighter stops right now, but sometimes I have to make them more deep to take advantage of near-term support levels.
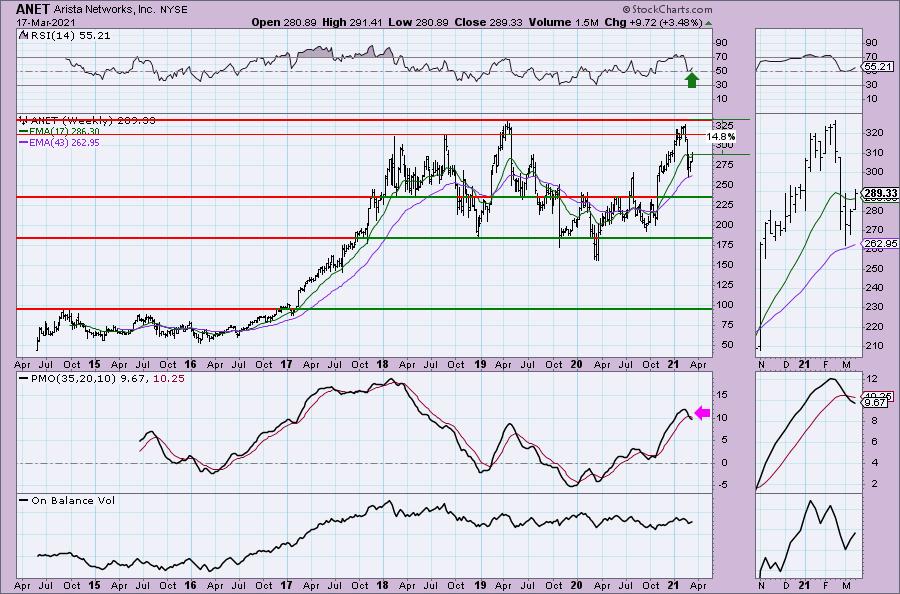
The weekly PMO isn't too healthy, but it does appear to be decelerating. The RSI is positive. Upside target is near 15%, but I'm banking on a breakout.
Cognex Corp. (CGNX)
EARNINGS: 4/26/2021 (AMC)
Cognex Corp. engages in the provision of machine vision products that capture and analyze visual information in order to automate tasks in processes, where vision is required. The company was founded by Robert J. Shillman, William Silver and Marilyn Matz in 1981 and is headquartered in Natick, MA.
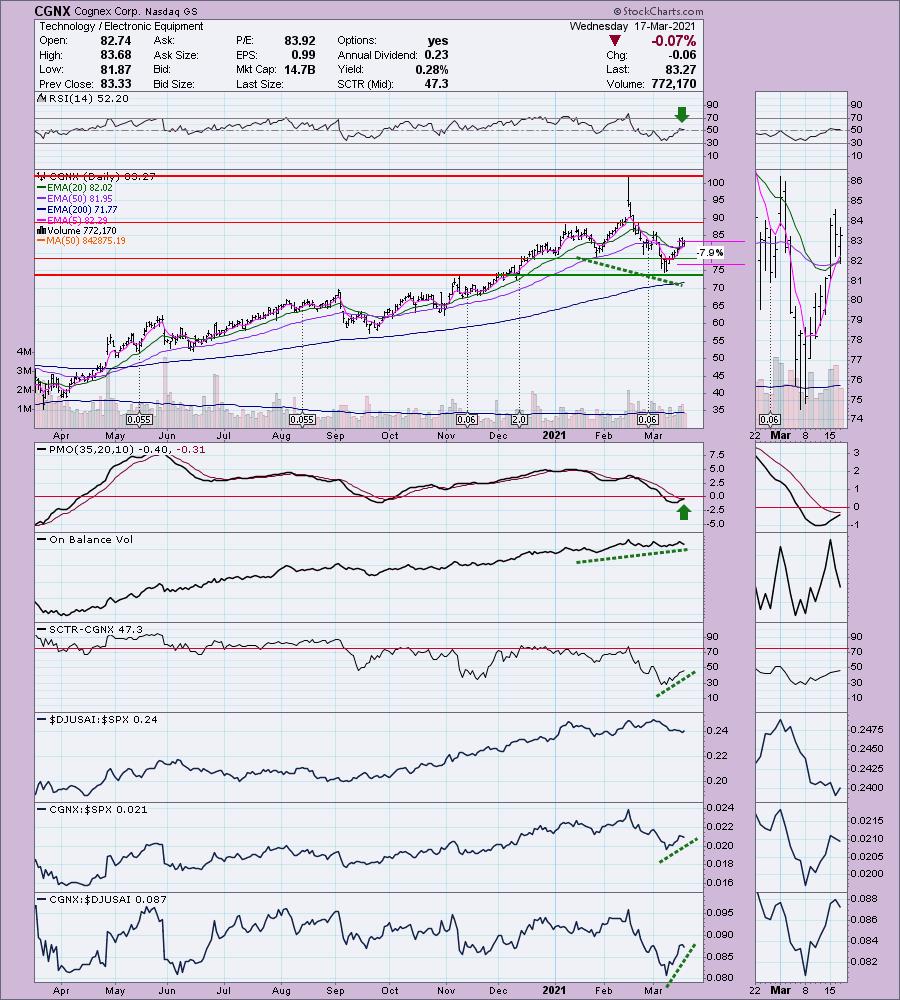
CGNX is down -1.12% in after hours trading. Given it is down, look for an entry close to the 50-EMA, but should it lose that support area, avoid it. Right now the chart looks good. We have new ST and IT Trend Model BUY signals based on 5/20/50-EMA positive crossovers. The RSI is still in positive territory. There is a PMO crossover BUY signal on tap. Additionally there is a nice positive divergence with the OBV. The SCTR is rising nicely. While the industry group isn't performing that well against the SPX, CGNX is performing well against the SPX. The stop is set below the January low.
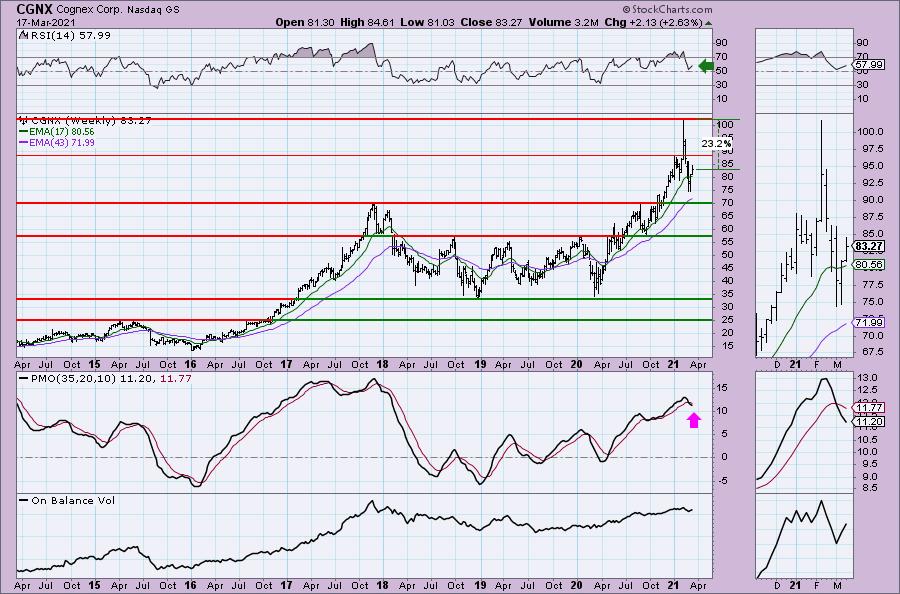
Price is coming off the 43-week EMA. I don't care for the declining PMO, but price is back above the 17-week EMA and the RSI is positive.
Chegg, Inc. (CHGG)
EARNINGS: 5/3/2021 (AMC)
Chegg, Inc. engages in the operations of learning platform for students. It intends to empower students to take control of their education and help the students study, college admissions exams, accomplish their goals, get grades and test scores. The firm offers required and non-required scholastic materials including textbooks in any format, access to online homework help and textbook solutions, course organization and scheduling, college and university matching tools and scholarship connections. Its services include Chegg study, writing, tutors and math solver. The company was founded by Osman Rashid and Aayush Phumbhra on July 29, 2005 and is headquartered in Santa Clara, CA.
CHGG is up +1.11% in after hours trading. I've covered CHGG three times before. The first time was April 27th 2020. The stop has never been hit so it is up +124.5%. Second time was September 23rd 2020. The stop was never hit after this pick too so it is up 34.3% since then. The last time was on December 8th 2020. The stop was not hit after this pick either so it is up 18.5% since then. It appears ripe for another entry as the PMO has turned up and the RSI just hit positive territory. The SCTR is headed back up and it is outperforming within a group that is beginning to outperform. I'd like to set the stop at the 200-EMA support level, but that is about a 13.5% stop level and that is too much for me. I decided to set it at the January low.
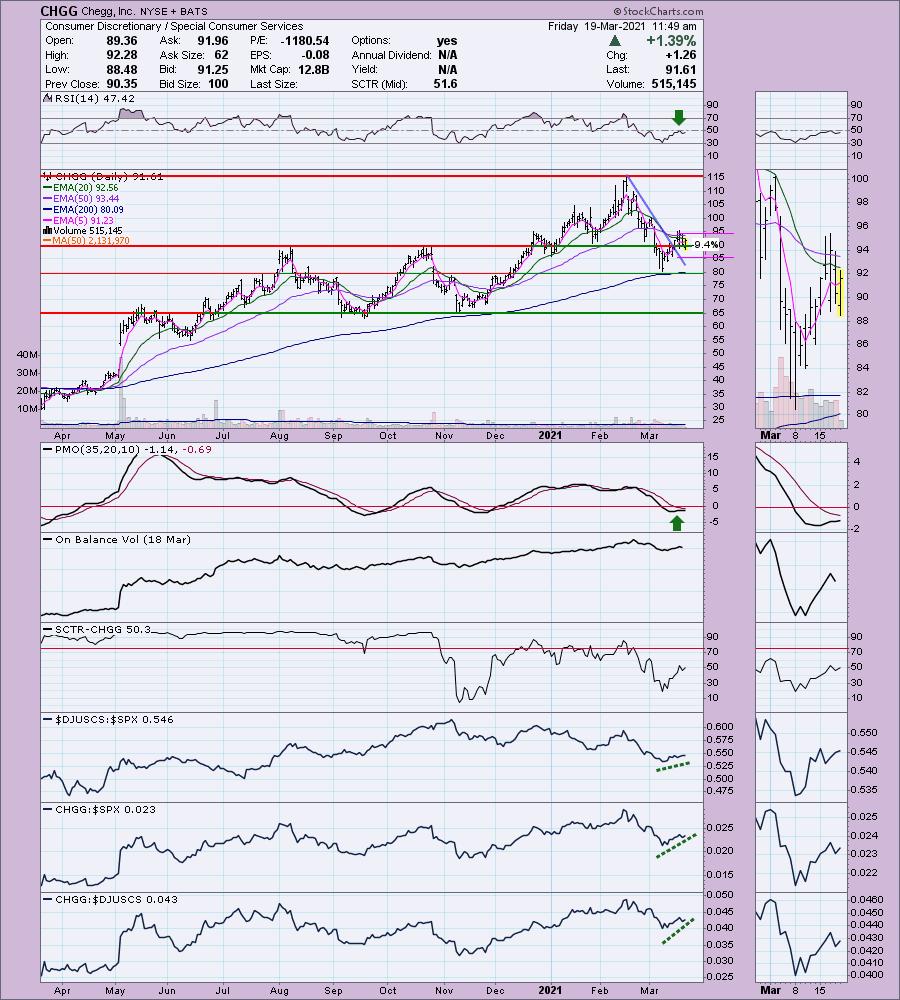
The weekly PMO is ugly, no denying that so watch this one carefully. The RSI is staying positive and we can see this week's OHLC bar is sitting on support at the mid-year 2020 tops. I like the look of the daily chart so I'm looking for a move to challenge the 2021 high.

Don't forget, on Thursdays I look at reader-requested symbols, so shoot me an email at erin@decisionpoint.com. I read every email I receive and try to answer them all!
Evelo Biosciences, Inc. (EVLO)
EARNINGS: 5/10/2021 (BMO)
Evelo Biosciences, Inc. operates as a clinical stage biotechnology company. The firm engages in the development of monoclonal microbials, a modality of oral biologic medicines. It has three product candidates, EDP1066 and EDP1815 for the treatment of inflammatory diseases and EDP1503 for the treatment of cancer. The company was founded by Noubar B. Afeyan and David A. Berry in 2014 and is headquartered in Cambridge, MA.
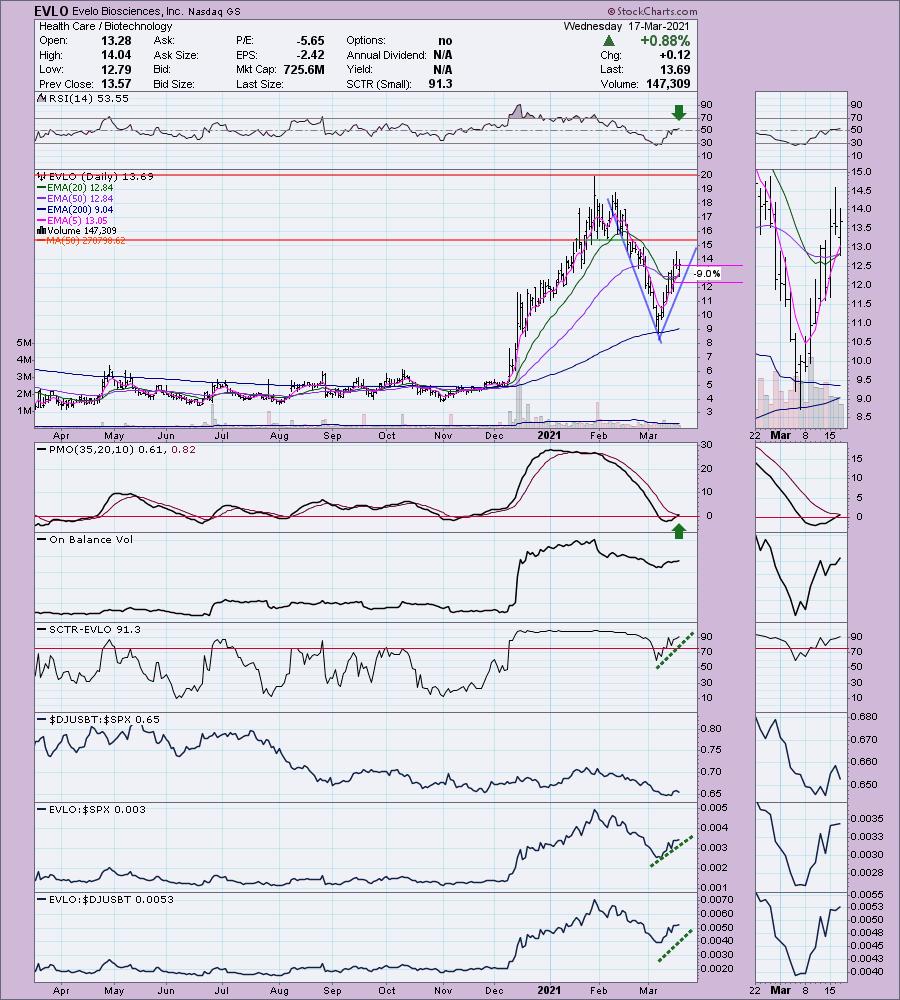
EVLO is unchanged in after hours trading. Biotechs peppered my scans today, including one of the Biotech ETFs. I'm not sure how sold I am on this resurgence in Biotechs, but this one definitely caught my eye. We have a textbook "V" pattern and price has retraced about 1/2 of that decline. There is a recent ST Trend Model BUY signal as the 5-EMA crossed above the 20-EMA. An IT Trend Model BUY signal or "silver cross" is on tap for tomorrow. The PMO is nearing a crossover BUY signal and the RSI is positive. The group is showing a slight improvement against the SPX, but EVLO has been outperforming both the group and the SPX. The stop level is set around $12.50 which is underneath both the 20/50-EMAs.
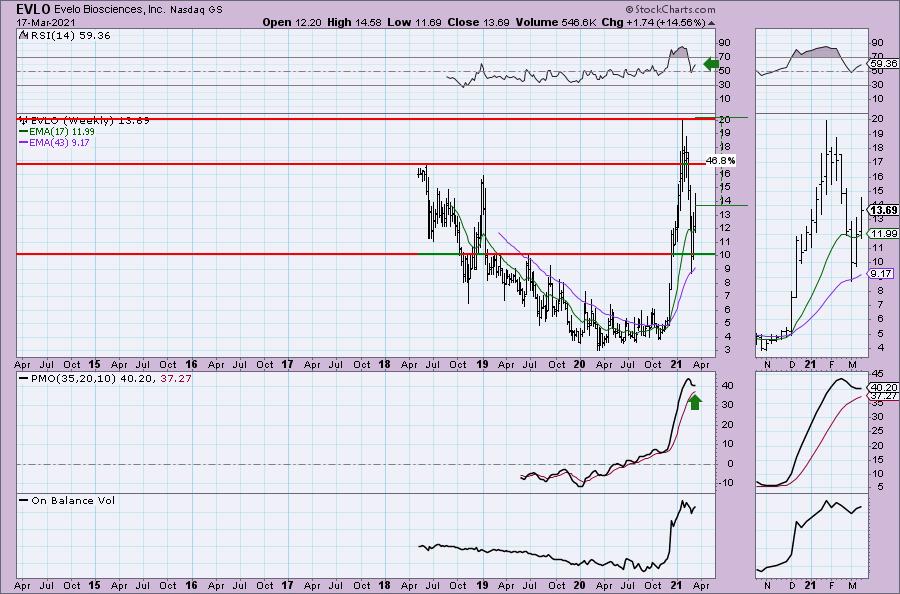
Nice bounce off the 43-week EMA and now it is holding above the 17-week EMA. The RSI is positive and no longer overbought. The PMO is turning up above its signal line which is especially bullish. Remember Biotechs can be very volatile so position size properly. Upside potential is sizable should it get back to its 2021 high.
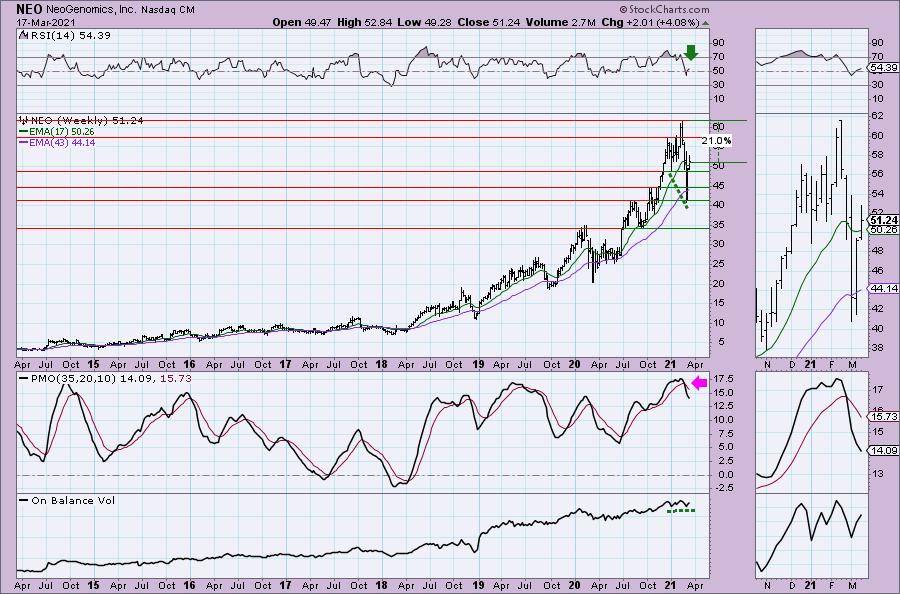
NeoGenomics, Inc. (NEO)
EARNINGS: 4/27/2021 (BMO)
NeoGenomics, Inc. is a clinical laboratory company, which specializes in cancer genetics diagnostic testing and pharma services. It operates through the Clinical Services and Pharma Services segments. The Clinical Services segment offers cancer testing services to community-based pathologists, hospitals, academic centers, and oncology groups. The Pharma Services segment focuses on supporting pharmaceutical firms in drug development programs by supporting various clinical trials. The company was founded by Michael T. Dent on October 29, 1998 and is headquartered in Fort Myers, FL.
NEO is up +0.90% in after hours trading. The "V" bottom has been retraced halfway. Price made it above resistance and has remained there this week. The PMO is nearing a crossover BUY signal in very oversold territory. The RSI just moved into positive territory. Volume is coming in and increasing. Today it closed above the 50-EMA. The SCTR is flying up and despite the industry group not performing that well, this one is outperforming the SPX.
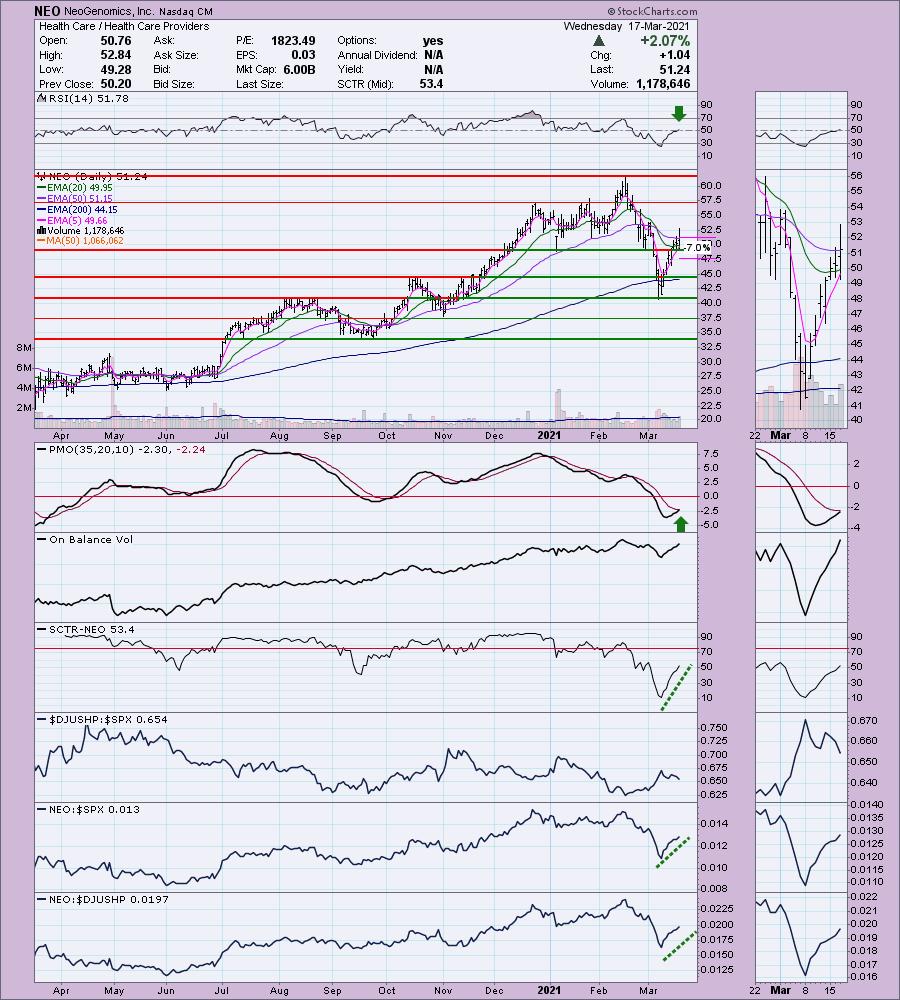
We have an OBV positive divergence and a newly positive RSI. The PMO is on an overbought SELL signal, but it does appear to be decelerating. If it can reach its 2021 high, that would be a nice 21% gain.
Full Disclosure: I'm about 70% invested and 30% is in 'cash', meaning in money markets and readily available to trade with. Nothing new to report.
Current Market Outlook:
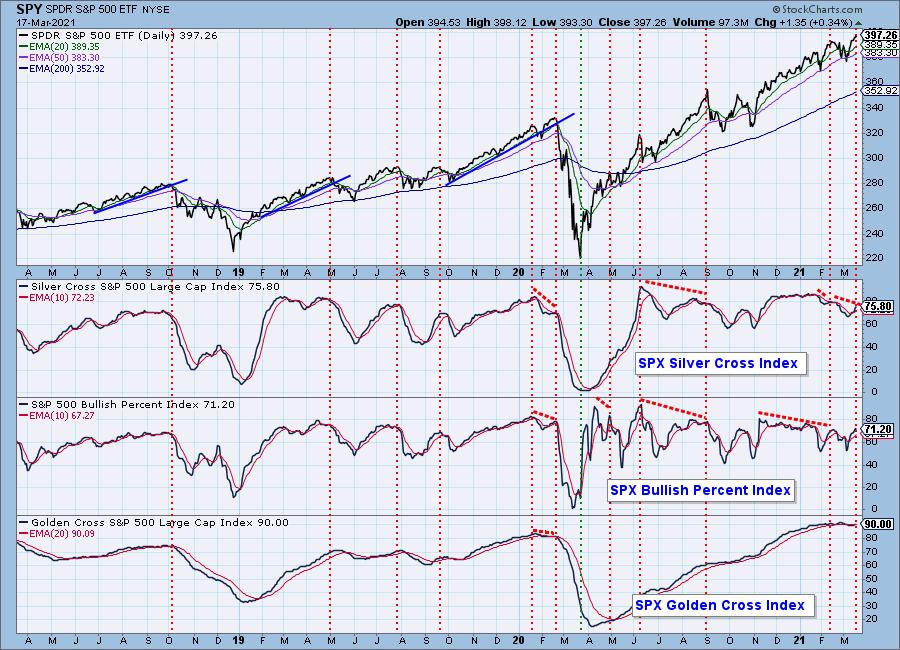
Market Environment: It is important to consider the odds for success by assessing the market tides. The following chart uses different methodologies for objectively showing the depth and trend of participation for intermediate- and long-term time frames.
- The Silver Cross Index (SCI) shows the percentage of SPX stocks on IT Trend Model BUY signals (20-EMA > 50-EMA)
- The Golden Cross Index (GCI) shows the percentage of SPX stocks on LT Trend Model BUY signals (50-EMA > 200-EMA)
- The Bullish Percent Index (BPI) shows the percentage of SPX stocks on Point & Figure BUY signals.
Don't forget that as a "Diamonds" member, you have access to our GCI/SCI curated ChartList on DecisionPoint.com. You'll find it under "Members Only" links on the left side on the Blogs and Links Page.
Here is the current chart:
Diamond Index:
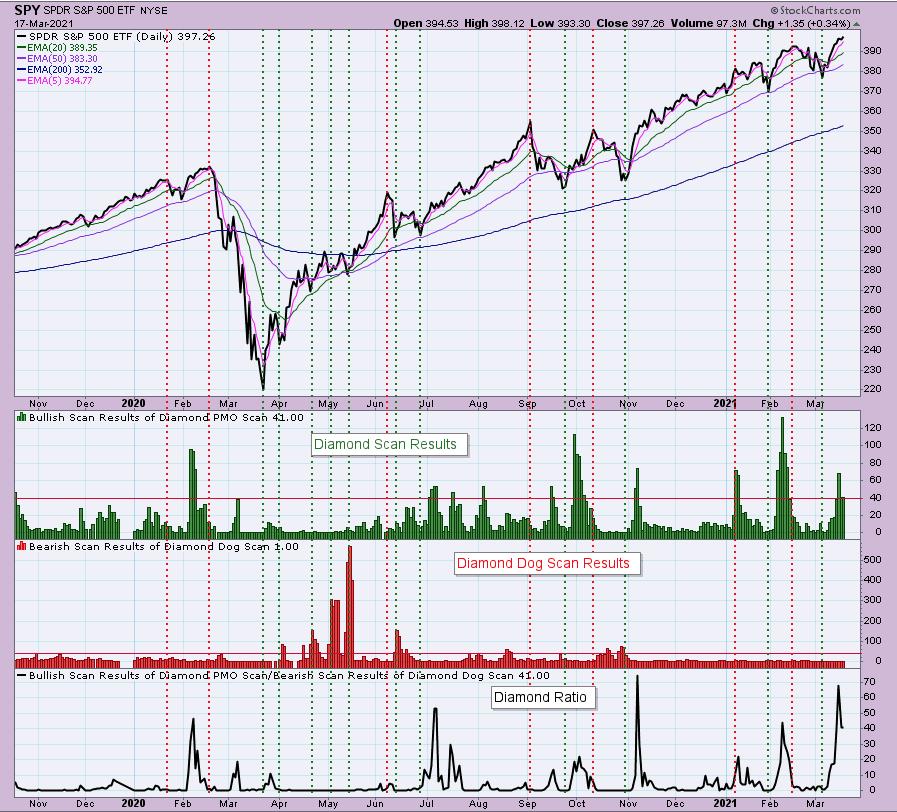
The Diamond Index chart looks at the number of scan results from my bullish Diamond PMO Scan and the number of scan results from the inverse Diamond Dog Scan. The Diamond Ratio divides the bullish results by the bearish results.
I only have data going back to October 2019 so I won't make any sweeping conclusions about the Diamond Index chart. I have marked cardinal tops with red dotted vertical lines and cardinal price bottoms with green dotted vertical lines. I believe that when the Diamond Dog results spike, it usually comes at a price bottom, or marks a strong continuation of the rising trend.
Unfortunately, the Diamond PMO Scan result numbers aren't providing much insight. The Diamond Ratio has promise, but again I don't see a clear correlation to the market tops/bottoms right now. I need to study and manipulate the data some more. Keep you posted!
Technical Analysis is a windsock, not a crystal ball.
Happy Charting!
- Erin
erin@decisionpoint.com
Watch the latest episode of DecisionPoint with Carl & Erin Swenlin on Mondays 7:00p EST or on the DecisionPoint playlist on the StockCharts TV YouTube channel here!
NOTE: The stocks reported herein are from mechanical trading model scans that are based upon moving average relationships, momentum and volume. DecisionPoint analysis is then applied to get five selections from the scans. The selections given should prompt readers to do a chart review using their own analysis process. This letter is not a call for a specific action to buy, sell or short any of the stocks provided. There are NO sure things or guaranteed returns on the daily selection of "diamonds in the rough."
Helpful DecisionPoint Links:
DecisionPoint Shared ChartList and DecisionPoint Chart Gallery
Price Momentum Oscillator (PMO)
Swenlin Trading Oscillators (STO-B and STO-V)
For more links, go to DecisionPoint.com!
