
I had a subscriber write me recently telling me that he considers Reader Request Day a weekly homework assignment. He takes time to follow his analysis process alongside mine to pick out his selections to send to me. Well, Fred, you got an A+ today. The three selections he shared are solid picks that you do need to review.
During today's recording of Chartwise Women, we took a look at where the pockets of strength are even in this downturning market. While I am personally not increasing my exposure to the market (in fact, another stop triggered for me today moving me to 65% exposed), there are stocks out there that are bucking the trend. Depending on your risk appetite, we are seeing some strong stock choices.
One area I am noticing improvement is in Biotechs. The Diamond PMO scan only returned six results and three of them were Biotechs prior to recording Chartwise Women. Healthcare is considered a more defensive sector, but Biotechs are not. You have to handle these with care, i.e. timing your entry carefully, setting stops and sticking to them. The other area to consider is international ETFs. Two I like are EWS and EWG.
Next week do some homework and see if you can get an "A" on Reader Request Thursday.
Time to register for the tomorrow's Diamond Mine! I will resend the join information to REGISTRANTS 15-30 minutes prior to the Noon ET start. Here is the link.
Quick reminder that I will not be writing Diamonds next week, but an extension to your subscription will be applied. The Diamond Mine will be open! The new link will be published in tomorrow's Recap and I will email it out again the Thursday before (3/26).
Today's "Diamonds in the Rough" are: DDS, SI, SIEGY, SWK and UTHR.
** Everyone needs a vacation and I am no exception. I've planned a mini vacation to local wine country mid-week 3/23 through 3/25. The DecisionPoint Alert will be published, but I'll be taking the week off for Diamonds with the exception of the 3/26 Diamond Mine. I need to fit wine tasting in somehow! To compensate you for that week, I am adding a week to the end of all Diamond and Bundle subscribers' terms when I return, because who knows, I may end up writing a report or two. **
 Diamond Mine REGISTRATION Information:
When: Mar 19, 2021 09:00 AM Pacific Time (US and Canada)
Topic: DecisionPoint Diamond Mine (3/19/2021) LIVE Trading Room
Register in advance for this webinar HERE.
After registering, you will receive a confirmation email containing information about joining the webinar, including the password.
=======================================================================
Diamond Mine RECORDING Link from 3/12/2021:
Topic: DecisionPoint Diamond Mine (03/12/2021) LIVE Trading Room
Start Time : Mar 12, 2021 09:00 AM
Access Passcode: &hJ8Vv^P
***Click here to register for this recurring free DecisionPoint Trading Room on Mondays at Noon ET!***
+++++++++++++++++++++++++++++++++++++++++++++++++++++++++++++++++++++++++++++++
Free DP Trading Room RECORDING LINK:
Topic: DecisionPoint Trading Room
Start Time : Mar 15, 2021 08:58 AM
Free DP Trading Room Recording Link.
Access Passcode: 0f$2Pf5z
For best results, copy and paste the access code to avoid typos.
Welcome to DecisionPoint Daily Diamonds, wherein I highlight five "diamonds in the rough." These are selected from the results of my DecisionPoint scans, which search for stocks that could benefit from the trend and condition of the market. Remember, these are not recommendations to buy or sell, but are the most interesting of the stocks that surfaced in my scans. My objective is to save you the work of the initial, tedious culling process, but you need to apply your own analysis to see if these stocks pique your interest as well. There are no guaranteed winners here!
Dillards Inc (DDS)
EARNINGS: 5/13/2021 (AMC)
Dillard's, Inc. engages in the retail of fashion apparel, cosmetics, and home furnishings. It operates through the Retail Operations and Construction segments. The Retail Operations segment comprises sells cosmetics, ladies' apparel, ladies' accessories and lingerie, juniors' and children's apparel, men's apparel and accessories, shoes, and home and furniture products. The Construction segment constructs and remodels stores through CDI Contractors, LLC. The company was founded by William T. Dillard in 1938 and is headquartered in Little Rock, AR.
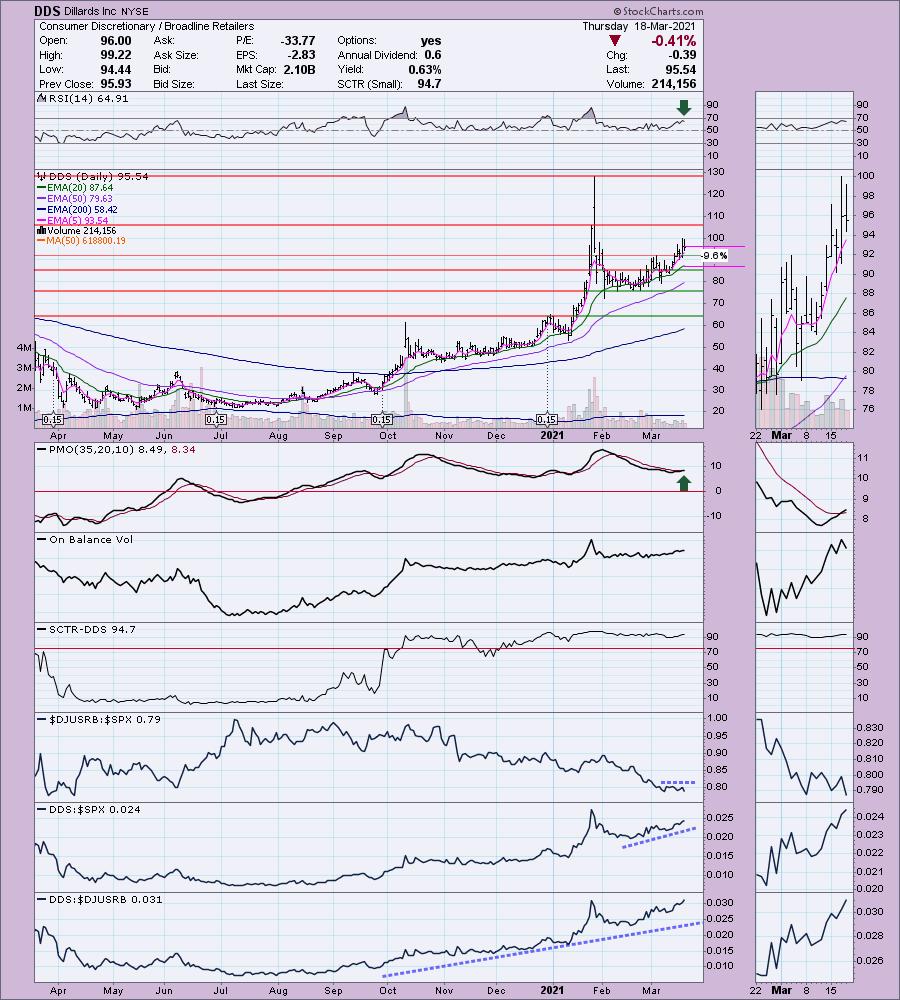
DDS is unchanged in after hours trading. Excellent choice, Fred. DDS has just triggered a PMO crossover BUY signal. The RSI is positive and not overbought. Even though this industry group has been underperforming since the beginning of February, this stock has been a solid winner. The SCTR is excellent. Overhead resistance is nearing at about $107. You could set a deeper stop at about 11%+, but my preference is to set it around the 20-EMA.
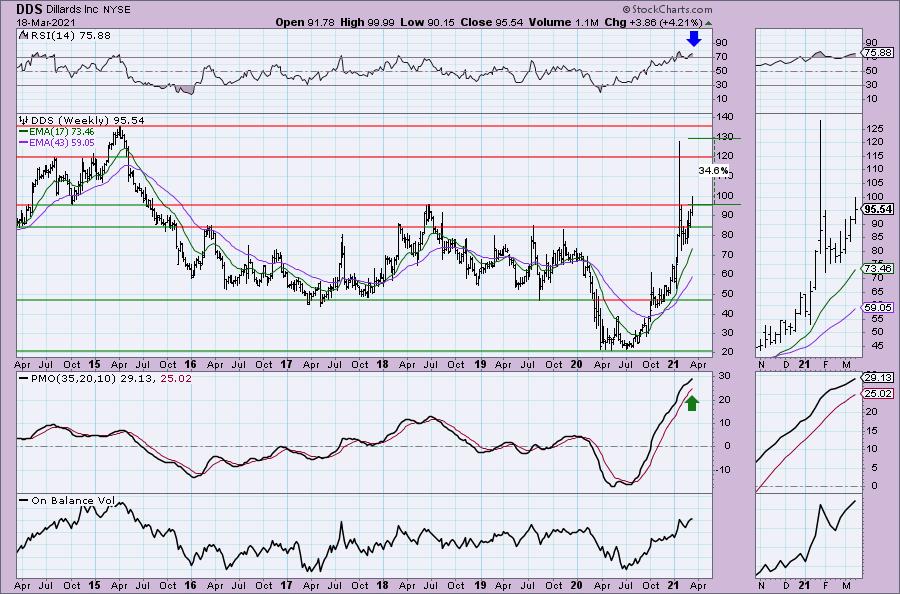
The weekly PMO is rising strongly, albeit overbought. The RSI is also overbought. However, this chart is quite favorable given the breakout that is occurring above the 2018 top. If price can reach the intraday high this year, that would be a today 34%+ gain.
Silvergate Capital Corp (SI)
EARNINGS: 4/21/2021 (AMC)
Silvergate Capital Corp. is a holding company, which engages in the provision of banking and loan services. It focuses on the financial infrastructure solutions and services for participants in the nascent and digital currency industry. The company was founded in 1988 and is headquartered in La Jolla, CA.
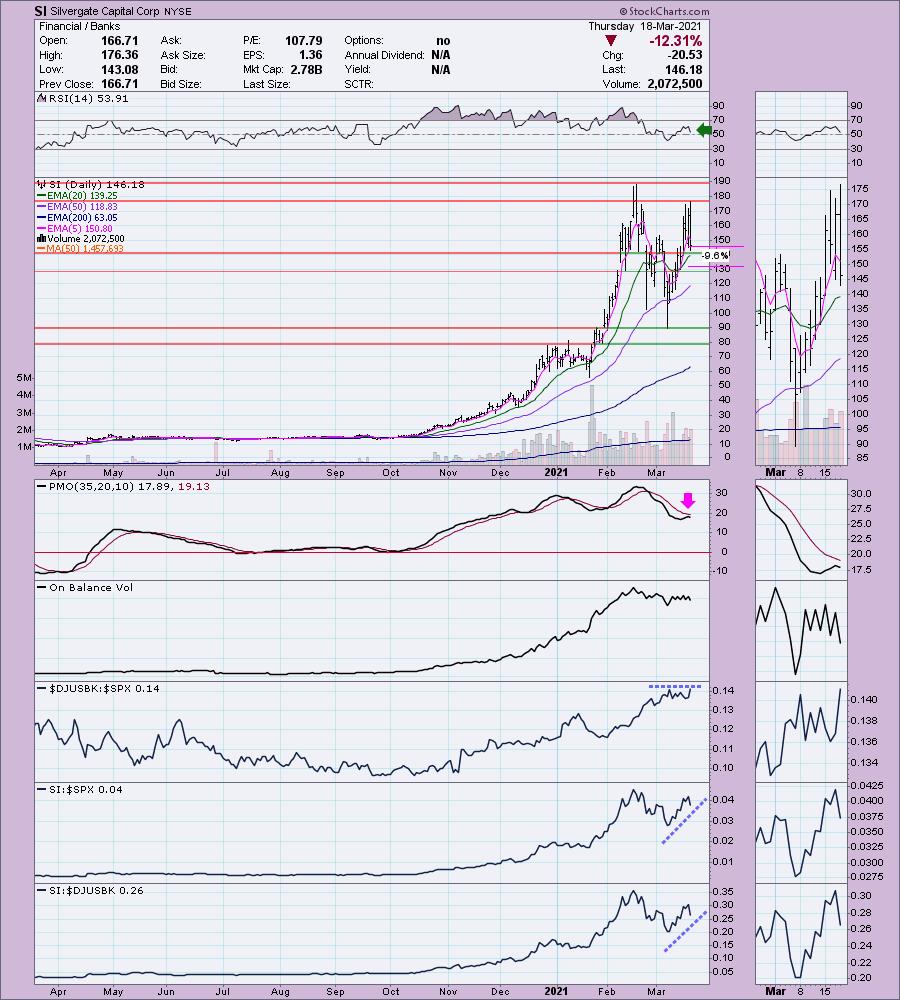
SI is up +1.94% in after hours trading. This is from Richard. I thought it was something interesting to look at given Banks continue to outperform. I discussed Bank stocks back on February 9th. They're up about 15% since. This one is highly volatile. I don't know the back story, but technically it is interesting. Banks are now performing about as well as the SPX. This one has outperformed both. At issue is its volatility. It is holding above the 20-EMA and Banks have begun to outperform again this week. The RSI is positive. The PMO has turned down below its signal line, but given today's crash, I would expect nothing less. It's not my cup of tea, but if you are in or plan to be, set a stop around $130.
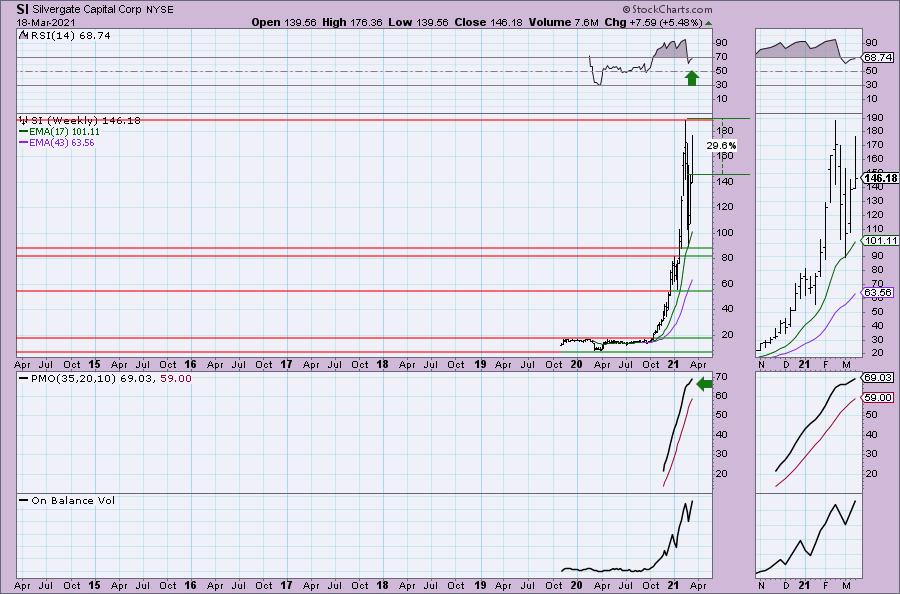
The weekly chart doesn't reveal much information, but the RSI did move out of overbought territory on the recent pullback. The PMO is rising and the OBV does appear to be confirming to some degree.
Siemens AG (SIEGY)
EARNINGS: 5/7/2021
Siemens AG engages in the production and supply of systems for power generation, power transmission, and medical diagnosis. It operates through the following segments: Power & Gas, Energy Management, Building Technologies, Mobility, Digital Factory, Process Industries & Drives, Siemens Healthcare and Financial Services. The Power and Gas segment offers gas turbines, steam turbines, generators, compressors, power plant solutions, and power and process automation. The Energy Management segment covers high voltage products, low voltage power distribution, power transmission, smart grid solutions and services, transformers, medium voltage switchgear and devices, and energy automation. The Building Technologies segment comprises of automation technologies and services for commercial, industrial, and public buildings and infrastructures. The Mobility segment consists of passenger and freight transportation systems and solutions such as Siemens mobility, green mobility, mobility services, and road and rail solutions. The Digital Factory segment contains solutions such as automation systems, industrial controls, industrial communication, power supplies, electronic car powertrain systems, industry services, industry software, personal computer based automation, motion control, online support, and operator control and monitoring systems. The Process Industries and Drives segment offers standard and customized products, systems, solutions, and services to industry sectors. The Siemens Healthcare segment supplies products in medical imaging, laboratory diagnostics, and information technology solutions to healthcare industry. The Financial Services segment provides business to business financial solutions such as commercial finance, insurance, asset management, project and structured finance, venture capital, and treasury. The company was founded by Johann Georg Halske and Werner von Siemens on October 12, 1847 and is headquartered in Munich, Germany.
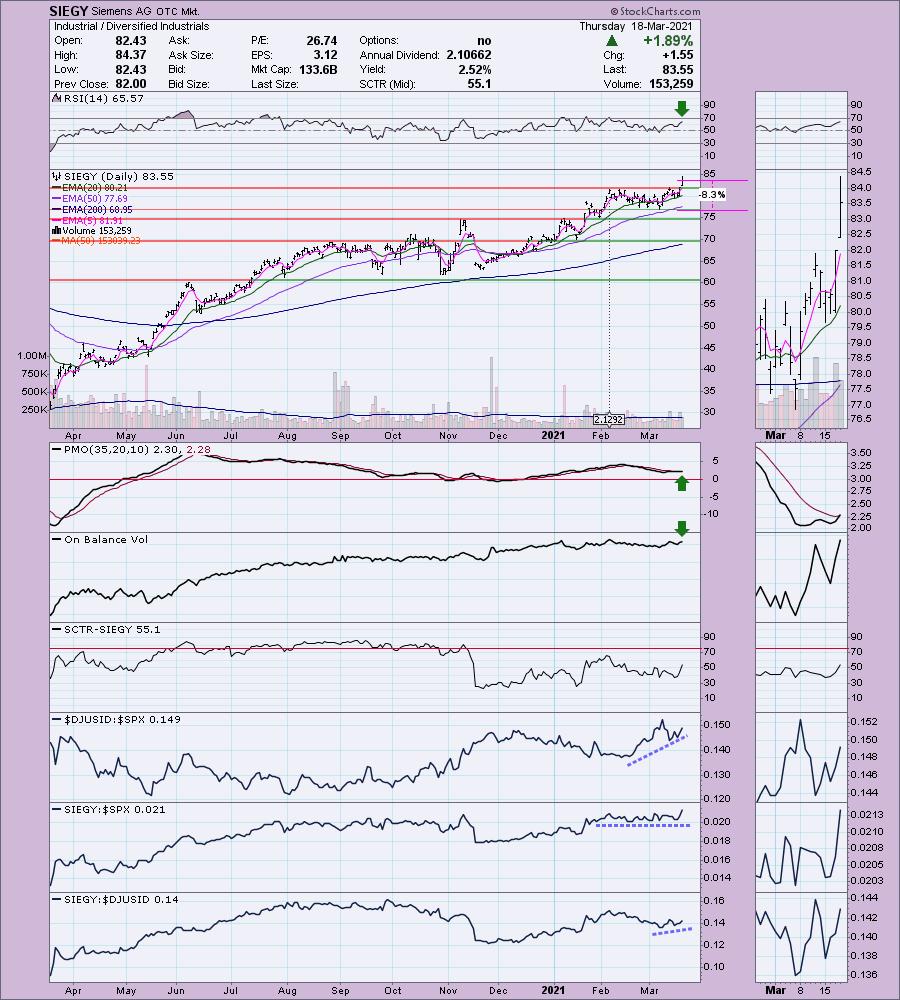
SIEGY is up +0.19% in after hours trading. Another great pick, Fred. Beautiful breakout today coming alongside a PMO crossover BUY signal. The RSI is positive and the OBV did move to a higher high on the breakout. The SCTR is mid-range, but is has broken its declining trend. It's beginning to outperform this week. The stop is reasonable at the March low.
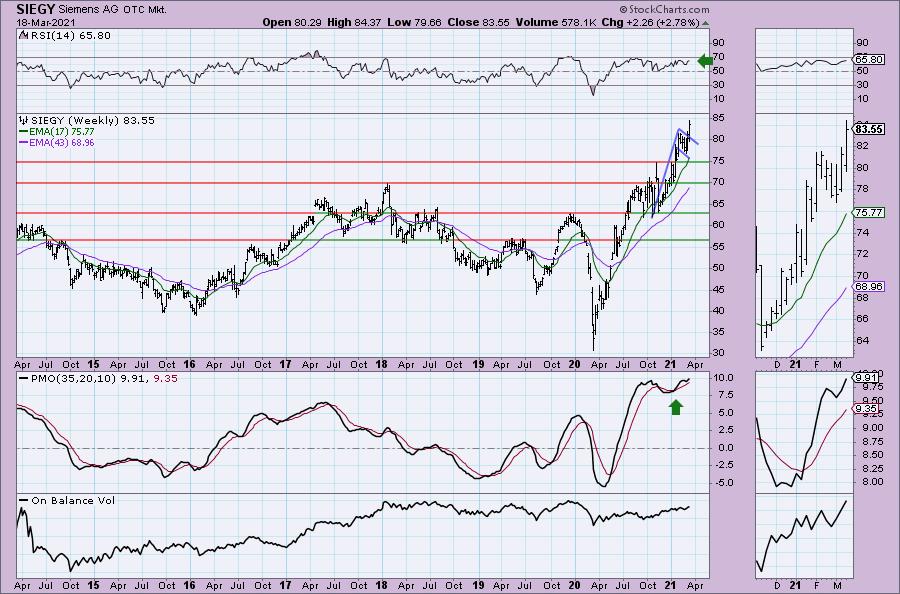
Even the weekly chart looks good. We have a PMO bottom above the signal line which I always consider especially bullish. The PMO is overbought, but the RSI is not. It looks like a bullish flag formation, one that price is executing this week with the strong breakout. There is a negative divergence on the OBV when looking from the 2019 top to now, but overall the OBV has been confirming this rally by rising steadily.
Don't forget, on Thursdays I look at reader-requested symbols, so shoot me an email at erin@decisionpoint.com. I read every email I receive and try to answer them all!
Stanley Black & Decker Inc. (SWK)
EARNINGS: 4/29/2021 (BMO)
Stanley Black & Decker, Inc. engages in the provision of power and hand tools, and related accessories, products, services and equipment for oil & gas and infrastructure applications, commercial electronic security and monitoring systems, healthcare solutions, and mechanical access solutions. It operates through the following three segments: Tools and Storage, Industrial, and Security. The Tools and Storage segment comprises of the power tools and equipment, and hand tools, accessories, and storage businesses. The Industrial segment comprises of engineered fastening and infrastructure businesses. The Security segment includes the convergent security solutions and mechanical access solutions businesses. The company was founded by Frederick T. Stanley in 1843 and is headquartered in New Britain, CT.
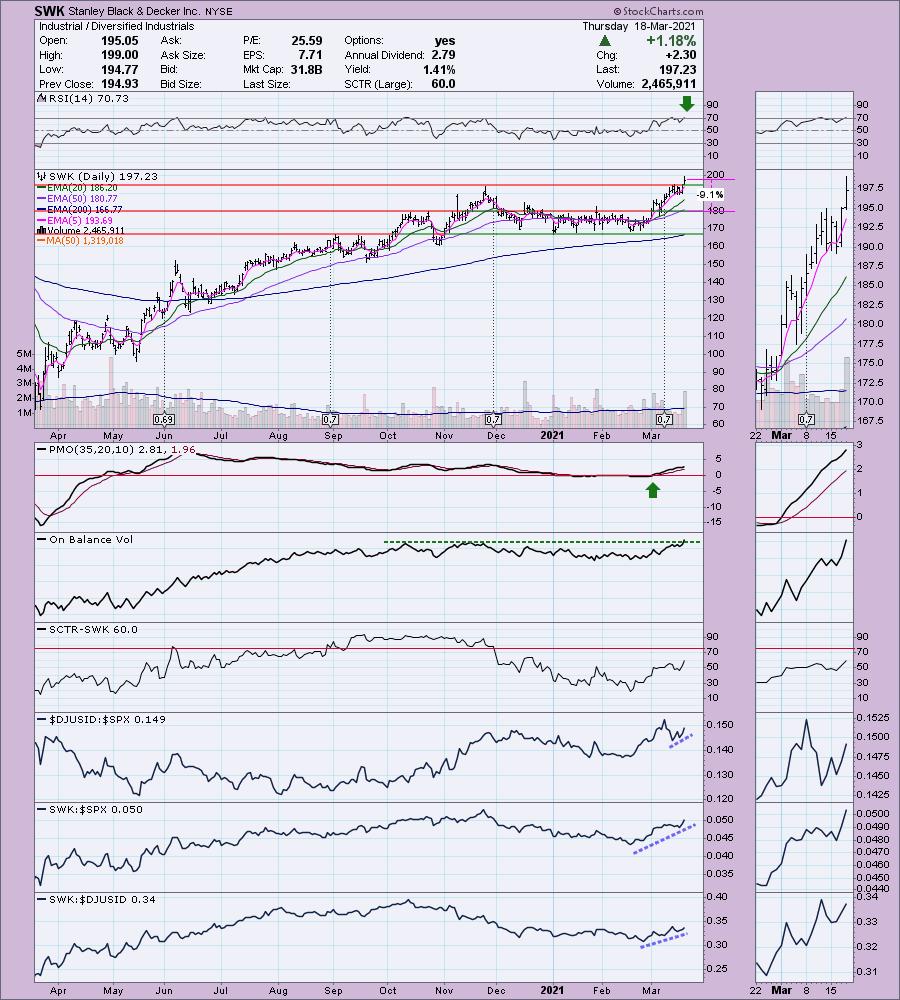
SWK is unchanged in after hours trading. Another choice by Fred. Lots of good things on this chart, but let's start with the one "negative". The RSI is overbought. Other than that, the rest is excellent. Today SWK broke out on volume. This pushed the OBV to its own breakout. The SCTR is rising nicely, heading toward the "hot zone" above 75. The PMO is on a BUY signal. It is beginning to accelerate higher and it is far from being overbought. It is outperforming an industry group that is already kicking into high gear against the SPX and it has been tearing it up on its own against both the group and the SPX. The stop is very reasonable at 9%.
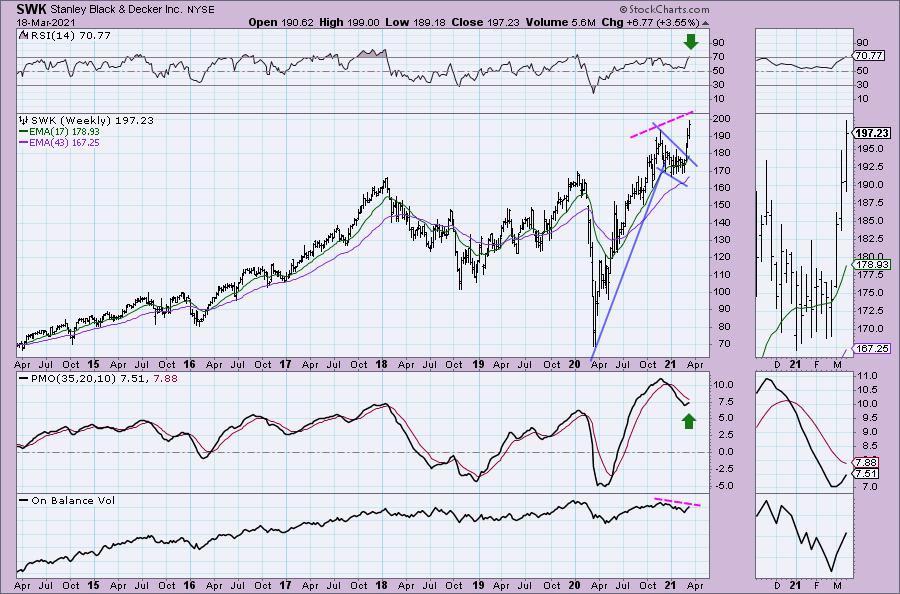
It is a strong weekly chart based on the PMO bottom and the bull flag. Price has already broken out of the flag or falling wedge and given that very large flagpole, there is plenty of upside potential here. At issue would be the now overbought RSI. Looking back, SWK doesn't like an overbought RSI. However, we have seen it sustain overbought conditions when it is in a strong rising trend. The OBV is a problem as it has a negative divergence with price tops. Still a great pick.
United Therapeutics Corp. (UTHR)
EARNINGS: 4/28/2021 (BMO)
United Therapeutics Corp. operates as a biotechnology company, which engages in the development and commercialization of products for patients with chronic and life-threatening diseases. The firm markets and sells commercial therapies to treat pulmonary arterial hypertension and high-risk neuroblastoma. It also involves in the research and development of new indications and delivery devices for its product and for the organ transplantation-related technologies. The company was founded by Martine A. Rothblatt on June 26, 1996 and is headquartered in Silver Spring, MD.
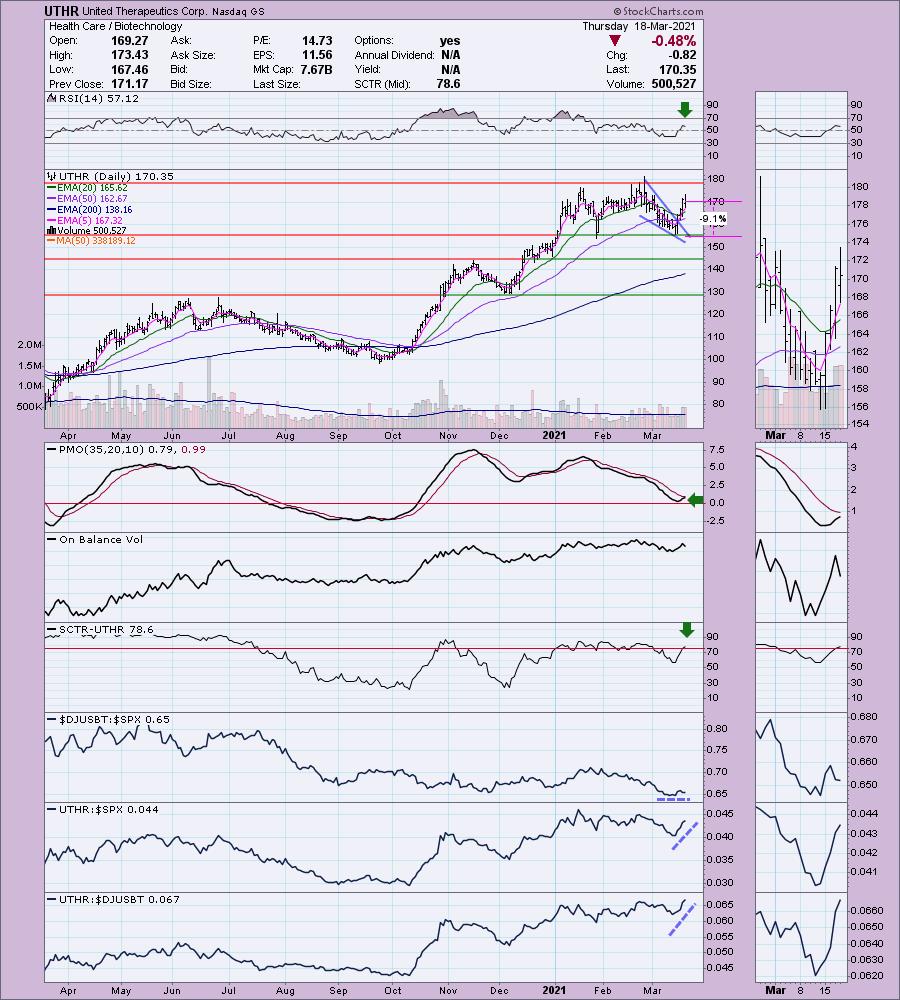
UTHR is unchanged in after hours trading. This is one of the Biotechs that hit my Diamond PMO Scan results. The group began to see some outperformance starting last week, but overall it is competing equally with the SPX. The stock itself is outperforming. The recent breakout from the bullish falling wedge occurred this week. The 5-EMA just crossed the 20-EMA giving UTHR a ST Trend Model BUY signal. The RSI is positive. Despite today's decline, the PMO is still rising nicely and is headed for a crossover BUY signal. The SCTR has just entered the "hot zone" above 75. I set the stop at this month's low.
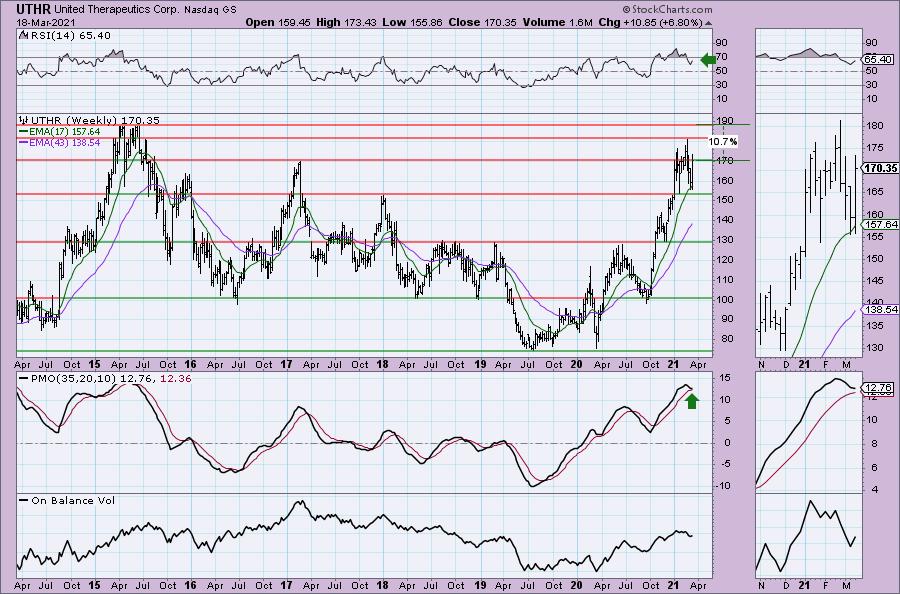
The weekly chart is interesting. There is a positive RSI and we've seen support hold at the 2018 high. The PMO at first glance doesn't look so great, but it has decelerated and could turn up after the close tomorrow. It is a Biotech, so again, proceed with caution.
Full Disclosure: I'm about 65% invested and 35% is in 'cash', meaning in money markets and readily available to trade with. My stop was triggered on CNS today.
Current Market Outlook:
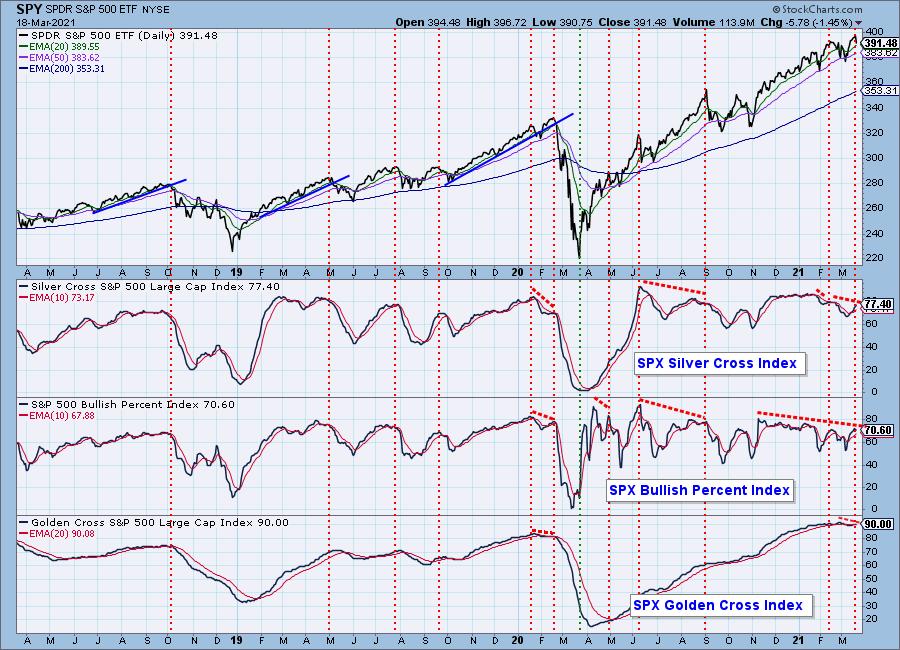
Market Environment: It is important to consider the odds for success by assessing the market tides. The following chart uses different methodologies for objectively showing the depth and trend of participation for intermediate- and long-term time frames.
- The Silver Cross Index (SCI) shows the percentage of SPX stocks on IT Trend Model BUY signals (20-EMA > 50-EMA)
- The Golden Cross Index (GCI) shows the percentage of SPX stocks on LT Trend Model BUY signals (50-EMA > 200-EMA)
- The Bullish Percent Index (BPI) shows the percentage of SPX stocks on Point & Figure BUY signals.
Don't forget that as a "Diamonds" member, you have access to our GCI/SCI curated ChartList on DecisionPoint.com. You'll find it under "Members Only" links on the left side on the Blogs and Links Page.
Here is the current chart:
Diamond Index:
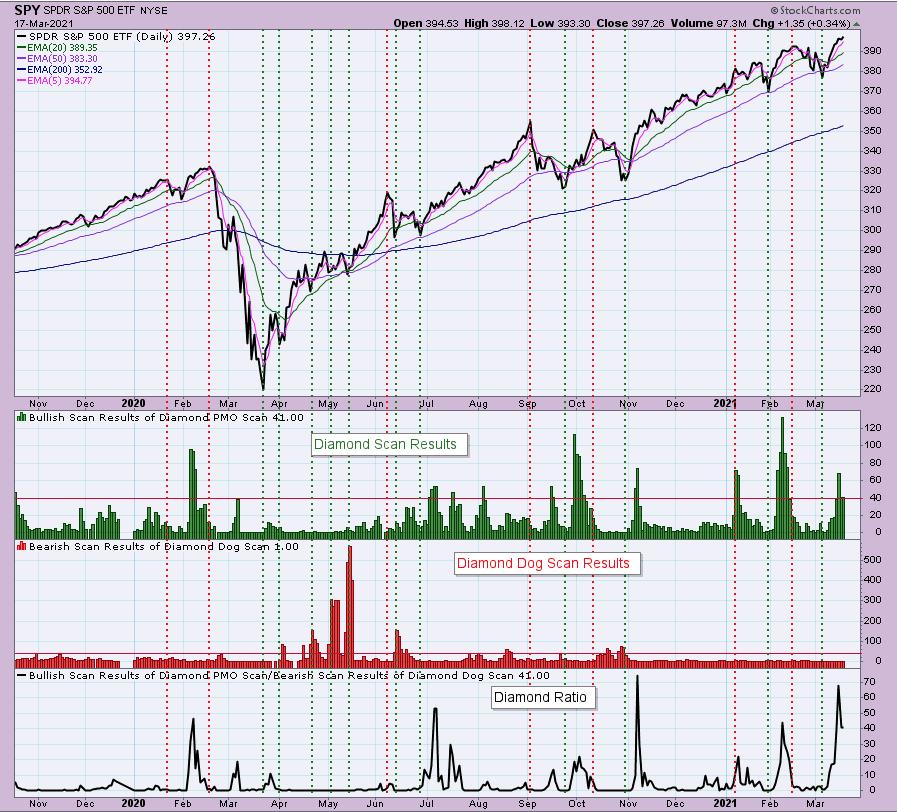
The Diamond Index chart looks at the number of scan results from my bullish Diamond PMO Scan and the number of scan results from the inverse Diamond Dog Scan. The Diamond Ratio divides the bullish results by the bearish results.
I only have data going back to October 2019 so I won't make any sweeping conclusions about the Diamond Index chart. I have marked cardinal tops with red dotted vertical lines and cardinal price bottoms with green dotted vertical lines. I believe that when the Diamond Dog results spike, it usually comes at a price bottom, or marks a strong continuation of the rising trend.
Unfortunately, the Diamond PMO Scan result numbers aren't providing much insight. The Diamond Ratio has promise, but again I don't see a clear correlation to the market tops/bottoms right now. I need to study and manipulate the data some more. Keep you posted!
Technical Analysis is a windsock, not a crystal ball.
Happy Charting!
- Erin
erin@decisionpoint.com
Watch the latest episode of DecisionPoint with Carl & Erin Swenlin on Mondays 7:00p EST or on the DecisionPoint playlist on the StockCharts TV YouTube channel here!
NOTE: The stocks reported herein are from mechanical trading model scans that are based upon moving average relationships, momentum and volume. DecisionPoint analysis is then applied to get five selections from the scans. The selections given should prompt readers to do a chart review using their own analysis process. This letter is not a call for a specific action to buy, sell or short any of the stocks provided. There are NO sure things or guaranteed returns on the daily selection of "diamonds in the rough."
Helpful DecisionPoint Links:
DecisionPoint Shared ChartList and DecisionPoint Chart Gallery
Price Momentum Oscillator (PMO)
Swenlin Trading Oscillators (STO-B and STO-V)
For more links, go to DecisionPoint.com!
