Last week I was trumpeting our big winner with a big 6%+ gain. Well this week, our biggest gainer was up 27.51%! The biggest loser this week was down -2.08% which is pretty good and that was on a reader request from yesterday. My biggest loser this week was down -1.65% on a stock that of course, I bought. Not the 27% gainer...no, my worst pick for the week. It happens to the best of us.
Let's dig in. Home Builders definitely carried the week and I believe they still have room to move higher, although they are admittedly due for a pause or pullback after the big gains on the week. On Thursday I presented LGIH, another Home Builder, as a possible "beat down" Home Builder that looked ready to continue a new breakout. It still looks good.
I noticed that some of our regular Diamond Mine attendees had trouble getting into the room today. I've decided my best course of action is to email the "join" information right before the trading room. I'm only going to send it to those who REGISTERED, so make sure you register early. The registration link for next week's Diamond Mine and the password are below.
I'm going to include 5, 15 and 30-minute chart examples at the end of this report. If you want to save the settings for your own StockCharts account, simply click on the formatted chart you want and it will bring it up on your StockCharts workbench. Save the "ChartStyle" as your own and you will always have it available when you trade or for analysis. I suggested that day traders might want to use these timeframe charts to help with their day-to-day trades.
Another reminder that you can always find links to recordings and webinar registrations in the latest DP Diamonds or DP Alert reports. I only save the last two Diamond Mine recordings, so even if you don't have time to watch the latest, you may want to go to the recording and download it to your computer for future viewing.
 Diamond Mine Information:
Here is today's (1/22/2021) recording link. Access Passcode: 9W%Y..HU
===============================================================================
Register in advance for the next "DecisionPoint Diamond Mine" trading room on FRIDAY (1/29/2021) 12:00p ET:
Here is the Registration Link & Entry Password: diamonds
Please do not share these links! They are for Diamonds subscribers ONLY!
Save the registration confirmation email with login instructions in case Zoom doesn't notify you in time. I will send out the link to join right before the webinar to REGISTERED attendees. Register early.
A few items about the spreadsheet: I decided it only fair to denote "reader requests" as I shouldn't get to take credit if they turn out great! I've put on the spreadsheet whether the RSI is positive (green) or negative (red). The PMO column tells you if it is rising (green) or falling (red). Finally I've added my own "Sparkle Factor" that gives you my assessment going forward, bullish (green), bearish (red) or neutral (gray). The Sparkle Factor is basically my thoughts on whether I expect it to rise or fall. A neutral means it could really go either way so it could be added to a watch list. If you're in a stock I consider "neutral" going forward, the ball is in your court.


It's Free!
 Mark Young, CMT of WallStreetSentiment.com will be joining me in the free trading room on February 1st! He has all the latest sentiment data and will give his opinion on your symbol requests too!
"Investor sentiment is one of the most powerful forces in the stock market. It can make the difference between selling out at a market low and buying there." -- Mark Young, CMT
***Click here to register for this recurring free DecisionPoint Trading Room on Mondays at Noon ET!***
We didn't hold a 1/18 Trading Room. Did you miss the 1/11 trading room? Here is a linkto the recording -- access code: ?H++t+d5
For best results, copy and paste the access code to avoid typos.
Darling:
Beazer Homes USA, Inc. (BZH)
EARNINGS: 1/28/2021 (AMC)
Beazer Homes USA, Inc. engages in the design and sale of single-family and multi-family homes. It operates through the following geographical segments: West, East, and Southeast. The West segment includes Arizona, California, Nevada, and Texas. The East segment consists of Delaware, Indiana, Maryland, Tennessee, and Virginia. The Southeast segment includes Florida, Georgia, North Carolina, and South Carolina. The company was founded in 1993 and is headquartered in Atlanta, GA.
Below is the chart and commentary from Tuesday 1/19:
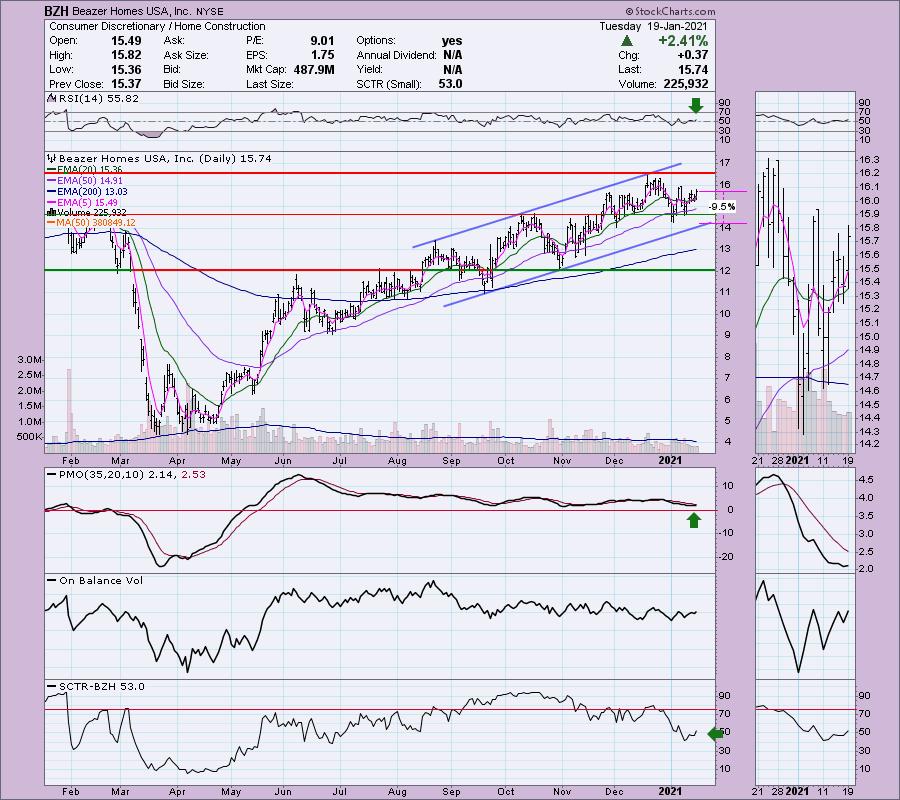
"BZH is unchanged in after hours trading. It's been in a solid rising trend for many months. The PMO has just turned up on this recent rally. The RSI is neutral to positive. You could make a case for a short-term double-bottom. Price would execute the pattern with a rally above the recent high near $16. The OBV is confirming the very short-term rising trend. The SCTR is not in the hot zone, but it is improving. I set the stop below the double-bottom."

Here is today's chart:
BZH exploded on Wednesday along with many other Home Builders. I still like that industry group, but it now is due for a pause or pullback. Be sure and look at LGIH from Thursday. It has only begun its breakout move and might offer more upside. However, as we all know, many times winners just keep on winning. Watch for a pullback to the 5-EMA as a possible entry point if you're still interested. I'm worried that most of the move has happened, so I'm not sure that I will pick this or another Home Builder up, although I sure am tempted by LGIH. It's only fair I give you LGIH's current chart, so I've added it below BZH.


Don't forget, on Thursdays I look at reader-requested symbols, so shoot me an email at erin@decisionpoint.com. I read every email I receive and try to answer them all!
Dud:
Ball Corp. (BLL)
EARNINGS: 2/4/2021 (BMO)
Ball Corp. provides metal packaging for beverages, foods and household products. It operates through the following business segments: Beverage Packaging, North and Central America; Beverage Packaging, South America; Beverage Packaging, Europe; and Aerospace. The Beverage Packaging, North and Central America segment sold under multi-year supply contracts to fillers of carbonated soft drinks, beer, energy drinks and other beverages. The Beverage Packaging, South America segment sales volumes of beverage containers in South America, and manufacture substantially all of the metal beverage containers in Brazil. The Beverage Packaging, Europe segment sales volumes of metal beverage containers in Europe, and other packaging materials used by the European beer and carbonated soft drink industries. The Aerospace segment provides diversified technical services and products to government agencies, prime contractors and commercial organizations for a broad range of information warfare, electronic warfare, avionics, intelligence, training and space system needs. The company was founded by Edmund Burke Ball, Frank Clayton Ball, George A. Ball, Lucius Lorenzo Ball and William Charles Ball in 1880 and is headquartered in Westminster, CO.
Below is my commentary and the chart from Wednesday:
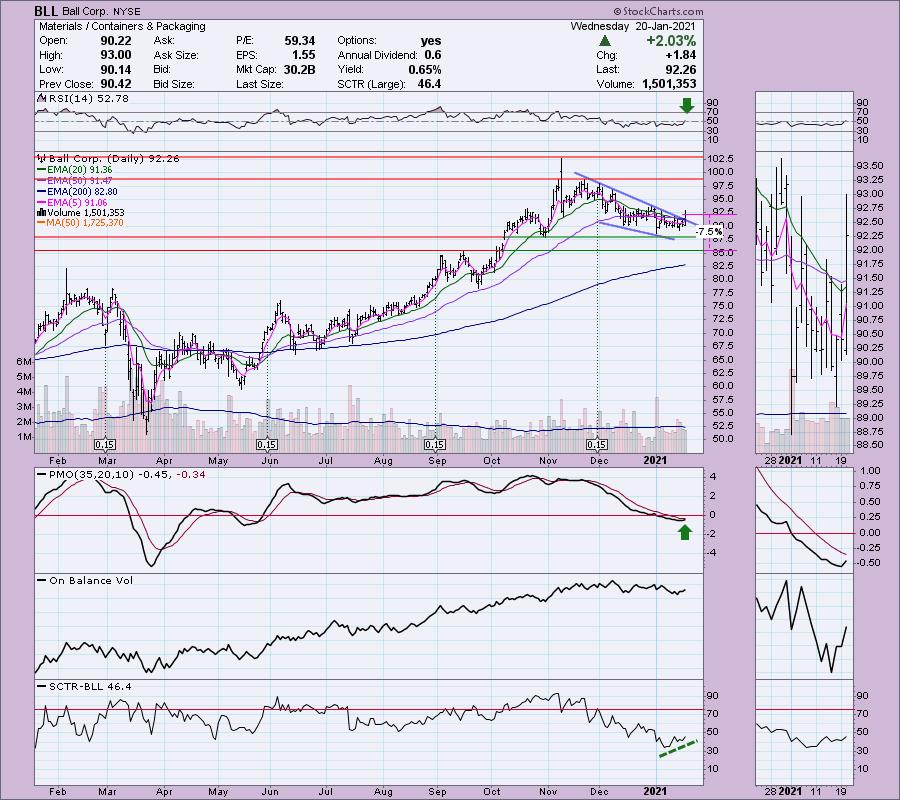
"BLL is down -0.17% in after hours trading. I covered it back on March 6th 2020. Obviously, it hit the 8.7% stop. However, it currently is up 19.8% since I presented it as a reader request back then. Today's chart is very bullish. The RSI just hit positive territory and the PMO has just turned up. The bullish falling wedge was confirmed today with the strong breakout. It wasn't a "decisive" breakout (3%+), but the technicals are very favorable for a continuation."

Below is today's chart:
As noted in the intro, I bought BLL. The trade has gone south as the RSI failed to stay in positive territory and the PMO has turned down below its signal line. I have a tight stop at $88.50. I wouldn't suggest jumping in with me as I am fairly confident that stop will be hit.

THIS WEEK's Sector Performance:

Click Here to view Carl's annotated Sector ChartList!
CONCLUSION:
Communication Services (XLC) and Technology (XLK) were the big winners this week. Stocks like Apple (AAPL) are starting to look very interesting, but just remember AAPL and other big name large-cap technology stocks generally push market direction. The overall market is looking soft, so rather than pursue Technology stocks, I'm going to be watching Comm Services (XLC).
Sector to Watch: I recommend you take a look at the DP Sector ChartList on the website. The link is in the upper left-hand corner of the Blogs and Links page, but here is a direct link as well. XLC just triggered a PMO BUY signal. Price is pausing after a big gap up and holding new support at $67.50. The underlying indicators look good. The OBV broke out with price. The SCI just had a positive crossover and the BPI also had a positive crossover. The participation readings aren't particular overbought and show that most of the components are healthy with price above the 20/50-EMAs. Finally, the GCI is on a rising trend. The main problem is a very overbought GCI, but we know that condition can persist.

Industry Group to Watch: Internet ($DJUSNS)
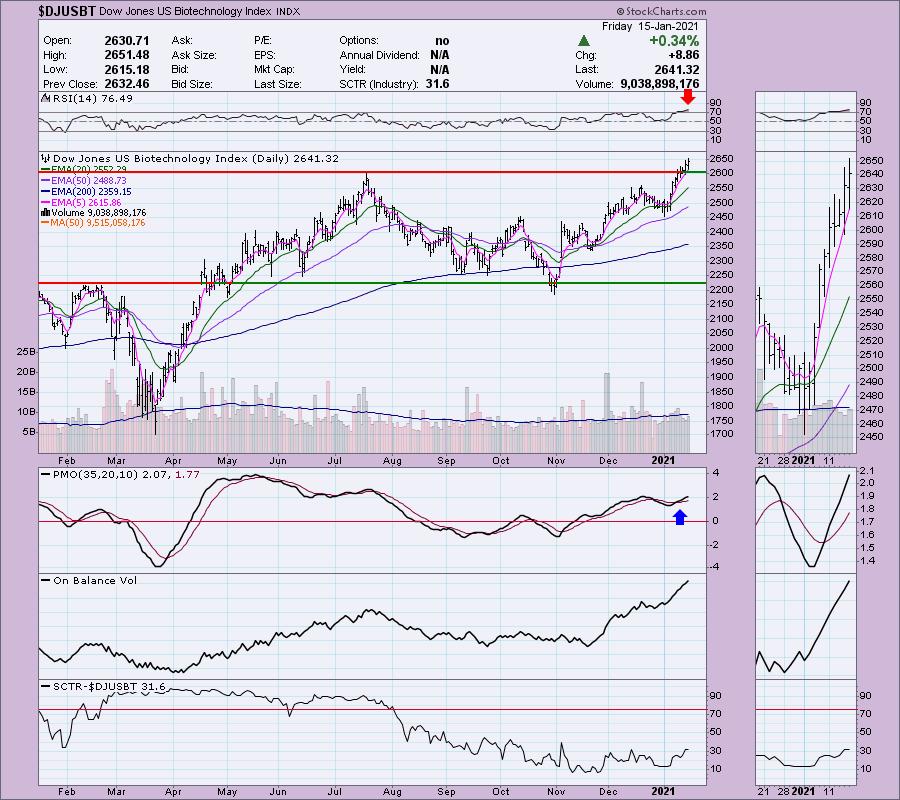
If you do like I just did and look at the charts of the industry groups within XLC, you'll see that this industry group is carrying the sector. This is where we see outperformance and where we should look within our scan results next week. The PMO is rising and not overbought. The RSI is definitely overbought, but support is right here and a pause would clear this condition.

Go to our Sector ChartList on DecisionPoint.com to get an in depth view of all the sectors.
As promised here are the sample 5-, 15- and 30-minute candlestick ChartStyles on a few that look interesting. Remember, just click on them and save the "ChartStyle". I pulled these Internet stocks from my Bullish EMA - Mid-Range SCTR scan. I am not suggesting them as "diamonds in the rough". Mainly, they are examples for you.
5- Minute Candlestick:

15-Minute Candlestick:

30-Minute Candlestick:

Technical Analysis is a windsock, not a crystal ball.
Have a great weekend!
Happy Charting!
- Erin
erin@decisionpoint.com
Full Disclosure: I'm about 85% invested right now and 15% is in 'cash', meaning in money markets and readily available to trade with. I have tightened a few stops and added large trailing stops on my solar stocks. The market is soft and when we see a pullback, I suspect we will correct 8% to 10%, so prepare. If that doesn't materialize next week, your positions should remain active with the right stops. "Right" meaning they are set near a clear support level or an EMA.
Watch the latest episode of DecisionPoint with Carl & Erin Swenlin on Mondays 7:00p EST or on the DecisionPoint playlist on the StockCharts TV YouTube channel here!
NOTE: The stocks reported herein are from mechanical trading model scans that are based upon moving average relationships, momentum and volume. DecisionPoint analysis is then applied to get five selections from the scans. The selections given should prompt readers to do a chart review using their own analysis process. This letter is not a call for a specific action to buy, sell or short any of the stocks provided. There are NO sure things or guaranteed returns on the daily selection of "diamonds in the rough."
Helpful DecisionPoint Links:
DecisionPoint Shared ChartList and DecisionPoint Chart Gallery
Price Momentum Oscillator (PMO)
Swenlin Trading Oscillators (STO-B and STO-V)
For more links, go to DecisionPoint.com!