
Yesterday I showcased Home Builders. Apparently just in time for today's big rally. Today I'm highlighting an area of Materials that I suspect many of you have been watching and biding your time for an entry. And... it isn't about Gold or Miners.
I have been watching the Lithium ETF (LIT) for some time, basically hoping for some kind of pullback. Lithium is the obvious partner play to Renewable Energy or even electric vehicle manufacturers like Tesla. Today's giant pullback on one of these stocks in particular, offers an excellent entry.
A bit of news... I was quoted on the Kiplinger website today! Here's a link to that article.
Quick reminder: If you don't get the email when I publish a blog, you'll always find all of our articles on the Blogs and Links page on the website. Trading room and Diamond Mine registration and recording links are in every report.
Today's "Diamonds in the Rough" are: BLL, LAC, LIT, PLL and TECK.
 Diamond Mine Information:
Here is the 1/15/2021 recording link. Access Passcode: mp+.Uj4q
===============================================================================
Register in advance for the next "DecisionPoint Diamond Mine" trading room on FRIDAY (1/22/2021) 12:00p ET:
Here is the Registration Link & Entry Password: poppy
Please do not share these links! They are for Diamonds subscribers ONLY!
Save the registration confirmation email with login instructions in case Zoom doesn't notify you in time.

It's Free!
***Click here to register for this recurring free DecisionPoint Trading Room on Mondays at Noon ET!***
There was no Trading Room on Monday January 18th due to the holiday.
Did you miss the 1/11/2021 free trading room? Here is a link to the recording. Access Code: ?H++t+d5
For best results, copy and paste the access code to avoid typos.
Welcome to DecisionPoint Daily Diamonds, wherein I highlight five "diamonds in the rough." These are selected from the results of my DecisionPoint scans, which search for stocks that could benefit from the trend and condition of the market. Remember, these are not recommendations to buy or sell, but are the most interesting of the stocks that surfaced in my scans. My objective is to save you the work of the initial, tedious culling process, but you need to apply your own analysis to see if these stocks pique your interest as well. There are no guaranteed winners here!
Ball Corp. (BLL)
EARNINGS: 2/4/2021 (BMO)
Ball Corp. provides metal packaging for beverages, foods and household products. It operates through the following business segments: Beverage Packaging, North and Central America; Beverage Packaging, South America; Beverage Packaging, Europe; and Aerospace. The Beverage Packaging, North and Central America segment sold under multi-year supply contracts to fillers of carbonated soft drinks, beer, energy drinks and other beverages. The Beverage Packaging, South America segment sales volumes of beverage containers in South America, and manufacture substantially all of the metal beverage containers in Brazil. The Beverage Packaging, Europe segment sales volumes of metal beverage containers in Europe, and other packaging materials used by the European beer and carbonated soft drink industries. The Aerospace segment provides diversified technical services and products to government agencies, prime contractors and commercial organizations for a broad range of information warfare, electronic warfare, avionics, intelligence, training and space system needs. The company was founded by Edmund Burke Ball, Frank Clayton Ball, George A. Ball, Lucius Lorenzo Ball and William Charles Ball in 1880 and is headquartered in Westminster, CO.
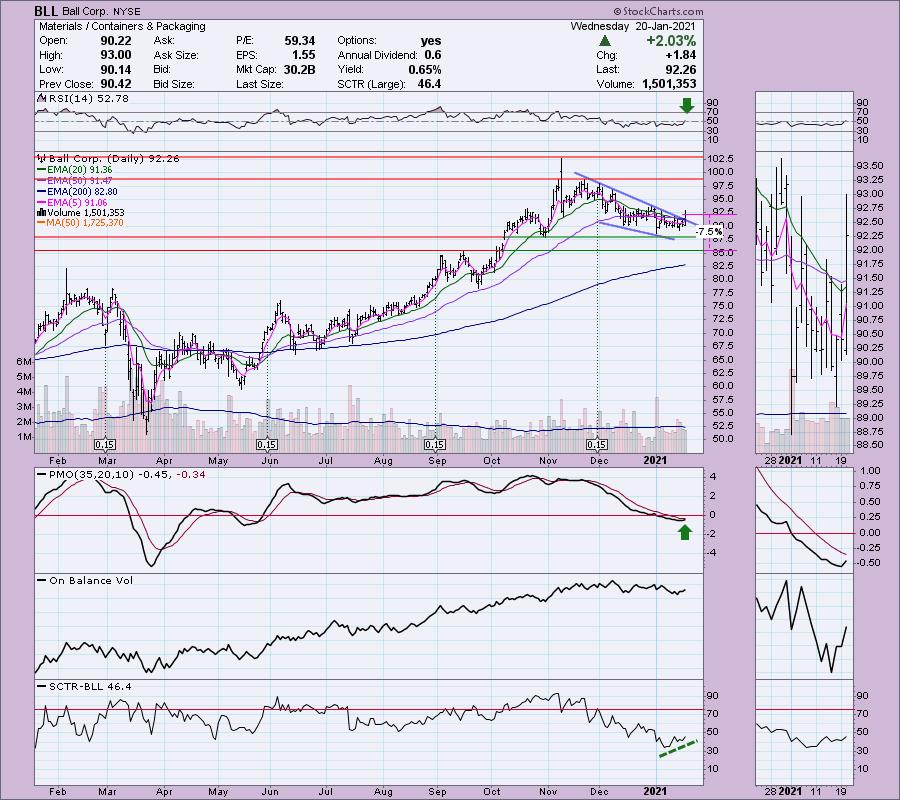
BLL is down -0.17% in after hours trading. I covered it back on March 6th 2020. Obviously, it hit the 8.7% stop. However, it currently is up 19.8% since I presented it as a reader request back then. Today's chart is very bullish. The RSI just hit positive territory and the PMO has just turned up. The bullish falling wedge was confirmed today with the strong breakout. It wasn't a "decisive" breakout (3%+), but the technicals are very favorable for a continuation.
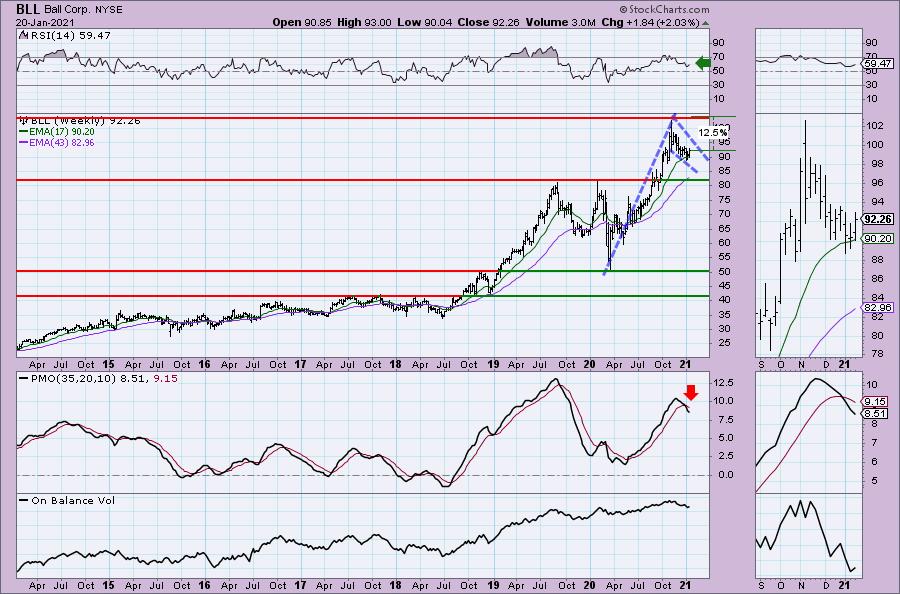
This weekly PMO is ugly, but the RSI is positive. The PMO SELL signal came after a decline that has formed a flag on a nice long flagpole. If price can reach the 2020 high that would be a 12.5% gain.
Lithium Americas Corp. (LAC)
EARNINGS: 3/12/2021 (AMC)
Lithium Americas Corp. is a resource company, which engages in lithium development projects. Its projects include: Thacker Pass and Caucharí-Olaroz. The company was founded by Raymond Edward Flood, Jr. on November 27, 2007 and is headquartered in Vancouver, Canada.
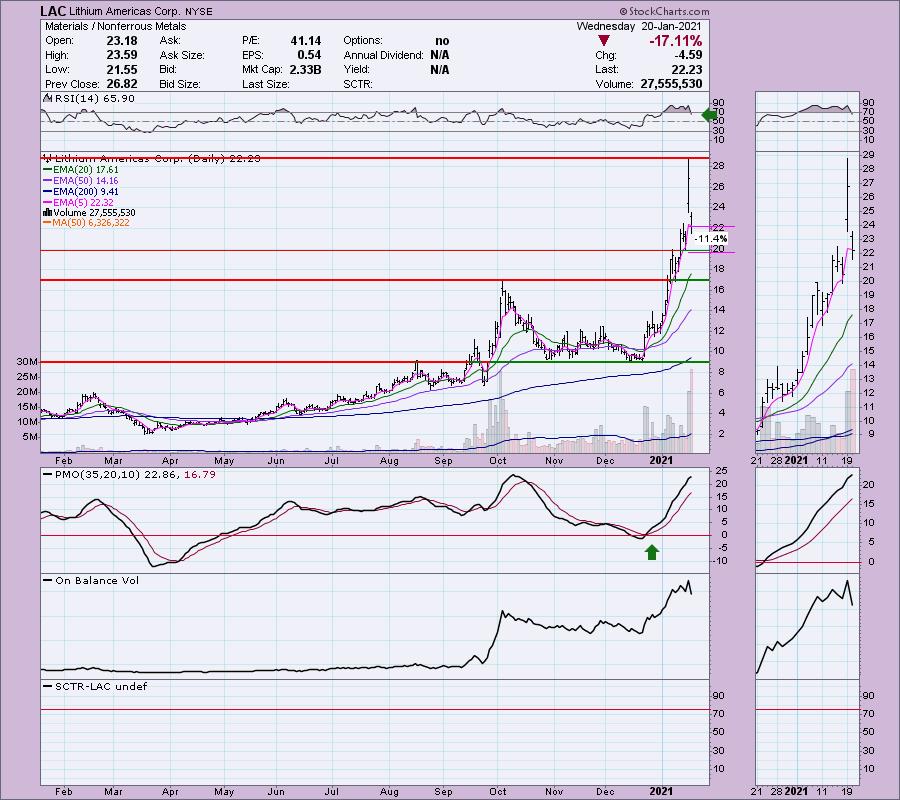
LAC is up 2.02% in after hours trading and I suspect we will see higher prices tomorrow as well. I covered LAC in the July 30th Diamonds Report and I wish I'd gotten it then rather than now. It's up a whopping 257% since then. Granted the rising trend on this one is vertical. It isn't parabolic though. It's simply straight up. That is very hard to maintain and I suspect the rising trend will decelerate somewhat. Today's giant pullback took LAC back nearly to support at $20. I have been watching this and LIT closely the past few weeks for a pullback so I could get a decent entry. Like Renewable Energy, I am prepared for the volatility on what could be more decline, but overall I like this as an intermediate-term hold. Today's pullback took the RSI out of overbought territory. The PMO is overbought, but a 17%+ decline didn't really slow its ascent which tells me there is plenty of momentum to carry it further. I would like to see the PMO leave overbought territory with price consolidation or a steady rising trend.
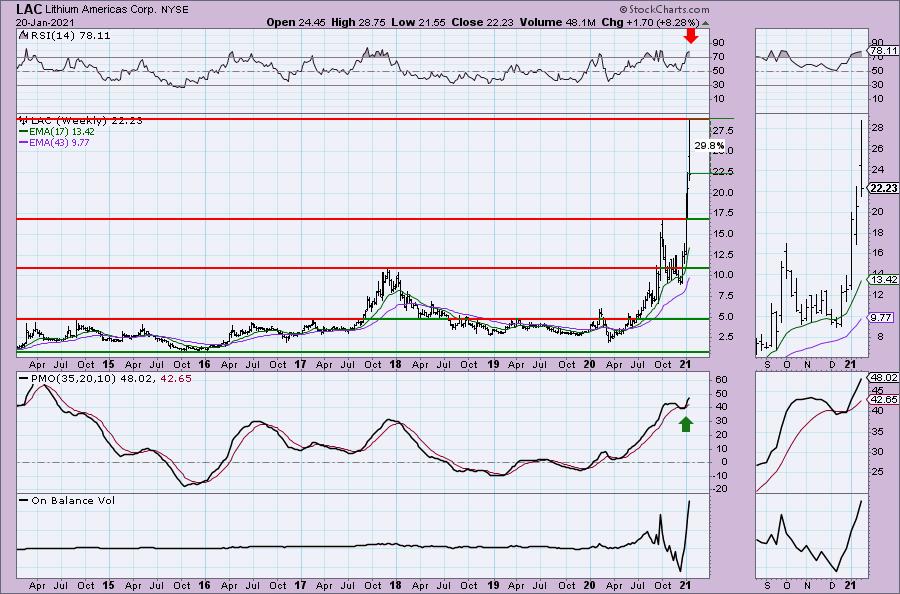
The weekly chart is very positive except for the overbought RSI, but I can point you back to 2017 and during the summer of 2020 where the RSI was in overbought territory for months. If LAC retraces back to this week's high, that would be a nearly 30% gain, and I suspect we will see more than that.
Global X Lithium ETF (LIT)
EARNINGS: N/A
LIT tracks a market- cap weighted index of global lithium miners and battery producers.
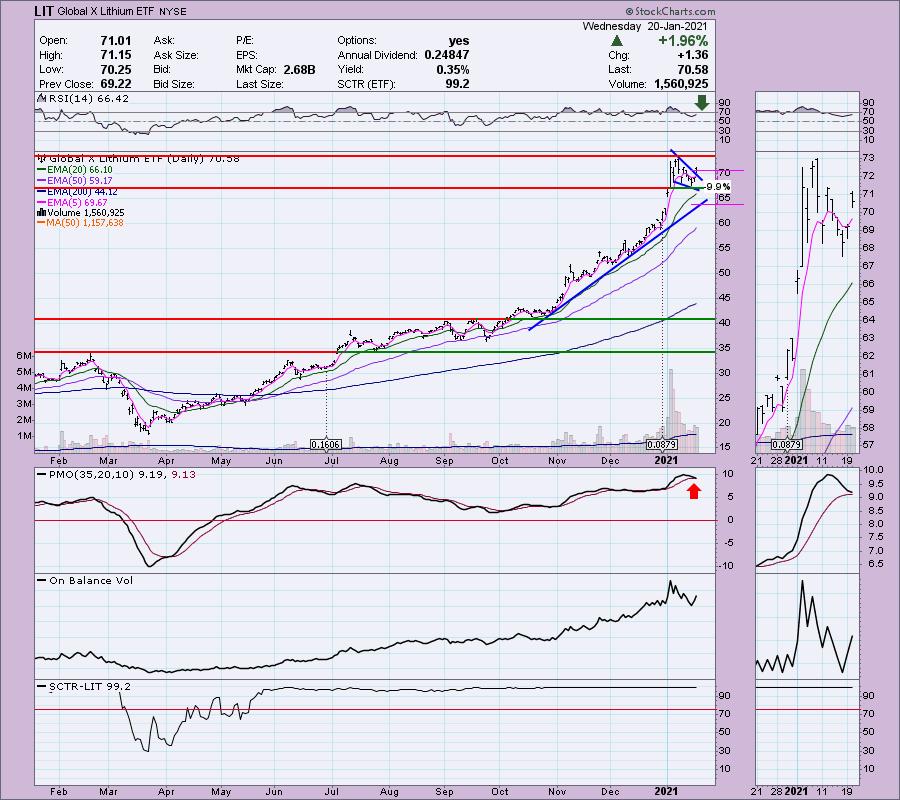
LIT is down -0.11% in after hours trading. If you want less volatility and still want exposure to this industry group, LIT is a good vehicle. Unfortunately, the PMO is falling. Although, it is trying to decelerate and avoid a crossover SELL signal. The RSI pulled back out of overbought territory on the formation of a flag on the decline. Now it has popped with a gap up. It could be a reverse island, but I'm leaning toward a breakaway gap. I set the stop under gap support.
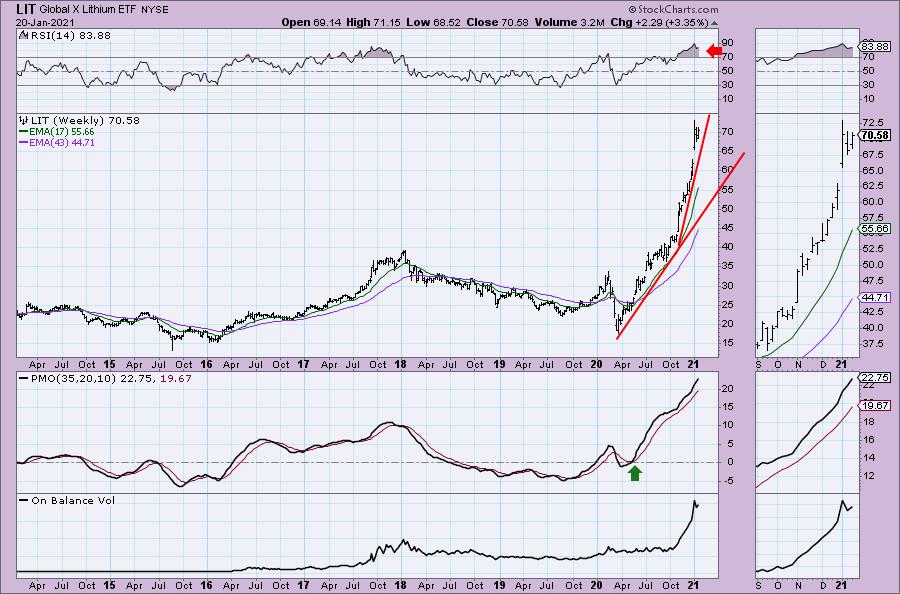
The PMO is rising nicely, but is very overbought, along with the RSI. We don't quite have a parabolic here as we only had one rising trend acceleration on the move out of the bear market low. In 2017 the RSI was overbought for months and I expect to see the same in 2021.
Don't forget, on Thursdays I look at reader-requested symbols, so shoot me an email at erin@decisionpoint.com. I read every email I receive and try to answer them all!
Piedmont Lithium Limited (PLL)
EARNINGS: 3/11/2021
Piedmont Lithium Ltd. engages in the exploration and development of mineral properties. Its activities include geology and drilling campaigns and regional infrastructure. The company was founded on September 27, 1983 by Nathan Lee Ainsworth and is headquartered in Perth, Australia.
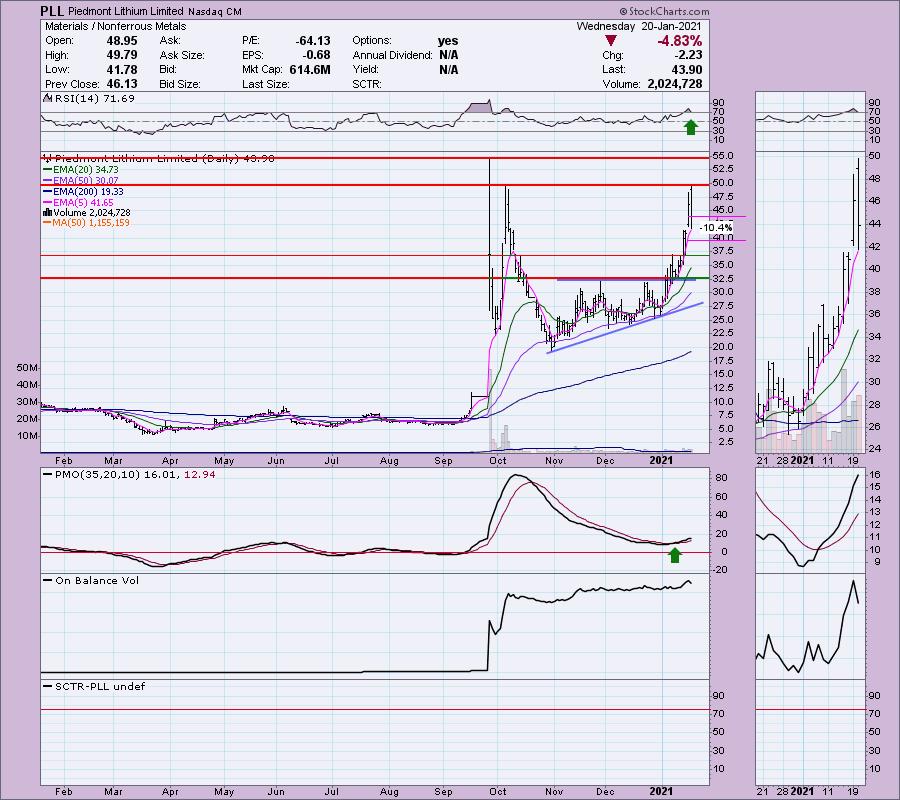
PLL is up +1.14% in after hours trading after a big decline today. These pullbacks make these stocks more enticing. We can see that price broke from a bullish ascending triangle and revved up the rising trend to near vertical. It hit overhead resistance today and pulled way back. The RSI is still overbought, but the PMO is rising strongly and is not overbought.
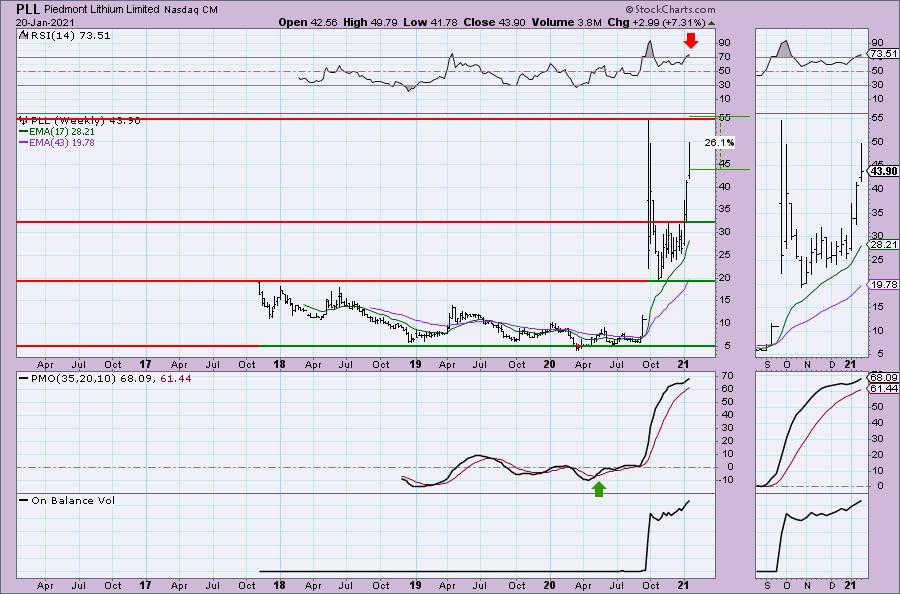
The RSI is overbought, but not exceedingly so and we have a PMO bottom above the signal line. It is hard to determine if the PMO is overbought simply because we don't have enough back data to make that determination. Volume is coming in on this rally. If price can get to the 3rd quarter high, that would be an over +25% gain.
Teck Resources Ltd. (TECK)
EARNINGS: 2/18/2021 (BMO)
Teck's business is exploring for, acquiring, developing and producing natural resources. Our activities are organized into business units focused on copper, steelmaking coal, zinc and energy. These are supported by Teck's corporate offices, which manage corporate growth initiatives and provide marketing, administrative, technical, financial and other services.
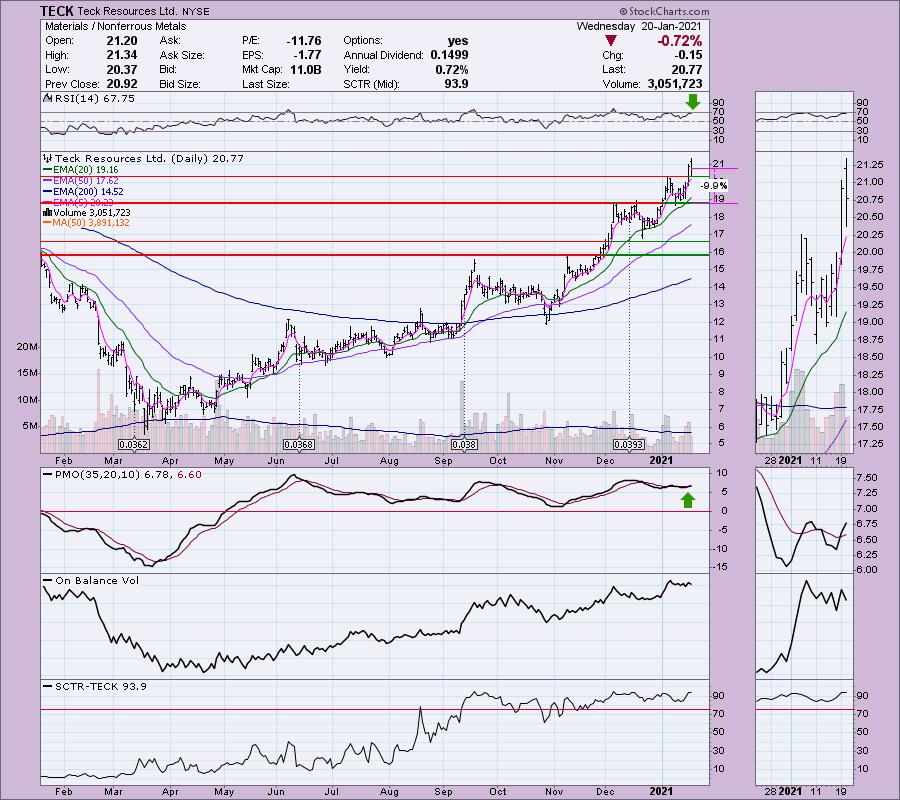
TECK is currently down -0.73% in after hours trading. It's been on a steady rising trend with orderly pullbacks and follow-on rallies. My only concern is that it might be time for one of those "orderly" pullbacks. However, the RSI is positive and not overbought and we have a new PMO BUY signal. Looking at volume, we still haven't seen the accumulation we could. I've set the stop near support at the December tops.
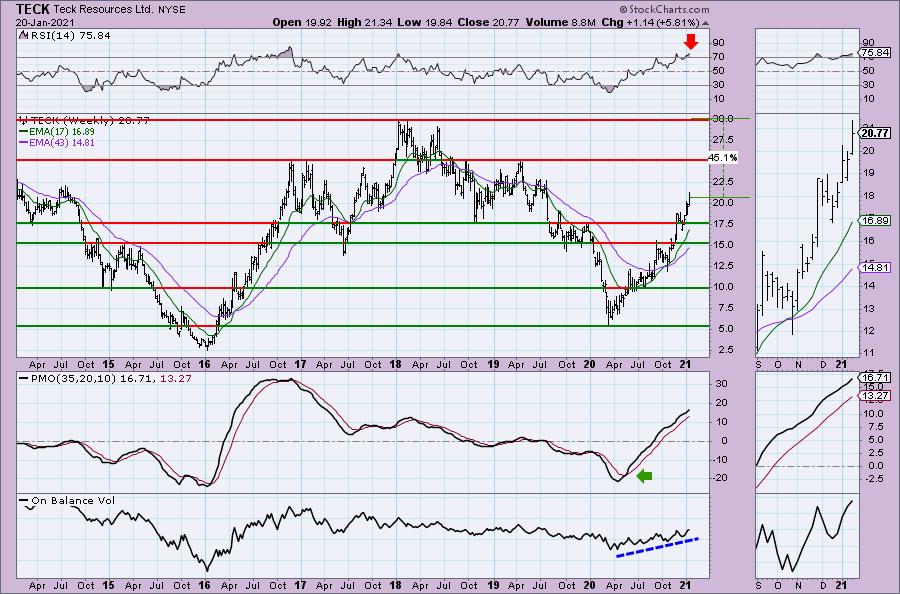
Other than an overbought RSI, the weekly chart looks enticing. We have a steadily rising PMO and confirmation from the OBV. Upside potential is about 20% if it reaches the 2019 top and 45% if it can reach the 2018 high.
Full Disclosure: I'm about 75% invested and 25% is in 'cash', meaning in money markets and readily available to trade with. I didn't get to the computer this morning and didn't buy a Home Builder... but, I did purchase LIT and LAC in after hours trading. Not my preference to trade that way "sans chart", but I have distractions tomorrow morning that will prevent my normal "studied" entry on a 5-min candlestick chart. I should've done the same last night with PHM, but I thought I'd be available to trade this morning.
Current Market Outlook:
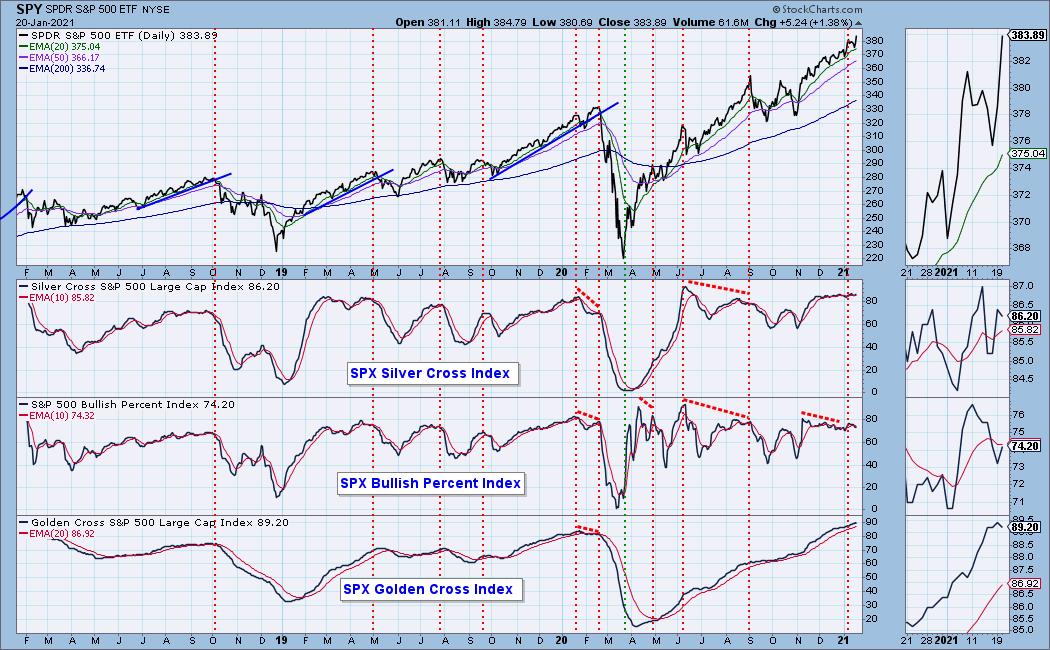
Market Environment: It is important to consider the odds for success by assessing the market tides. The following chart uses different methodologies for objectively showing the depth and trend of participation for intermediate- and long-term time frames.
- The Silver Cross Index (SCI) shows the percentage of SPX stocks on IT Trend Model BUY signals (20-EMA > 50-EMA)
- The Golden Cross Index (GCI) shows the percentage of SPX stocks on LT Trend Model BUY signals (50-EMA > 200-EMA)
- The Bullish Percent Index (BPI) shows the percentage of SPX stocks on Point & Figure BUY signals.
Don't forget that as a "Diamonds" member, you have access to our GCI/SCI curated ChartList on DecisionPoint.com. You'll find it under "Members Only" links on the left side on the Blogs and Links Page.
Here is the current chart:
Diamond Index:
- Diamond Scan Results: 7
- Diamond Dog Scan Results: 0
- Diamond Bull/Bear Ratio: 7.00
I'm in the process of trying to plot the Diamond Index, but with time at a premium, it is on the back burner.
Technical Analysis is a windsock, not a crystal ball.
Happy Charting!
- Erin
erin@decisionpoint.com
Watch the latest episode of DecisionPoint with Carl & Erin Swenlin on Mondays 7:00p EST or on the DecisionPoint playlist on the StockCharts TV YouTube channel here!
NOTE: The stocks reported herein are from mechanical trading model scans that are based upon moving average relationships, momentum and volume. DecisionPoint analysis is then applied to get five selections from the scans. The selections given should prompt readers to do a chart review using their own analysis process. This letter is not a call for a specific action to buy, sell or short any of the stocks provided. There are NO sure things or guaranteed returns on the daily selection of "diamonds in the rough."
Helpful DecisionPoint Links:
DecisionPoint Shared ChartList and DecisionPoint Chart Gallery
Price Momentum Oscillator (PMO)
Swenlin Trading Oscillators (STO-B and STO-V)
For more links, go to DecisionPoint.com!