
I noticed that I had two Home Builders come up on one scan and two more on a different scan. I decided to look more closely at the members of that industry group and found a few more to add. I will say that these all are short-term "Diamonds in the Rough" given the weekly charts don't look as great as the daily charts.
I will be selling UNG and PFE tomorrow. Hope to see a reverse island on UNG or at least a bounce after today's big decline. PFE just isn't doing anything and the indicators have turned very south. I plan holding BHLB for the time being. Renewable Energy is still racing higher, but I'm considering adding a few trailing stops to my positions to be sure and lock in some of the profit if we get a parabolic collapse. If we get a decent pullback on some of those stocks, I'll be adding more shares or a new position. Here are my favorites right now: SPWR, RUN, TAN, TPIC, PLUG and ENPH. Full disclosure: I own the first three.
Today's "Diamonds in the Rough" are: BZH, DHI, HOV, PHM and TOL.
 Diamond Mine Information:
Here is the 1/15/2021 recording link. Access Passcode: mp+.Uj4q
===============================================================================
Register in advance for the next "DecisionPoint Diamond Mine" trading room on FRIDAY (1/22/2021) 12:00p ET:
Here is the Registration Link & Entry Password: poppy
Please do not share these links! They are for Diamonds subscribers ONLY!
Save the registration confirmation email with login instructions in case Zoom doesn't notify you in time.

It's Free!
***Click here to register for this recurring free DecisionPoint Trading Room on Mondays at Noon ET!***
There was no Trading Room on Monday January 18th due to holiday.
Did you miss the 1/11/2021 free trading room? Here is a link to the recording. Access Code: ?H++t+d5
For best results, copy and paste the access code to avoid typos.
Welcome to DecisionPoint Daily Diamonds, wherein I highlight five "diamonds in the rough." These are selected from the results of my DecisionPoint scans, which search for stocks that could benefit from the trend and condition of the market. Remember, these are not recommendations to buy or sell, but are the most interesting of the stocks that surfaced in my scans. My objective is to save you the work of the initial, tedious culling process, but you need to apply your own analysis to see if these stocks pique your interest as well. There are no guaranteed winners here!
Beazer Homes USA, Inc. (BZH)
EARNINGS: 1/28/2021 (AMC)
Beazer Homes USA, Inc. engages in the design and sale of single-family and multi-family homes. It operates through the following geographical segments: West, East, and Southeast. The West segment includes Arizona, California, Nevada, and Texas. The East segment consists of Delaware, Indiana, Maryland, Tennessee, and Virginia. The Southeast segment includes Florida, Georgia, North Carolina, and South Carolina. The company was founded in 1993 and is headquartered in Atlanta, GA.
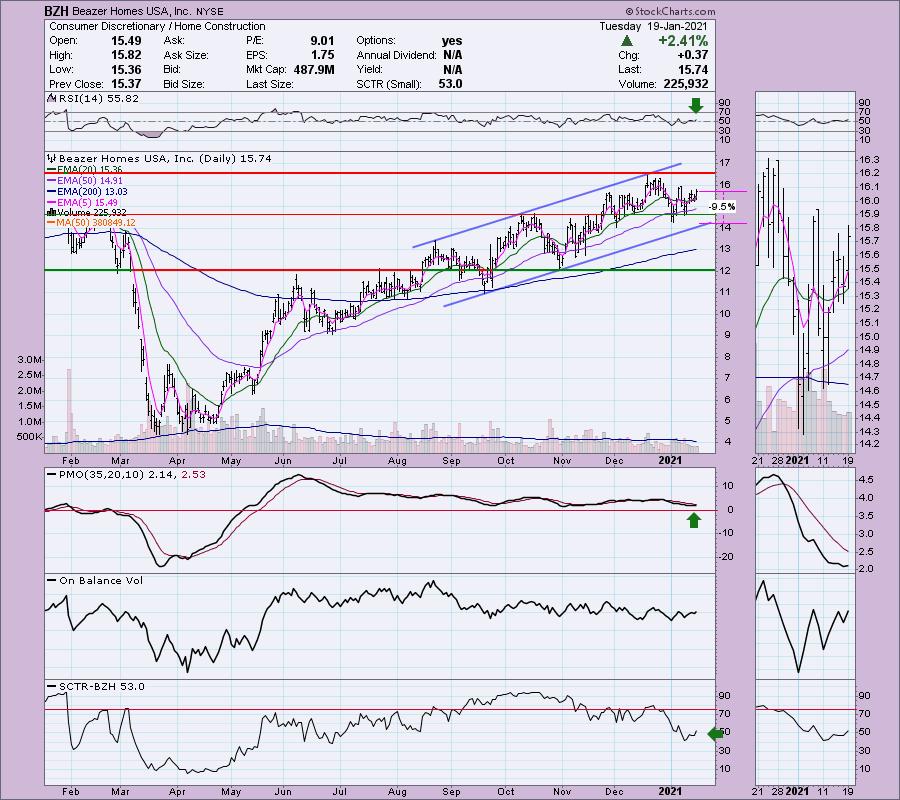
BZH is unchanged in after hours trading. It's been in a solid rising trend for many months. The PMO has just turned up on this recent rally. The RSI is neutral to positive. You could make a case for a short-term double-bottom. Price would execute the pattern with a rally above the recent high near $16. The OBV is confirming the very short-term rising trend. The SCTR is not in the hot zone, but it is improving. I set the stop below the double-bottom.
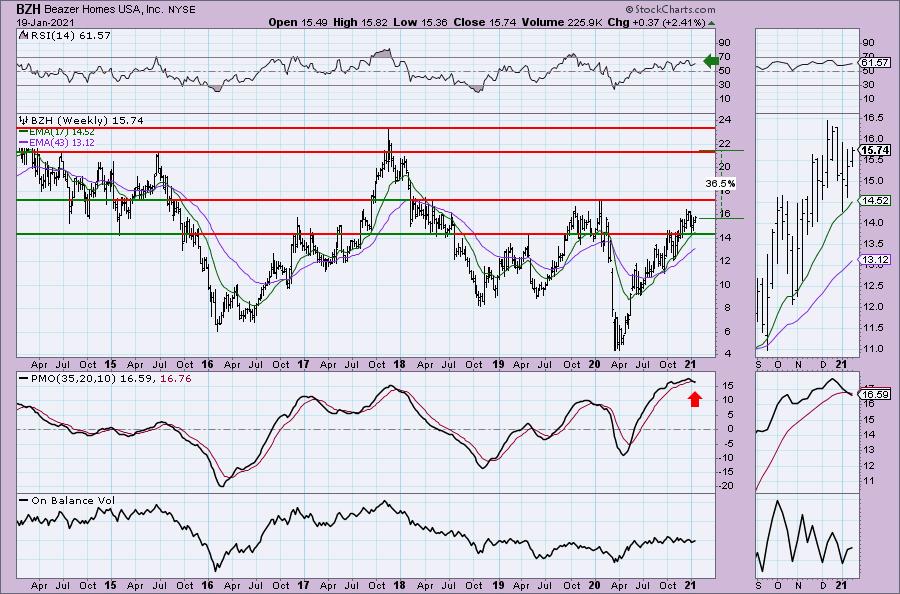
There is a PMO SELL signal on the weekly chart; however, price is in a nice rising trend and holding above the 17-week EMA. Additionally, the RSI is positive and rising. The 2020 high will be difficult overhead resistance, but if it can climb above it, the upside potential is quite nice.
DR Horton Inc. (DHI)
EARNINGS: 1/26/2021 (BMO)
D.R. Horton, Inc. engages in the construction and sale of single-family housing. It operates through the following segments: Homebuilding and Financial Services. The Homebuilding segment includes the sub-segments East, Midwest, Southeast, South Central, Southwest and West regions. The Financial Services segment provides mortgage financing and title agency services to homebuyers in many of its homebuilding markets. The company was founded by Donald Ray Horton in 1978 and is headquartered in Arlington, TX.
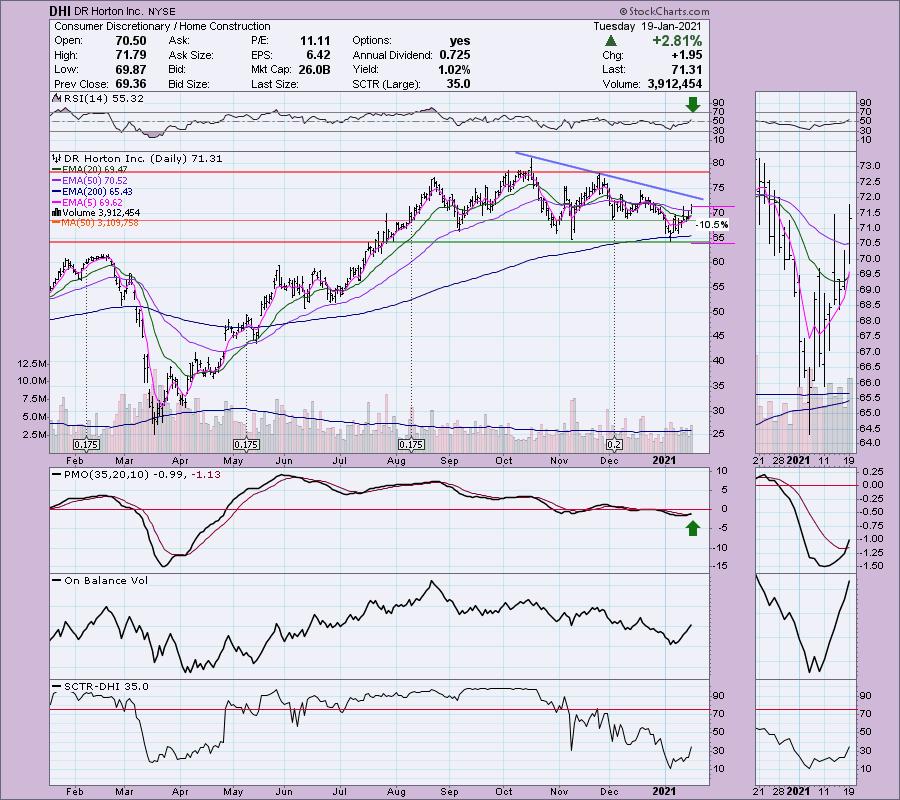
Up 0.69% in after hours trading, DHI already rallied heavily today. It hasn't broken out from its declining trend yet, but we do have a brand new ST Trend Model BUY signal as the 5-EMA crossed above the 20-EMA. Price also closed above the 50-EMA for the first time since its late-December decline. The PMO has just triggered a BUY signal. Volume is coming in heavy on this rally. The stop level is just below the November/December lows.
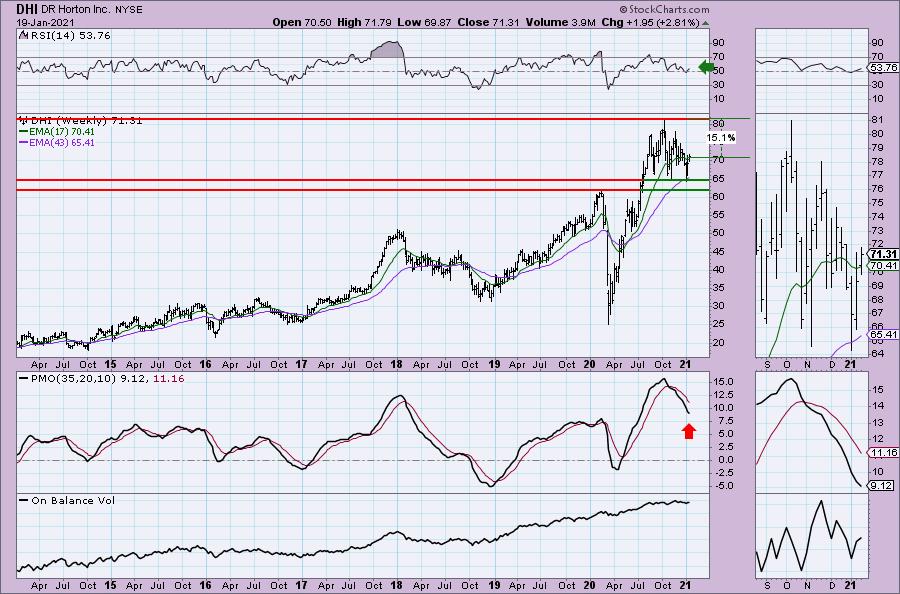
DHI has been on a PMO SELL signal for some time. Admittedly, I don't like the topping pattern on this weekly chart, but so far support at $65 is holding and the RSI is positive.
Hovnanian Enterprises, Inc. (HOV)
EARNINGS: 3/10/2021 (BMO)
Hovnanian Enterprises, Inc. is a homebuilding company, which engages in the design, construct, market, and sell single-family attached town homes and condominiums, urban infill, and planned residential developments. It operates through the following segments: Homebuilding Operation, Financial Services, and Corporate. The Homebuilding Operation segment consists of the following geographical segments: Northeast, Mid-Atlantic, Midwest, Southeast, Southwest, and West. The Financial Services segment offers mortgage loans and title services to the customers of homebuilding operations. The company was founded by Kevork S. Hovnanian in 1959 and is headquartered in Matawan, NJ.
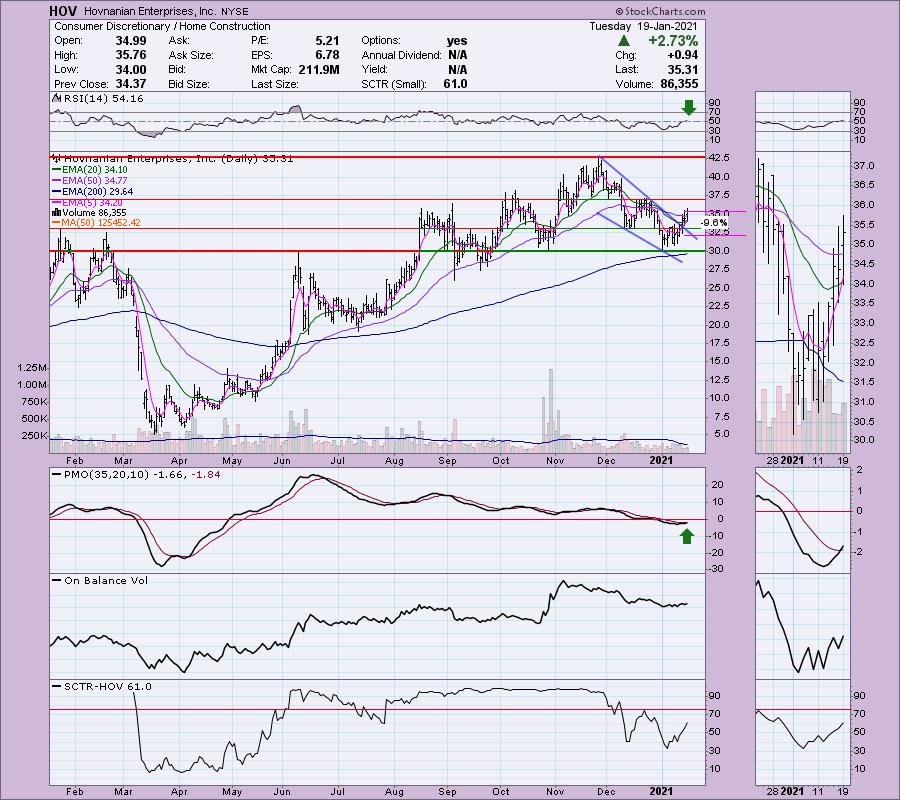
HOV is down -0.23% in after hours trading. I like this chart quite a bit with the newly minted PMO BUY signal and positive RSI. This rally has confirmed a bullish falling wedge pattern and suggest high prices. The SCTR is making a move toward the hot zone above 75. The stop level is set below the mid-December low.
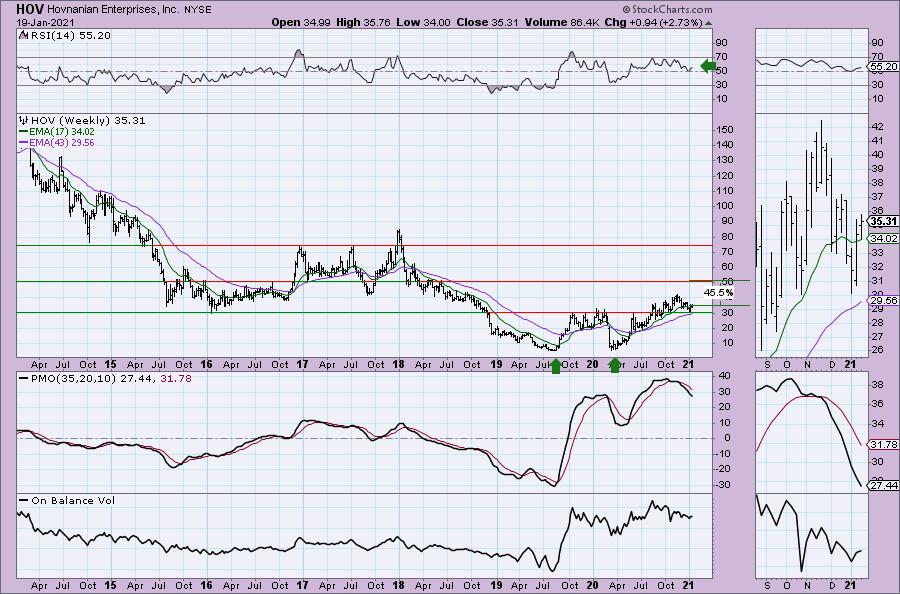
The weekly chart shows a PMO SELL signal that has been going since October of last year. The RSI didn't sustain any damage and remains positive and is rising again. There was a negative OBV divergence that resulted in the November top. Now we have rising bottoms on the OBV.
Don't forget, on Thursdays I look at reader-requested symbols, so shoot me an email at erin@decisionpoint.com. I read every email I receive and try to answer them all!
PulteGroup, Inc. (PHM)
EARNINGS: 1/28/2021 (BMO)
PulteGroup, Inc. engages in the homebuilding business. It is also involved in the mortgage banking, and title and insurance brokerage operations. It operates through the Homebuilding and Financial services business segments. The Homebuilding segment comprises of operations from the Connecticut, Maryland, Massachusetts, New Jersey, New York, Pennsylvania, Rhode Island, Virginia, Georgia, North Carolina, South Carolina, Tennessee, Florida, Illinois, Indiana, Kentucky, Michigan, Minnesota, Missouri, Ohio, Texas, Arizona, California, Nevada, New Mexico, and Washington. The Financial Services segment consists of mortgage banking and title operations. The company was founded by William J. Pulte in 1950 and is headquartered in Atlanta, GA.
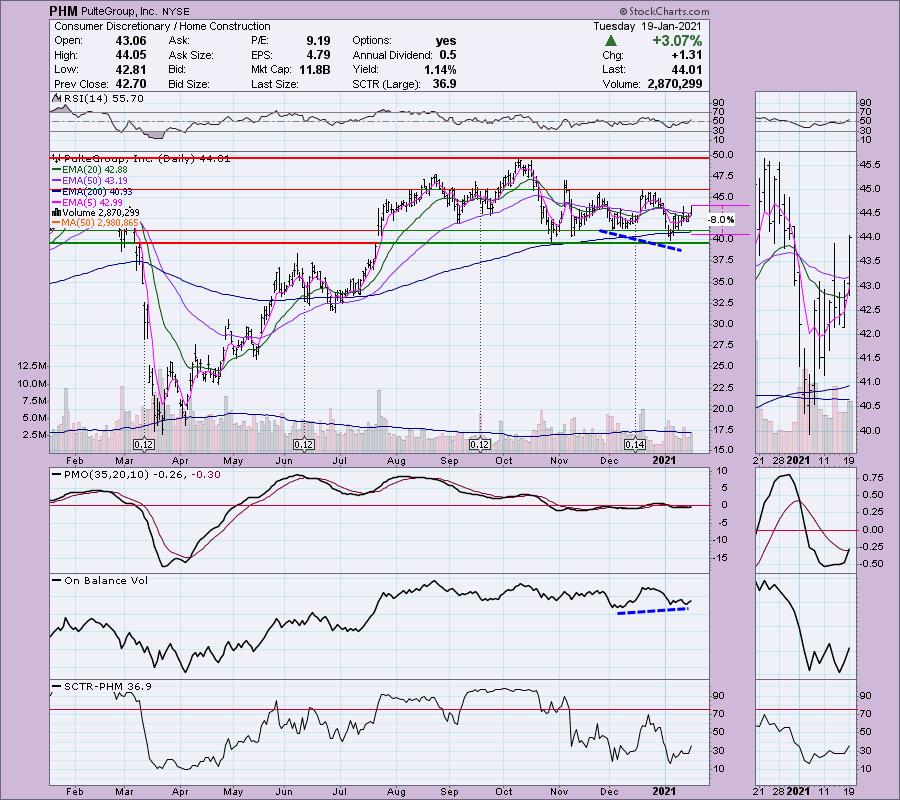
Up +0.43% in after hours trading, I covered Pulte in the November 18th 2020 Diamonds Report (up +0.64% since, it barely missed hitting the stop on this month's low). I owned this one and took a small profit before selling in late December and now I am eyeing it for a repurchase. Based on after hours trading, we may not get a much better entry than this, but I'll be stalking the 5-min candlestick chart tomorrow. My hesitation on this one is that strong overhead resistance just above $45 could be a problem once again. A new ST Trend Model BUY signal was generated on the 5/20-EMA positive crossover and it appears we could see an IT Trend Model BUY should the 20-EMA get above the 50-EMA. There is a new PMO BUY signal and the RSI has just hit positive territory above net neutral (50).
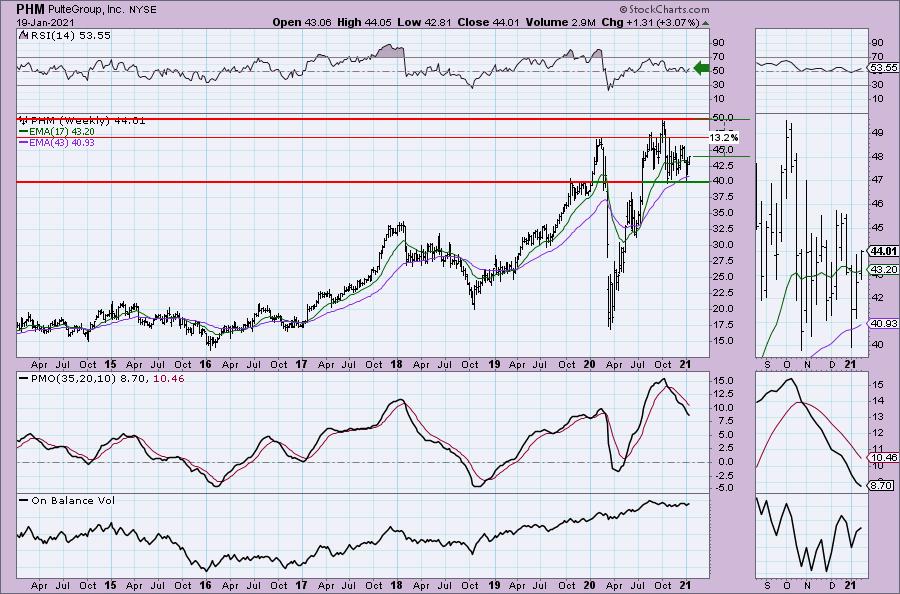
Not surprising to see a weekly chart that looks like the rest. PHM is on a PMO SELL signal, but I do see a slight deceleration as it rallied last week. Very important support has held and the RSI is still positive.
Toll Brothers, Inc. (TOL)
EARNINGS: 2/23/2021 (AMC)
Toll Brothers, Inc. engages in the design, building, marketing, and arranging of financing for detached and attached homes in residential communities. It operates through the following segments: Traditional Home Building and City Living. The Traditional Home Building segment builds and sells homes for detached and attached homes in luxury residential communities in affluent suburban markets and and cater to move-up, empty-nester, active-adult, age-qualified, and second-home buyers. The City Living segment builds and sells homes in urban infill markets through Toll Brothers City Living. The company was founded by Robert I. Toll and Bruce E. Toll in May 1986 and is headquartered in Fort Washington, PA.
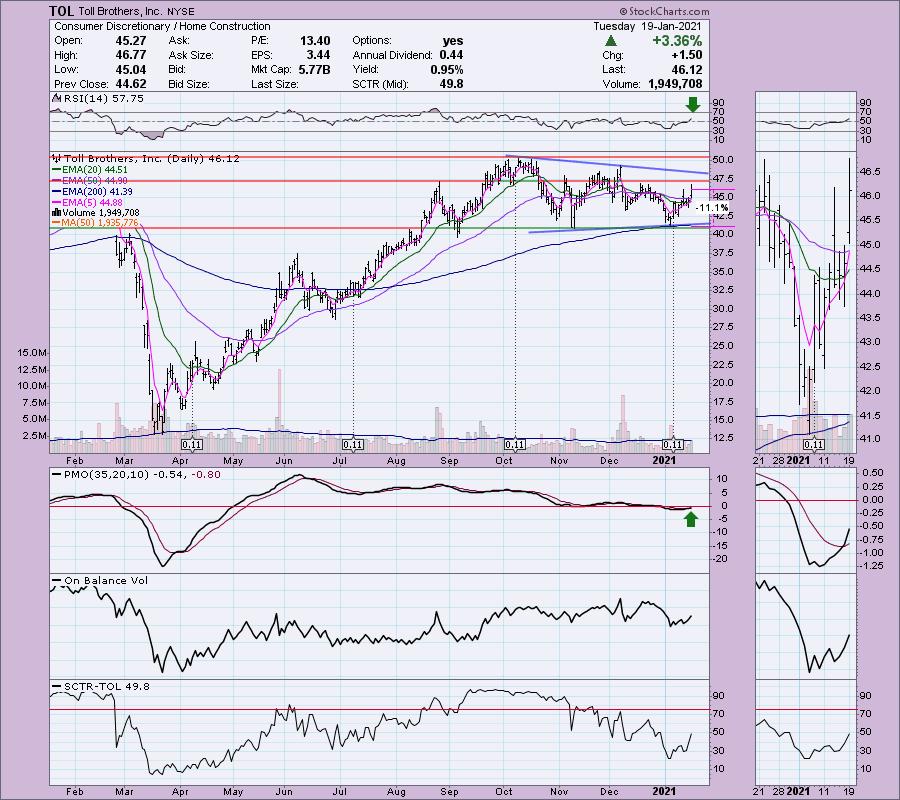
Currently TOL is up +0.23% in after hours trading. I covered it in the November 17th Diamonds Report (10% stop was triggered on the late December decline. It's currently down -1.03% since that report). We have a new ST Trend Model BUY signal on the 5/20-EMA positive crossover. The RSI is positive and the PMO has just generated a new crossover BUY signal. The SCTR is rising nicely. The stop is rather deep, but it makes the most sense to set it below the November/January bottoms.
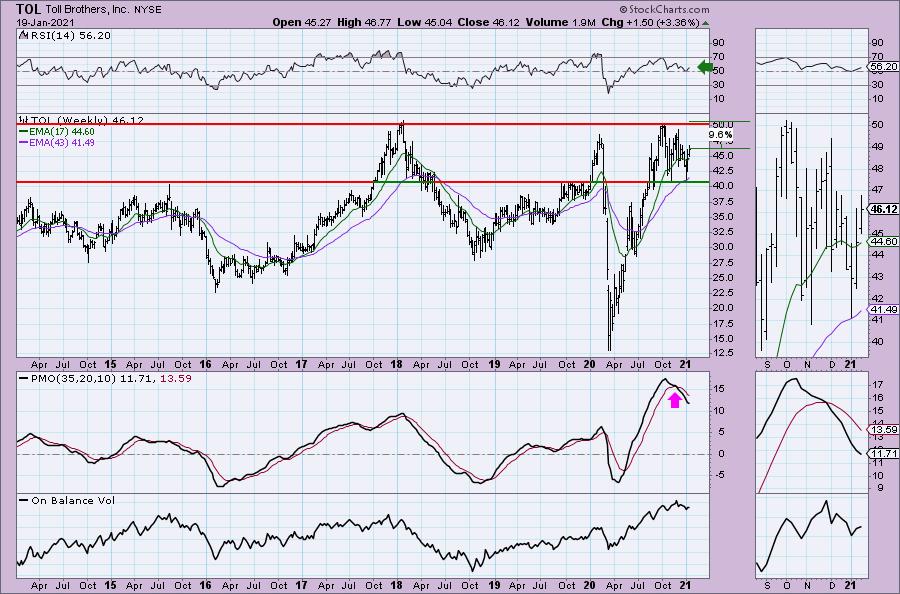
We can see that a drop below the stop level above would mean a loss of very important support. The PMO is on a crossover SELL signal, but it is decelerating slightly and the RSI remains positive.
Full Disclosure: I'm about 55% invested and 45% is in 'cash', meaning in money markets and readily available to trade with.
Current Market Outlook:
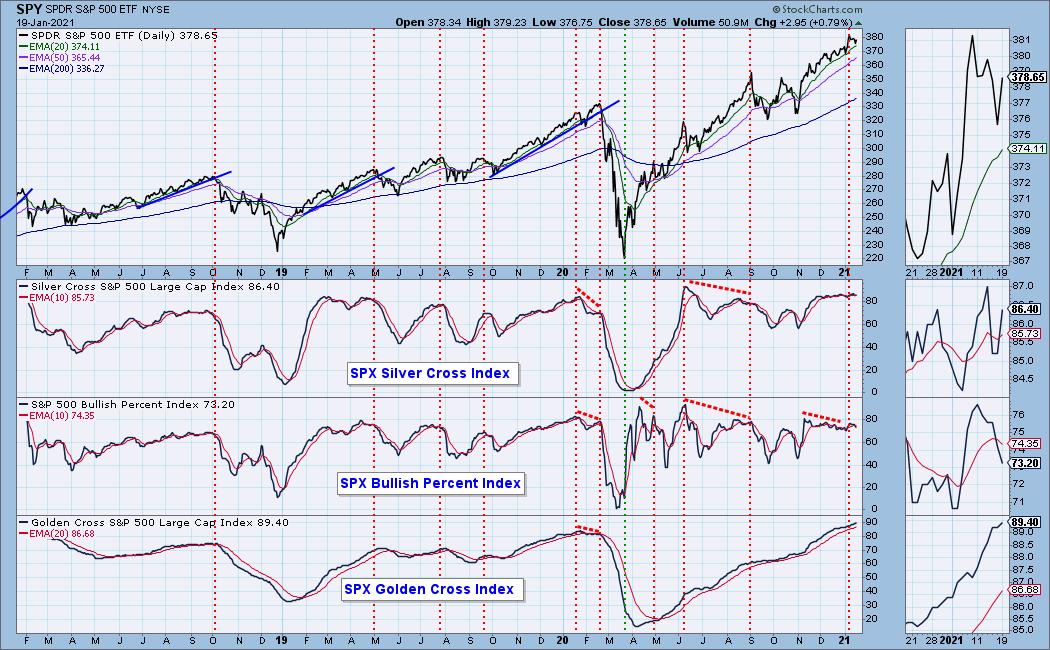
Market Environment: It is important to consider the odds for success by assessing the market tides. The following chart uses different methodologies for objectively showing the depth and trend of participation for intermediate- and long-term time frames.
- The Silver Cross Index (SCI) shows the percentage of SPX stocks on IT Trend Model BUY signals (20-EMA > 50-EMA)
- The Golden Cross Index (GCI) shows the percentage of SPX stocks on LT Trend Model BUY signals (50-EMA > 200-EMA)
- The Bullish Percent Index (BPI) shows the percentage of SPX stocks on Point & Figure BUY signals.
Don't forget that as a "Diamonds" member, you have access to our GCI/SCI curated ChartList on DecisionPoint.com. You'll find it under "Members Only" links on the left side on the Blogs and Links Page.
Here is the current chart:
Diamond Index:
- Diamond Scan Results: 15
- Diamond Dog Scan Results: 3
- Diamond Bull/Bear Ratio: 5.00
I'm in the process of trying to plot the Diamond Index, but with time at a premium, it is on the back burner.
Technical Analysis is a windsock, not a crystal ball.
Happy Charting!
- Erin
erin@decisionpoint.com
Watch the latest episode of DecisionPoint with Carl & Erin Swenlin on Mondays 7:00p EST or on the DecisionPoint playlist on the StockCharts TV YouTube channel here!
NOTE: The stocks reported herein are from mechanical trading model scans that are based upon moving average relationships, momentum and volume. DecisionPoint analysis is then applied to get five selections from the scans. The selections given should prompt readers to do a chart review using their own analysis process. This letter is not a call for a specific action to buy, sell or short any of the stocks provided. There are NO sure things or guaranteed returns on the daily selection of "diamonds in the rough."
Helpful DecisionPoint Links:
DecisionPoint Shared ChartList and DecisionPoint Chart Gallery
Price Momentum Oscillator (PMO)
Swenlin Trading Oscillators (STO-B and STO-V)
For more links, go to DecisionPoint.com!