
A new slate of "diamonds in the rough" is here! First, let me say that I'm not feeling optimistic about the market as a whole. This means that we could be swimming against the current if the market decides to finally give us a significant top. I am combing through my positions this evening and making sure I'm happy with my stop levels and which positions I'm willing to brave a storm with. Also consider your position sizing, if a few stocks get caught up in a big decline, it will hurt far less.
The Diamond PMO Scan only produced nine results today which is another indication the market is nearing a top. On the bright side, the Diamond DOG Scan is still producing less than 10 results.
Another comment, the scans I ran today produced quite a few Gold Miners. I'm not going to present any today because I'm not yet enamored of the price action on GDX, the Gold Miner ETF. To read more about that, be sure to check out tonight's DP Alert when I publish it after this report. Spotify (SPOT) came in sixth today and therefore wasn't included, but I like the chart. I just didn't want to suck up the 6.8% gain today that could be significantly lost tomorrow. It would be much more interesting after a pullback so you may see it on the list tomorrow. Additionally, Western Union (WU), my selection on Reader Request Day last Thursday, appears to have broken down. Use caution.
Today's "Diamonds in the Rough": DIS, EVOP, FDS, FRGI, AND SHAK
 Diamond Mine Information:
Recording from 10/9/2020 is at this link. Access Passcode: .6O2G.E!
Register in advance for the next "DecisionPoint Diamond Mine" trading room on Friday (10/9/2020) 12:00p ET:
Here is the registration link for Friday, 10/16/2020. Password: outlook
Please do not share these links! They are for Diamonds subscribers ONLY!

IT'S FREE!
***Click here to register for this recurring free DecisionPoint Trading Room!***
Did you miss the 10/12 trading room? Here is a link to the recording (password: qE58C9.E). For best results, copy and paste the password to avoid typos.
Welcome to DecisionPoint Daily Diamonds, wherein I highlight five "diamonds in the rough." These are selected from the results of my DecisionPoint scans, which search for stocks that could benefit from the trend and condition of the market. Remember, these are not recommendations to buy or sell, but are the most interesting of the stocks that surfaced in my scans. My objective is to save you the work of the initial, tedious culling process, but you need to apply your own analysis to see if these stocks pique your interest as well. There are no guaranteed winners here!
Walt Disney Co. (DIS)
EARNINGS: 11/12/2020 (AMC)
The Walt Disney Co. is a diversified international family entertainment and media enterprise. It operates through the following segments: Media Networks, Parks, Experiences and Products, Studio Entertainment and Direct-to-Consumer and International (DTCI). The Media Networks segment includes cable and broadcast television networks, television production and distribution operations, domestic television stations, radio networks and stations. The Parks, Experiences and Products segment owns and operates the Walt Disney World Resort in Florida; the Disneyland Resort in California; Aulani, a Disney Resort & Spa in Hawaii; the Disney Vacation Club; the Disney Cruise Line; and Adventures by Disney. The Studio Entertainment segment produces and acquires live-action and animated motion pictures, direct-to-video content, musical recordings and live stage plays. This segment distributes films primarily under the Walt Disney Pictures, Pixar, Marvel, Lucasfilm and Touchstone banners. The DTCI segment licenses the company's trade names, characters and visual and literary properties to various manufacturers, game developers, publishers and retailers throughout the world. It also develops and publishes games, primarily for mobile platforms, and books, magazines and comic books. This segment also distributes branded merchandise directly through retail, online and wholesale businesses. The Walt Disney was founded by Walter Elias Disney on October 16, 1923 and is headquartered in Burbank, CA.
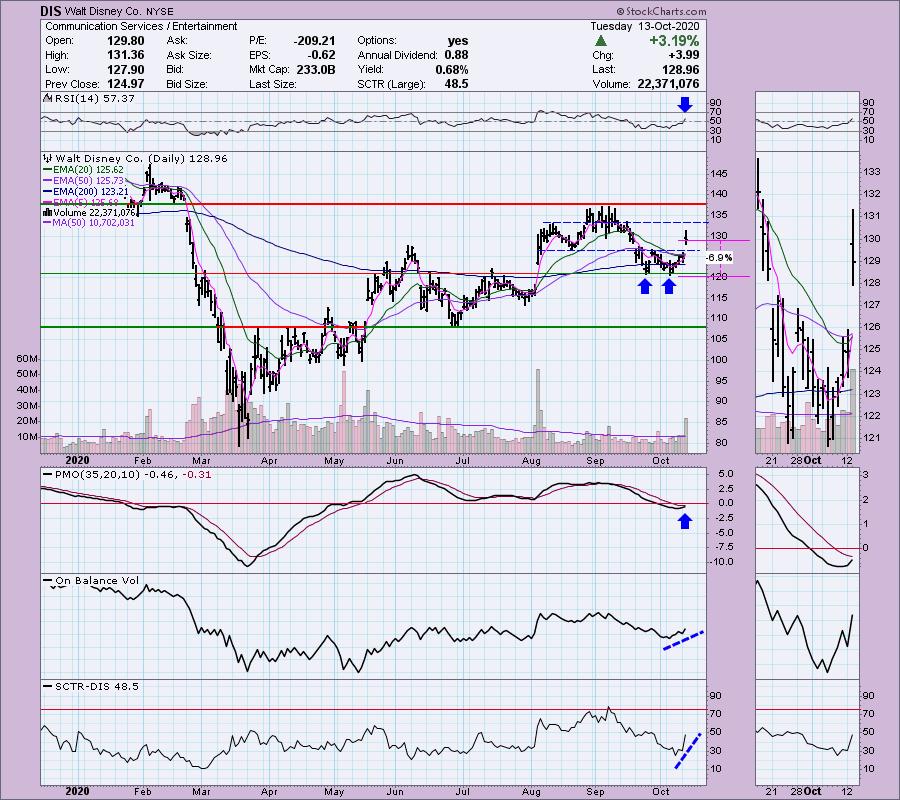
Up +0.38% in after hours trading, Disney (DIS) was a Reader Request in the May 7th Diamond Report (+22.2%) and August 26th Diamond Report (-2.4%). Today's breakout was quite impressive. While it could be a possible island reversal, the indicators look too positive for me not to include it today. With today's breakout, a double-bottom has executed. Granted the upside target was hit intraday, but remember the targets calculated for chart patterns are considered "minimum" upside targets. The RSI has just moved into positive territory and the PMO has turned up just below the zero line in oversold territory. OBV is confirming the rally and the SCTR is gaining strength. I like that you can set a reasonable stop beneath the double-bottom.
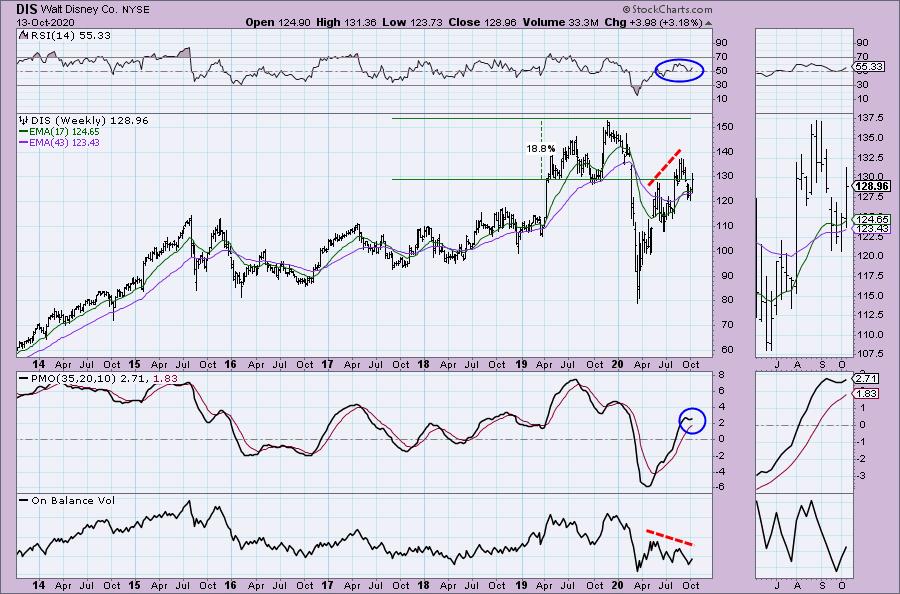
Two things impressed me about the weekly chart. First, the PMO has bottomed above its signal line which I always find especially bullish. Additionally the RSI has been positive for some time. On the bearish side, I'm not thrilled with the negative divergence on the OBV.
EVO Payments, Inc. (EVOP)
EARNINGS: 11/5/2020 (BMO)
EVO Payments, Inc. is a holding company, which provides payments technology and services. It offers payment and commerce solutions. It operates through the Americas and Europe geographical segments. The Americas segment is composed of the United States, Canada, and Mexico. The Europe segment includes operations in the Czech Republic, Germany, Ireland, Poland, Spain, and the United Kingdom, as well as supporting merchants in France, Austria, Italy, the Nordics, and other Central and Eastern European. The company was founded by Rafik R. Sidhom in 1989 and is headquartered in Atlanta, GA.
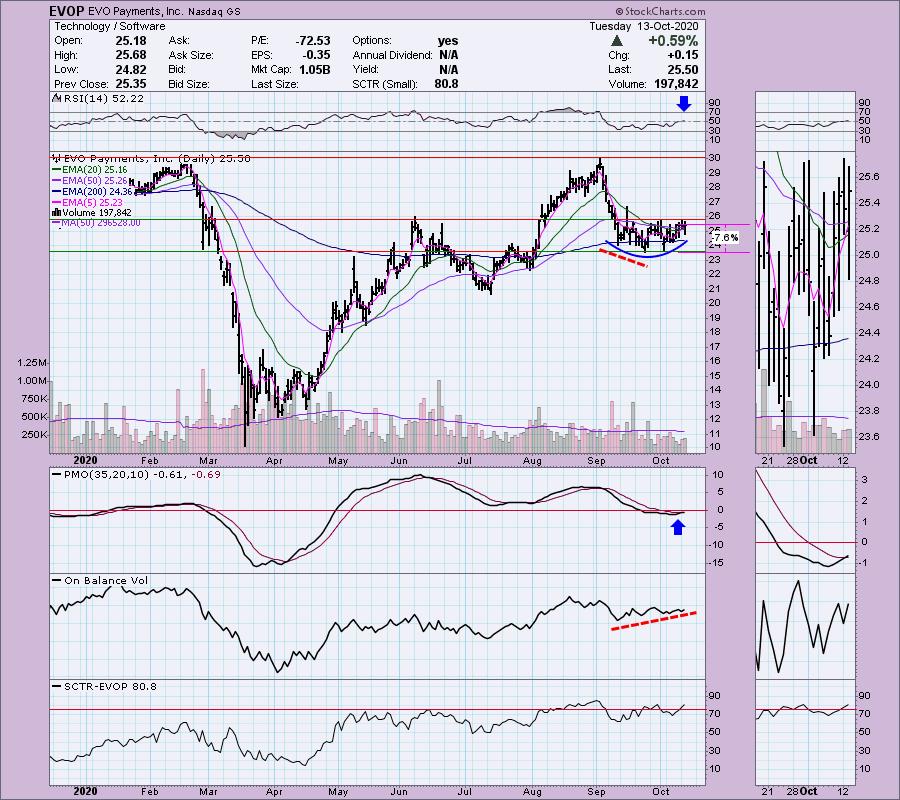
We have a nice rounded price bottom. Price is struggling with overhead resistance currently, but the positive divergence with the OBV tells me a breakout could be nearing. The PMO just triggered a crossover BUY signal. Add a positive RSI and a SCTR in the hot zone and you have a "diamond in the rough". The stop is reasonable at 7.6%.
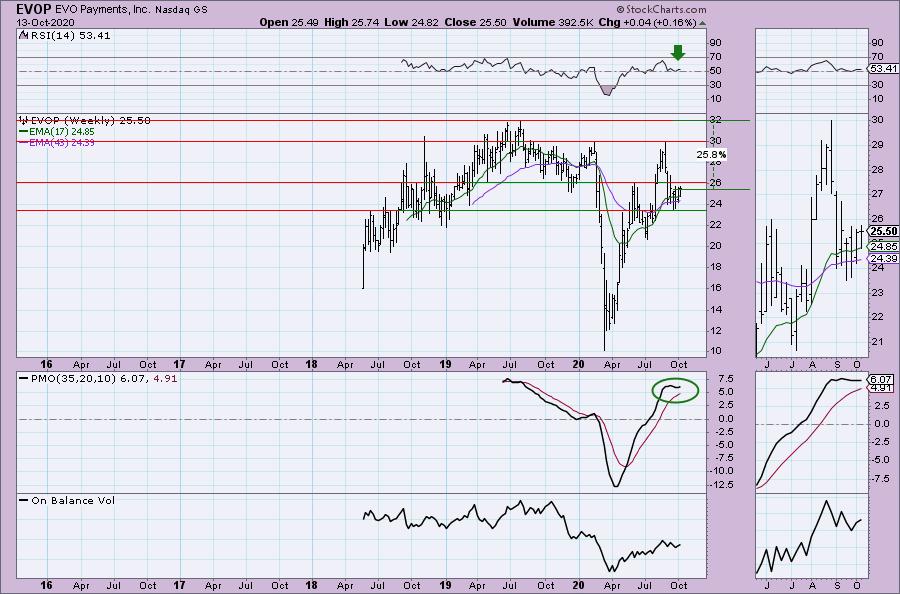
The weekly PMO is attempting to bottom above the signal line. We can't really judge overbought and oversold levels on the PMO, but the RSI works for that. Currently, it is positive.
Don't forget, on Thursdays I look at reader-requested symbols, so shoot me an email at erin@decisionpoint.com. I read every email I receive and try to answer them all!
Factset Research Sys, Inc. (FDS)
EARNINGS: 12/17/2020 (BMO)
FactSet Research Systems Inc. (the Company or FactSet) is a global provider of integrated financial information, analytical applications and services for the investment and corporate communities. Since inception, global financial professionals have utilized the Company's content and multi-asset class solutions across each stage of the investment process. FactSet's goal is to provide a seamless user experience spanning idea generation, research, portfolio construction, trade execution, performance measurement, risk management, reporting, and portfolio analysis, in which the Company serves the front, middle, and back offices to drive productivity and improved performance. FactSet's flexible, open data and technology solutions can be implemented both across the investment portfolio lifecycle or as standalone components serving different workflows in the organization. FactSet is focused on growing the business throughout each of its three segments, the Americas, EMEA (formerly known as Europe), and Asia Pacific. The Company primarily delivers insight and information through the workflow solutions of Research, Analytics and Trading, Content and Technology Solutions (CTS) and Wealth. FactSet currently serves financial professionals, which include portfolio managers, investment research professionals, investment bankers, risk and performance analysts, wealth advisors and corporate clients. FactSet provides both insights on global market trends and intelligence on companies and industries, as well as capabilities to monitor portfolio risk and performance and to execute trades. The Company combines dedicated client service with open and flexible technology offerings, such as a configurable desktop and mobile platform, comprehensive data feeds, an open marketplace and digital portals and application programming interfaces (APIs). The Company's revenue is primarily derived from subscriptions to products and services such as workstations, analytics, enterprise data, and research management. FactSet Research Systems was founded by Howard E. Wille and Charles J. Snyder in September 1978 and is headquartered in Norwalk, CT.
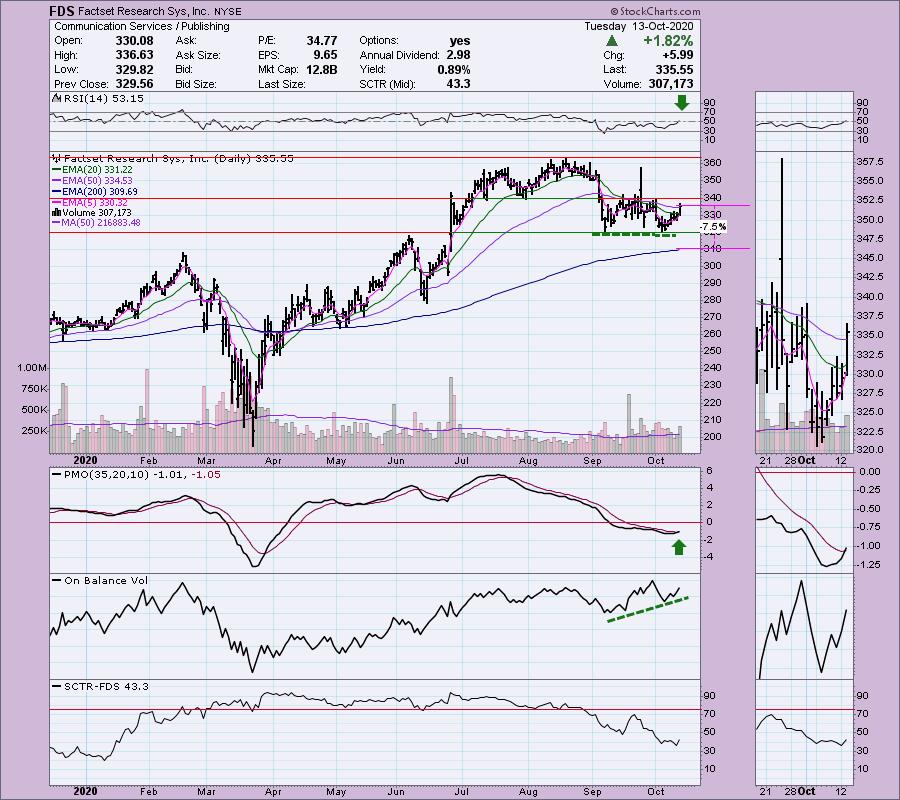
That's quite a description or novel on what this company is about which I suppose makes some sense given it is a "Publishing" company. It's been in a sideways trading range for some time. Volume is picking up and has been above its 50-MA since September. This has caused a nice positive divergence with the OBV. The RSI just turned positive and the PMO just had a crossover BUY signal. SCTR isn't optimum, but it isn't in the basement either.
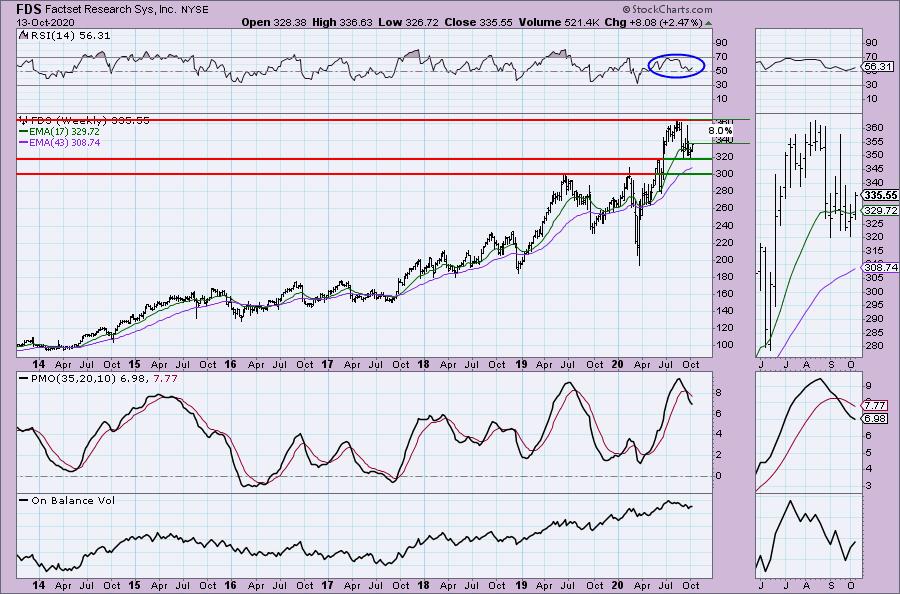
The weekly PMO leaves a lot to be desired, but the RSI has been in positive territory. Might want to concentrate on this one for the shorter term rather than the longer term.
Fiesta Restaurant Group, Inc. (FRGI)
EARNINGS: 11/4/2020 (AMC)
Fiesta Restaurant Group, Inc. is a holding company, which engages in the acquisition, operation, and franchising of fast-casual restaurants. It operates through the following segments: Pollo Tropical, Taco Cabana, and Other. The Pollo Tropical segment offers fire-grilled and crispy citrus marinated chicken and other freshly prepared tropical-inspired menu items. The Taco Cabana segment specializes in Mexican-inspired food. The Other segment includes corporate-owned property and equipment, advisory fees, and corporate. The company was founded in April 2011 and is headquartered in Dallas, TX.
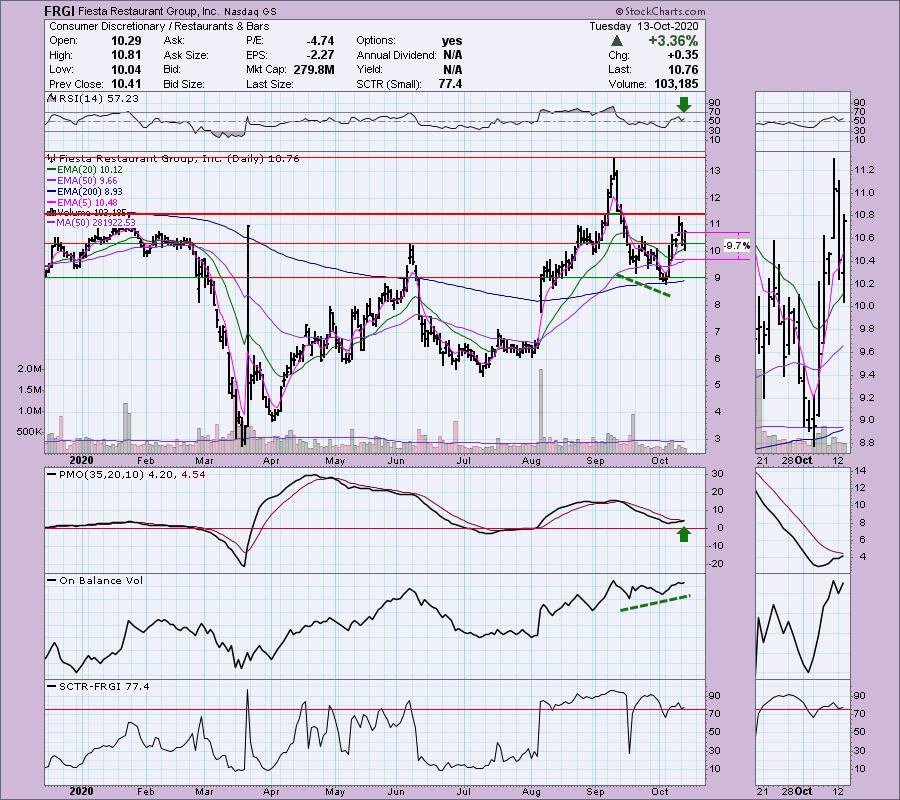
This is a small-cap that is below $12 so I recommend position sizing wisely. I'm taking a bit of a chance on this one, but I liked the upside potential despite the current declining trend of the past two days. The 20-EMA held up as support. The PMO is going in for a crossover BUY signal and the RSI is positive. Look at the lovely OBV positive divergence that set up the recent rally. I have the stop level at about the 50-EMA. Price bounced off the 200-EMA to start this rally which I find very bullish.
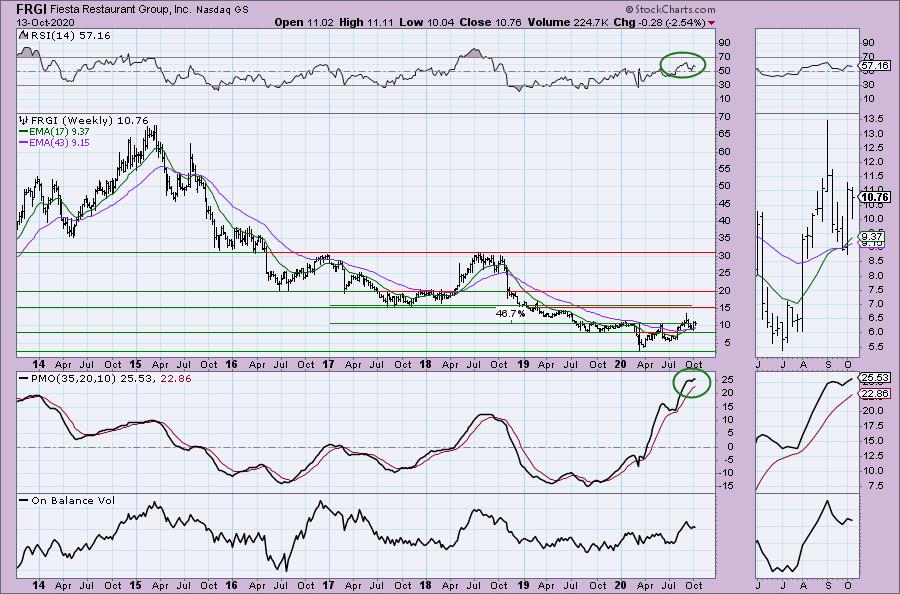
The weekly PMO is overbought, but it just topped above the signal line. The RSI is not overbought and remains in positive territory. If we could get a rally back to the 2017 lows, that would be a +46.5% gain.
Shake Shack Inc. (SHAK)
EARNINGS: 10/29/2020 (AMC)
Shake Shack, Inc. is a holding company, which engages in operating fast food hamburger restaurants. It offers beef burgers, flat-top dogs, chicken sandwiches, frozen custard and crinkle cut fries and includes all the mobile ordering essentials. The company was founded by Daniel Harris Meyer on September 23, 2014 and is headquartered in New York, NY.
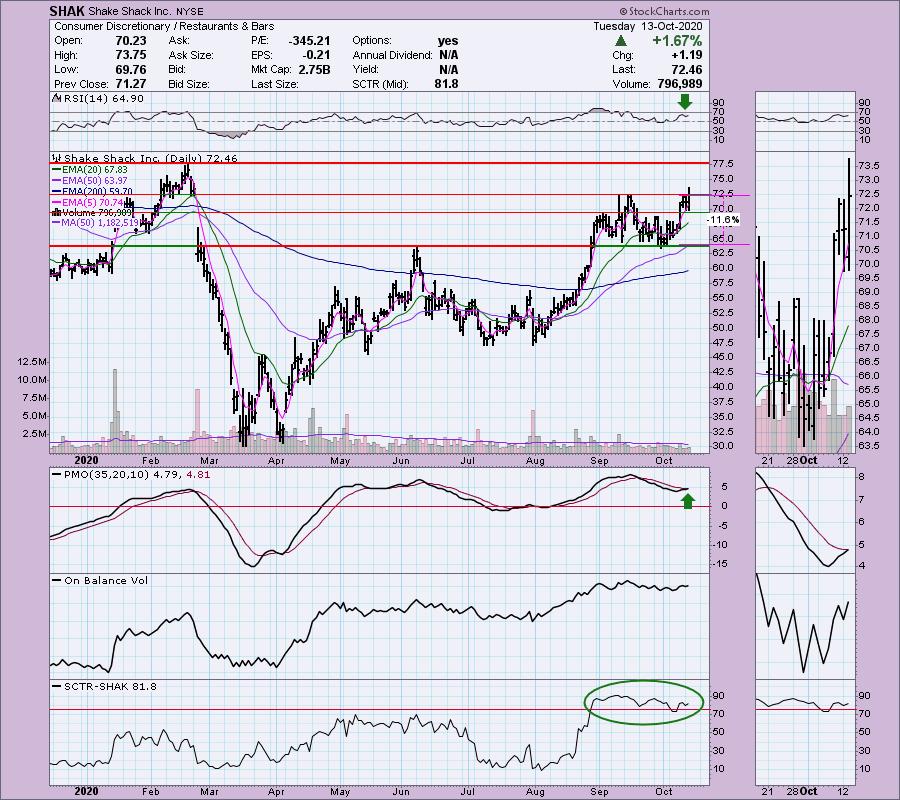
I'm not a point and figure chart girl, but when I did the symbol summary on this one today, it noted that SHAK triggered three bullish P&F patterns: "Double-Top Breakout", "Triple Top Breakout" and "Quadruple Top Breakout". That sounds pretty good. SHAK did breakout today. The PMO is about to trigger a BUY signal and the RSI is positive. Setting a stop on this one is tough. If you go to major support, it is over 11.5%. I would likely lose interest if it dropped below the 20-EMA. Or better choice, use a 5-minute bar chart to time an entry that would allow you to set the same price level stop, but at a smaller percentage.
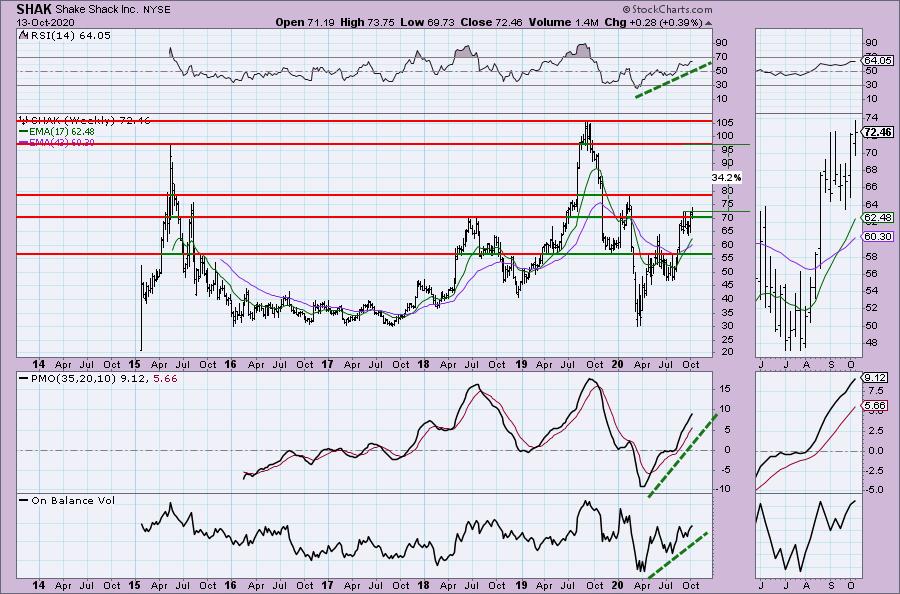
Nothing wrong with the weekly chart. If we could get back to the 2015 top, that would be a 34.2% gain.
Full Disclosure: I won't be adding to my positions. I do own Disney (DIS) but have a trailing stop set. I'm about 50% invested and 50% is in 'cash', meaning in money markets and readily available to trade with.
Current Market Outlook:
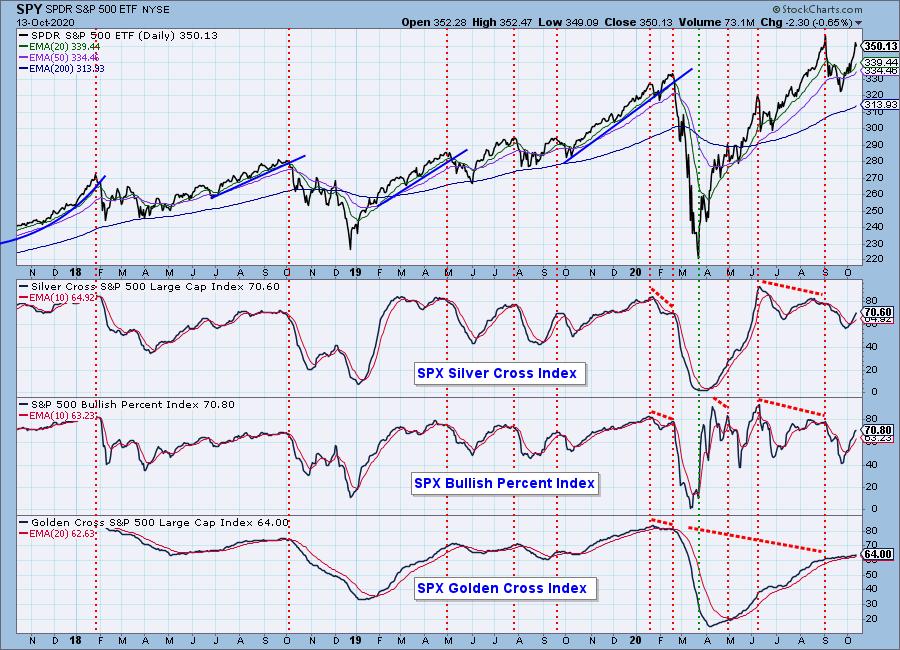
Market Environment: It is important to consider the odds for success by assessing the market tides. The following chart uses different methodologies for objectively showing the depth and trend of participation for intermediate- and long-term time frames.
- The Silver Cross Index (SCI) shows the percentage of SPX stocks on IT Trend Model BUY signals (20-EMA > 50-EMA)
- The Golden Cross Index (GCI) shows the percentage of SPX stocks on LT Trend Model BUY signals (50-EMA > 200-EMA)
- The Bullish Percent Index (BPI) shows the percentage of SPX stocks on Point & Figure BUY signals.
Don't forget that as a "Diamonds" member, you have access to our GCI/SCI curated ChartList on DecisionPoint.com. You'll find it under "Members Only" links on the left side on the Blogs and Links Page.
Here is the current chart:
Diamond Index 10/13:
- Diamond Scan Results: 9
- Diamond Dog Scan Results: 5
- Diamond Bull/Bear Ratio: 1.80
Technical Analysis is a windsock, not a crystal ball.
Happy Charting!
- Erin
erin@decisionpoint.com
Watch the latest episode of DecisionPoint with Carl & Erin Swenlin on Mondays 7:00p EST or on the DecisionPoint playlist on the StockCharts TV YouTube channel here!
NOTE: The stocks reported herein are from mechanical trading model scans that are based upon moving average relationships, momentum and volume. DecisionPoint analysis is then applied to get five selections from the scans. The selections given should prompt readers to do a chart review using their own analysis process. This letter is not a call for a specific action to buy, sell or short any of the stocks provided. There are NO sure things or guaranteed returns on the daily selection of "diamonds in the rough."
Helpful DecisionPoint Links:
DecisionPoint Shared ChartList and DecisionPoint Chart Gallery
Price Momentum Oscillator (PMO)
Swenlin Trading Oscillators (STO-B and STO-V)
For more links, go to DecisionPoint.com!