
Today the Diamond PMO Scan had only one result (WKHS) which I didn't like because it is in a short-term parabolic move and is now very overbought. Since I wanted more results, I decided to use my Momentum Sleepers Scan. I had about 45 stocks to review with that particular scan and I found five stocks within those results that could be "diamonds in the rough". The market made a turnaround today, but I'm not ready to add any new positions until I know this technology slaughter is truly over.
 Diamond Mine Information:
Recording from Friday (9/4/2020) is at this link. The password to view the recording is: 4DDe4g8+
Register in advance for the next "DecisionPoint Diamond Mine" trading room on Friday (9/11) 12:00p EST:
Here is this week's registration link. Password: wisdom
Please do not share these links! They are for Diamonds subscribers ONLY!

Click here to register in advance for the recurring free DecisionPoint Trading Room (Next one is 9/14)! Did you miss the 8/31 trading room? Here is a link to the recording (password: V#^P89Yv).
Welcome to DecisionPoint Daily Diamonds, wherein I highlight five "diamonds in the rough." These are selected from the results of my DecisionPoint scans, which search for stocks that could benefit from the trend and condition of the market. Remember, these are not recommendations to buy or sell, but are the most interesting of the stocks that surfaced in my scans. My objective is to save you the work of the initial, tedious culling process, but you need to apply your own analysis to see if these stocks pique your interest as well. There are no guaranteed winners here!
Atreca Inc (BCEL)
EARNINGS: 11/12/2020 (BMO)
Atreca, Inc. is a biopharmaceutical company. It develops novel therapeutics and immunotherapies based on a deep understanding of the human immune response. Its technology leverages next-generation sequencing to identify the set of functional antibodies produced in patients during an immune response. The company was founded by Robert Axtell, Guy Cavet, Jeremy Sokolove, Tito A. Serafini, Paulette A. Dillon, Daniel Emerling, Wayne Volkmuth, Jonathan Woo, Yann Chong Tan, William H. Robinson and Lawrence J. Steinman on June 11, 2010 and is headquartered in South San Francisco, CA.
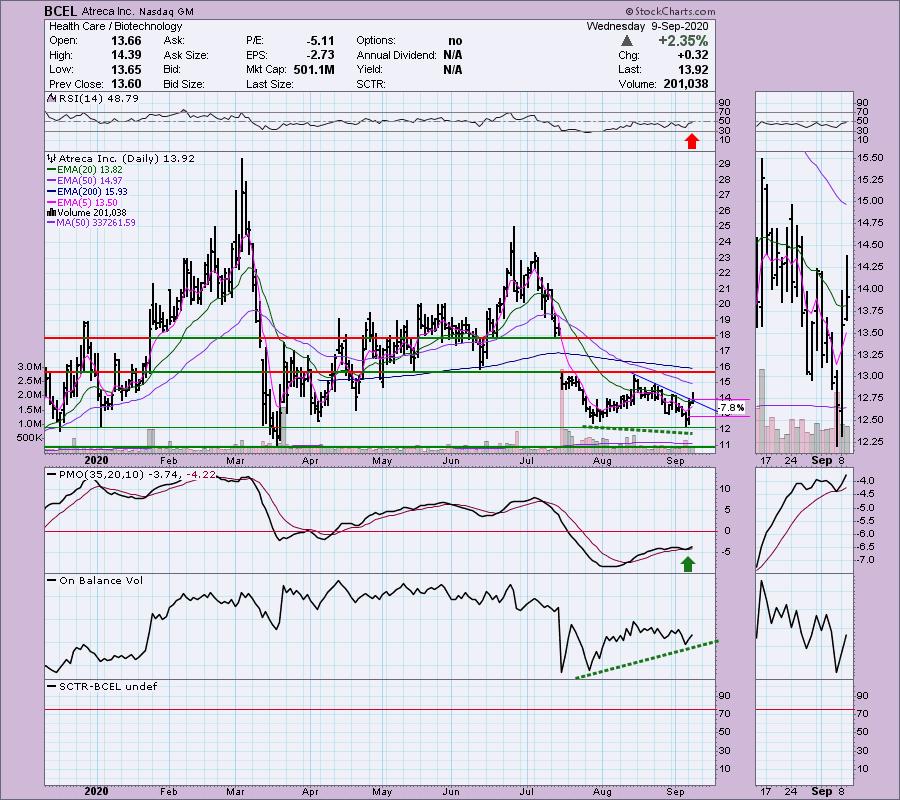
I thought this one was very interesting. We had a breakout today from a short-term declining trend. The OBV has a positive divergence with price bottoms. It appears we could be seeing the formation of a bullish double-bottom. The PMO has turned up above its signal line which I always find especially bullish. The RSI is still negative, but it is getting close to positive territory. I put a stop in at the late August low just to keep it from being the 12% it would be if we took it down to $12.
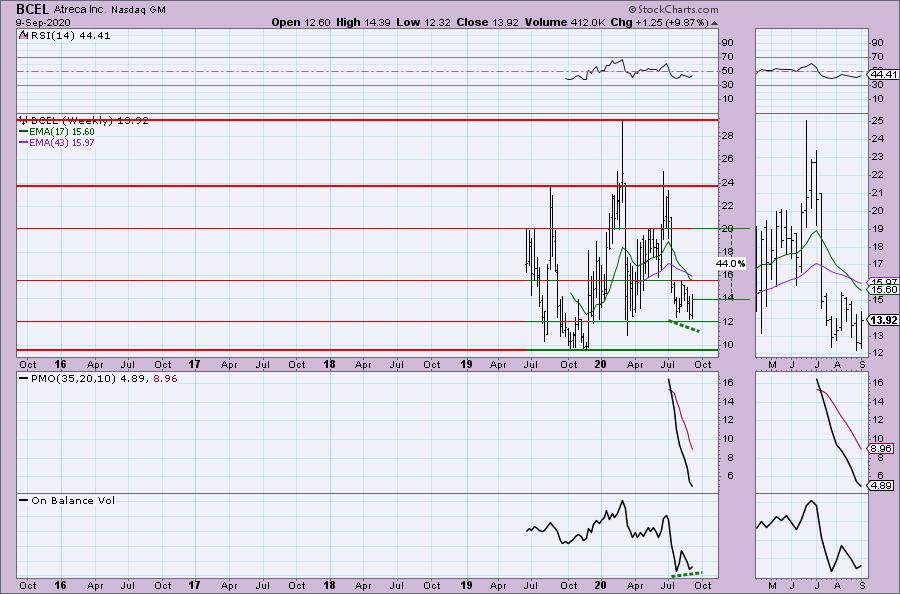
The weekly PMO is in decline, but we don't have a lot of data here to draw any conclusions except that momentum is negative. I did note the positive OBV divergence on the weekly chart. Even if price only made it the $16 area, that would be more than a 12% gain, but if it gets up past that resistance level, I could see it moving up to test the $20 resistance line.
Benefitfocus Inc (BNFT)
EARNINGS: 11/5/2020 (AMC)
Benefitfocus, Inc. engages in the provision of cloud-based benefits management platform for consumers, employers, insurance carriers, and brokers. The company was founded by Mason R. Holland and Shawn A. Jenkins in June 2000 and is headquartered in Charleston, SC.
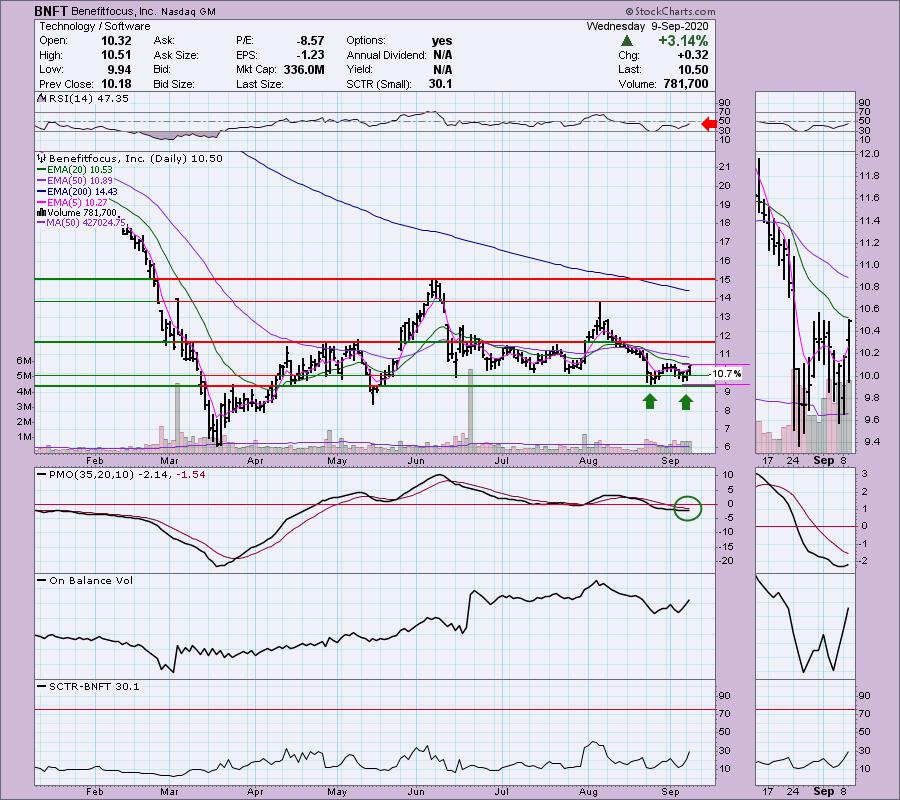
BNFT finished after hours trading up 0.10%. We have another double-bottom forming here. Notice that price didn't have to go down to the level of the previous low. That is generally a bullish sign. The RSI is negative but rising. OBV bottoms are confirming the current rally. The PMO has turned up. The stop could be set below the second bottom or the first bottom. Just know that using the first bottom will mean a fairly deep stop.
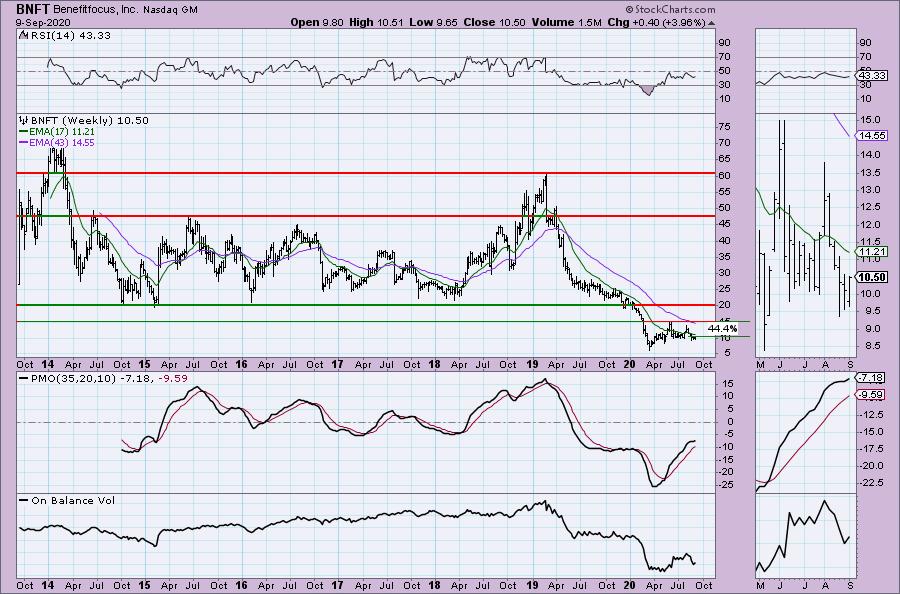
The weekly PMO was turning down, but it is now rising again. A move to the $15 resistance level would still be a 44% plus gain.
Don't forget, on Thursdays I look at reader-requested symbols, so shoot me an email at erin@decisionpoint.com. I read every email I receive and try to answer them all!
Fresh Del Monte Produce (FDP)
EARNINGS: 10/27/2020 (BMO)
Fresh Del Monte Produce, Inc. engages in production and distribution of fresh fruit and vegetables products. It operates through the following segments: Bananas and Fresh and Value-added products segments. The Bananas segment produces banana. The Fresh and Value-added products segment includes sales of pineapples, melons, non-tropical fruit (including grapes, apples, citrus, blueberries, strawberries, pears, peaches, plums, nectarines, cherries and kiwis), other fruit and vegetables, avocados, fresh-cut fruit and vegetables, prepared fruit and vegetables, juices, other beverages, prepared meals and snacks. The company was founded in 1886 and is headquartered in Coral Gables, FL.
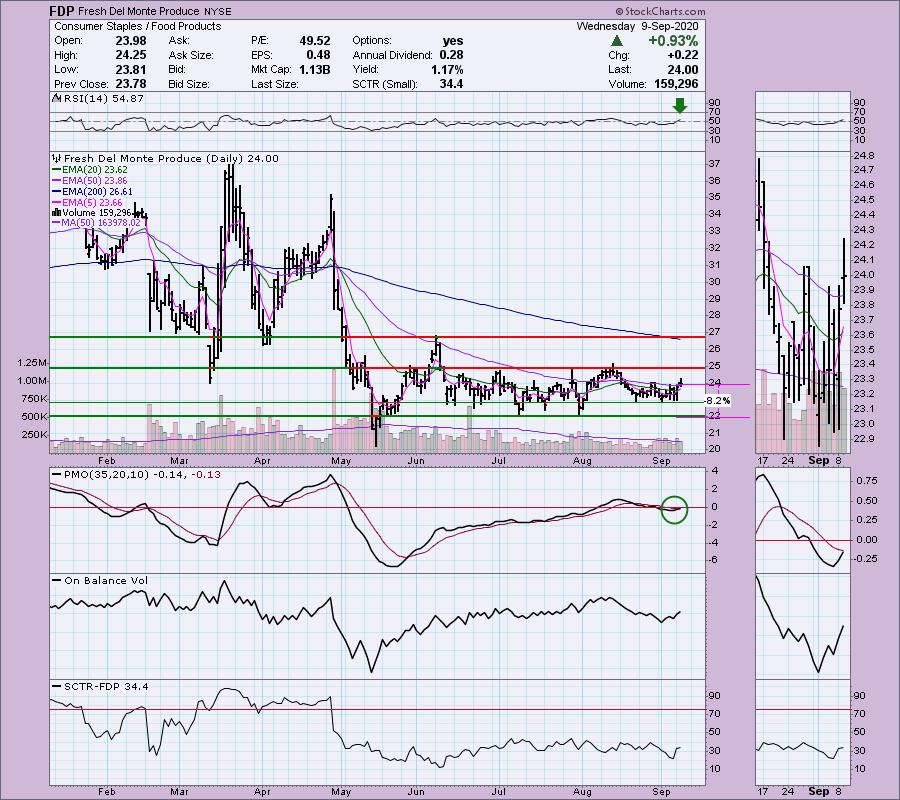
This one hasn't been very exciting, but I believe it is going to at least challenge the June top. The PMO has just about triggered a crossover BUY signal and the RSI just entered positive territory. The OBV is confirming this short-term rally with rising bottoms. The stop could be set below $22.
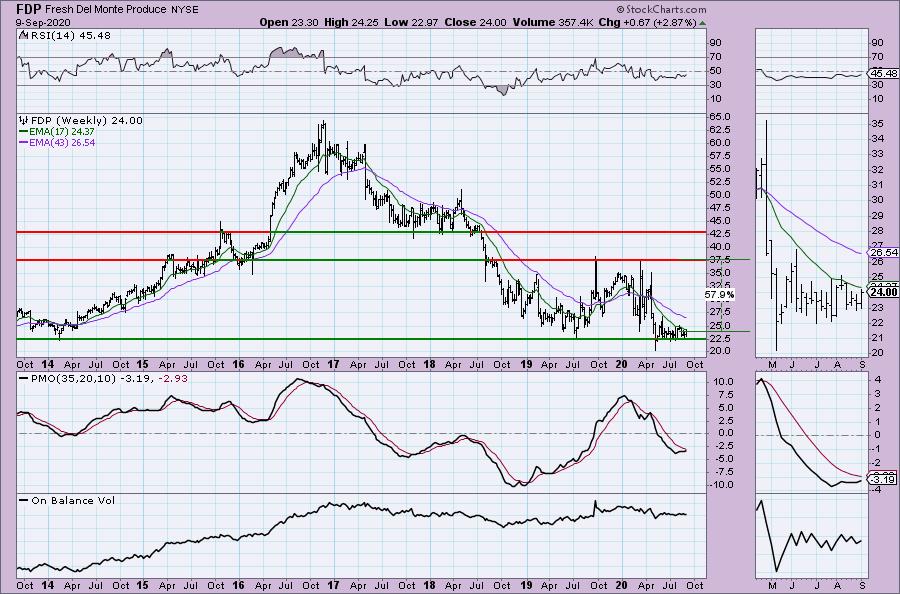
The weekly PMO is rising and nearing a crossover BUY signal. The RSI isn't great, but as I noted before, OBV bottoms are confirming the rising trend out of the May low. Upside potential is significant if FDP can get it going.
Flexion Therapeutics Inc (FLXN)
EARNINGS: 11/5/2020 (AMC)
Flexion Therapeutics, Inc. operates as a biopharmaceutical company, which engages in the development and commercialization of novel and local therapies. It specializes in the treatment of patients with musculoskeletal conditions including osteoarthritis. It offers products under the Zilretta brand. The company was founded by Michael D. Clayman and Neil Bodick on November 5, 2007 and is headquartered in Burlington, MA.
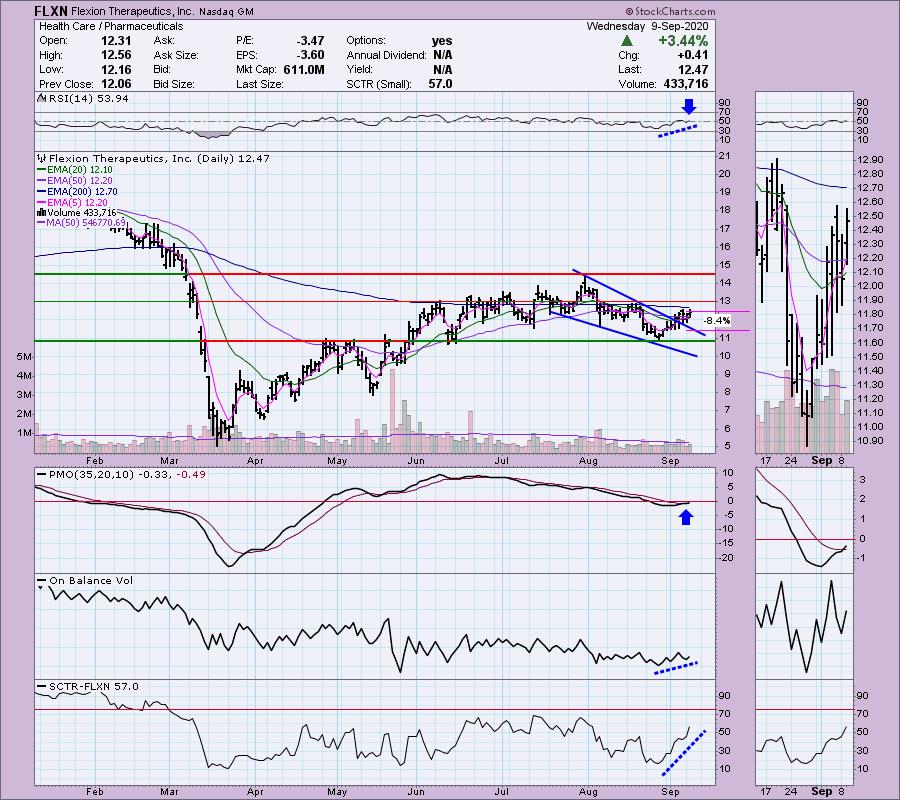
FLXN executed a bullish falling wedge pattern. The 200-EMA could be a problem, but given the new PMO BUY signal, rising RSI and confirming OBV rising bottoms, I am looking for a test of the late July top. I set the stop level at the early August low.
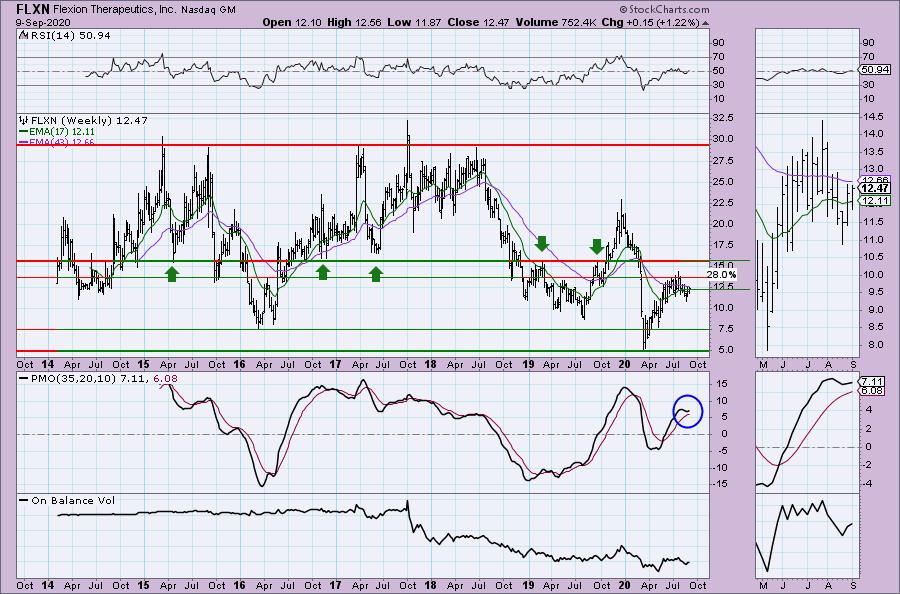
The weekly PMO has turned up above its signal line which is very bullish. I also think you could make a case for a bull flag. The strongest resistance will likely be just above $16 given the number of "touches" on that resistance line. That would still give us a 28% gain.
Hollysys Automation Technologies Ltd (HOLI)
EARNINGS: 11/12/2020
HollySys Automation Technologies Ltd. is a holding company, which engages in the provision of automation control system solutions. It operates through the following segments: Industrial Automation, Rail Transportation, Mechanical and Electrical Solution; and Miscellaneous. The Industrial Automation segment consists of third-party hardware-centric products such as instrumentation and actuators; its proprietary software-centric distributed control systems and programmable logic controller; and valued-added software packages. The Rail Transportation segment includes train control center and automation train protection. The Mechanical and Electrical Solution segment offers design, engineering, procurement, project management, construction and commissioning, and maintenance related services to railway transportation. The company was founded by Bai Qing Shao, Chang Li Wang, and An Luo in March 1993 and is headquartered in Beijing, China.
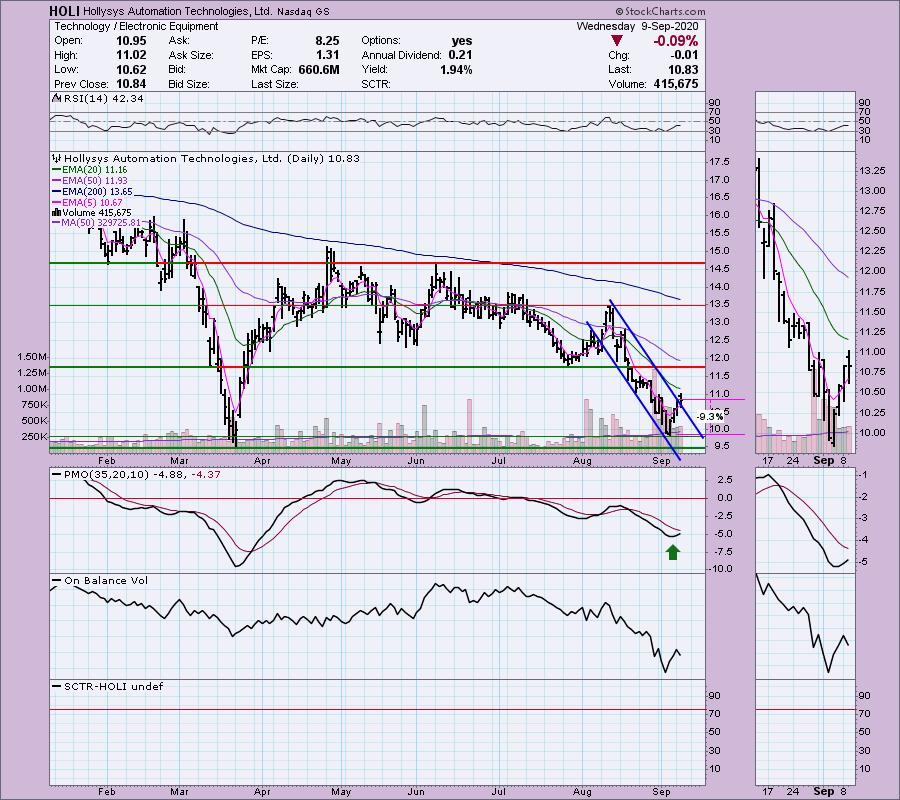
It may appear to be a bullish falling wedge, but it is actually a declining trend channel. Today price broke out of it intraday despite closing lower. The PMO looks good and volume does appear to be coming in given the OBV's strong move higher. The stop level is a bit deep.
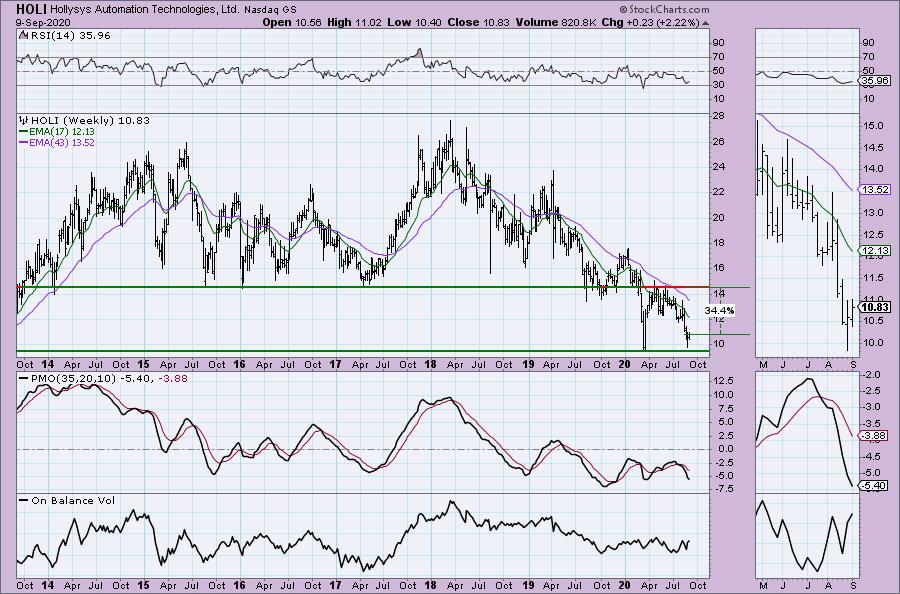
The weekly PMO and RSI are negative, so it might not be a great intermediate-term investment. However, if it can continue this breakout rally, I think a challenge of resistance above $14 is entirely possible and that would mean a 34%+ gain.
Full Disclosure: I do not trust the market right now and am not adding any new positions. I'm about 50% invested and 50% is in 'cash', meaning in money markets and readily available to trade with.
Current Market Outlook:
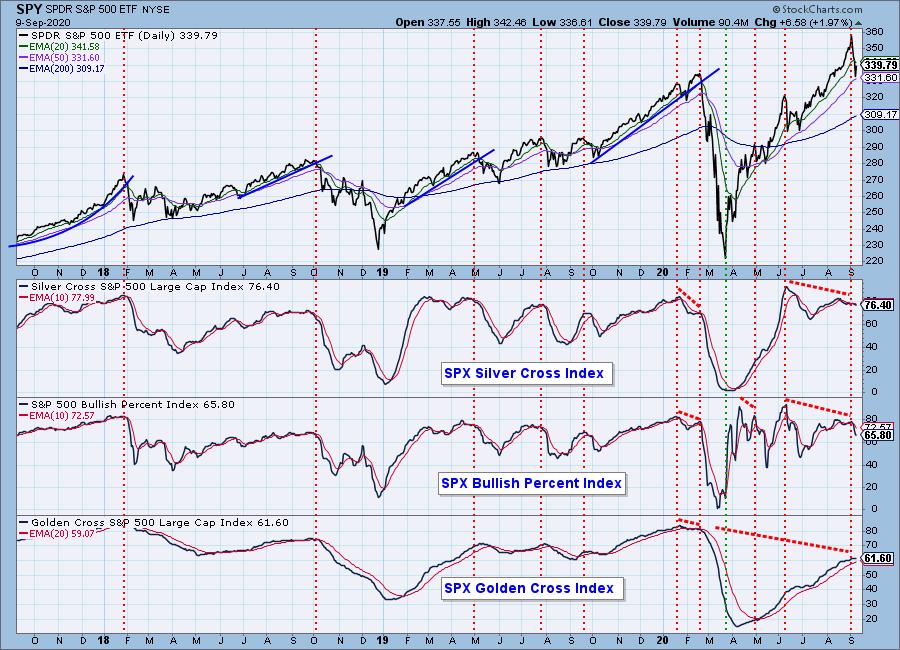
Market Environment: It is important to consider the odds for success by assessing the market tides. The following chart uses different methodologies for objectively showing the depth and trend of participation for intermediate- and long-term time frames.
- The Silver Cross Index (SCI) shows the percentage of SPX stocks on IT Trend Model BUY signals (20-EMA > 50-EMA)
- The Golden Cross Index (GCI) shows the percentage of SPX stocks on LT Trend Model BUY signals (50-EMA > 200-EMA)
- The Bullish Percent Index (BPI) shows the percentage of SPX stocks on Point & Figure BUY signals.
Don't forget that as a "Diamonds" member, you have access to our GCI/SCI curated ChartList on DecisionPoint.com. You'll find it under "Members Only" links on the left side on the Blogs and Links Page.
Here is the current chart:
Diamond Index:
- Diamond Scan Results: 1
- Diamond Dog Scan Results: 13
- Diamond Bull/Bear Ratio: 0.08
Technical Analysis is a windsock, not a crystal ball.
Happy Charting!
- Erin
erin@decisionpoint.com
Watch the latest episode of DecisionPoint with Carl & Erin Swenlin on Mondays 7:00p EST or on the DecisionPoint playlist on the StockCharts TV YouTube channel here!
NOTE: The stocks reported herein are from mechanical trading model scans that are based upon moving average relationships, momentum and volume. DecisionPoint analysis is then applied to get five selections from the scans. The selections given should prompt readers to do a chart review using their own analysis process. This letter is not a call for a specific action to buy, sell or short any of the stocks provided. There are NO sure things or guaranteed returns on the daily selection of "diamonds in the rough."
Helpful DecisionPoint Links:
DecisionPoint Shared ChartList and DecisionPoint Chart Gallery
Price Momentum Oscillator (PMO)
Swenlin Trading Oscillators (STO-B and STO-V)
For more links, go to DecisionPoint.com!