
It took me at least an hour to go through the 113 Diamond PMO Scan results today! Narrowing it down was very difficult. I did try to spread the love within the sectors and consequently ended up with five different ones. These selections I consider to be "home-centric" as they all have to do with nesting and building. From software for the office, to building supplies/home improvement to telecom, all had strong contenders.
Software still had a large presence in the scan results today and I ended up with one that I preferred to the others. Solar and renewable energy have been killing it! Sunrun (RUN) is a favorite of mine but it is so ridiculously overbought right now. Of course I keep watching it soar higher everyday <rolling eyes>. Instead of RUN, I found another renewable energy stock that isn't quite as overbought and has some nice upside potential. I'm still watching RUN though!
Today's "Diamonds in the Rough": BECN, BLD, CDNS, QCOM, and SPWR.
 Diamond Mine Information:
Recording from 9/25/2020 is at this link. Access Passcode: w+*x#H00
Register in advance for the next "DecisionPoint Diamond Mine" trading room on Friday (10/2/2020) 12:00p ET:
Here is this week's registration link. Password: bull-bear
Please do not share these links! They are for Diamonds subscribers ONLY! For best results, copy and paste the passwords.


Don't miss the October 5th free DP Trading Room! I will have guest Julius de Kempenaer from RRG Research. He will show us how he uses RRG to trade!
***Click here to register for this recurring free DecisionPoint Trading Room!***
Did you miss the 9/28 trading room? Here is a link to the recording (password: FT&&l3#K). For best results, copy and paste the password to avoid typos.
Welcome to DecisionPoint Daily Diamonds, wherein I highlight five "diamonds in the rough." These are selected from the results of my DecisionPoint scans, which search for stocks that could benefit from the trend and condition of the market. Remember, these are not recommendations to buy or sell, but are the most interesting of the stocks that surfaced in my scans. My objective is to save you the work of the initial, tedious culling process, but you need to apply your own analysis to see if these stocks pique your interest as well. There are no guaranteed winners here!
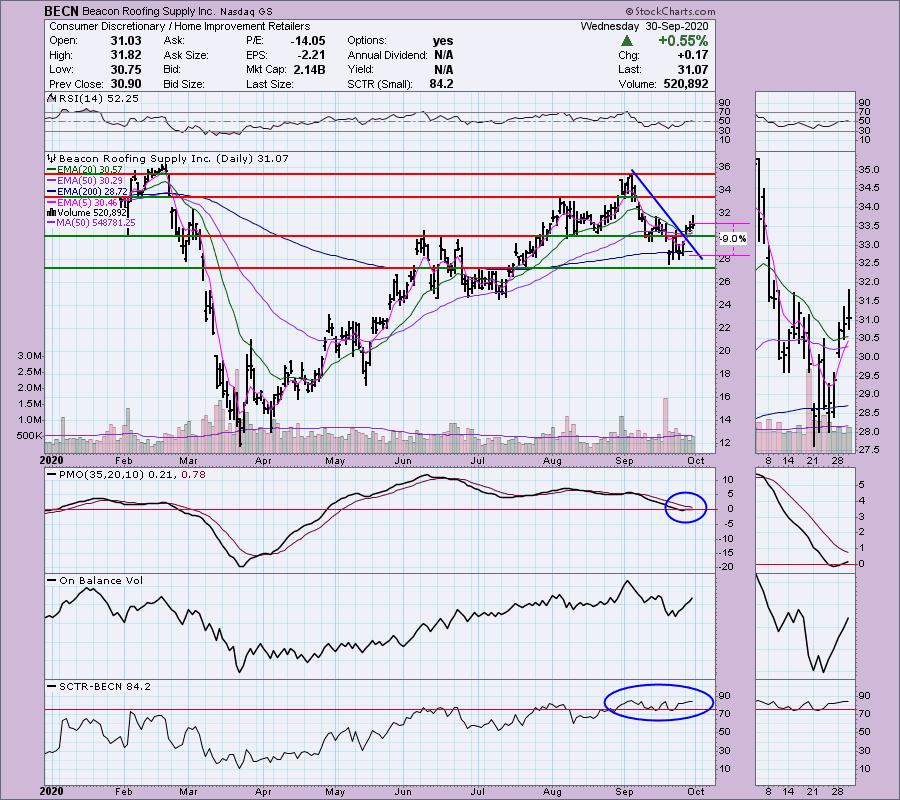
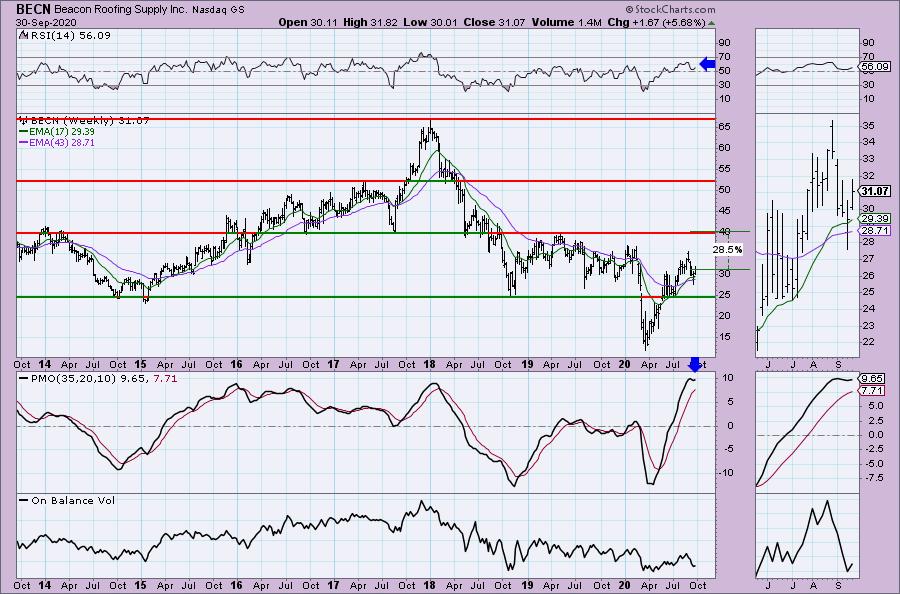
Beacon Roofing Supply Inc. (BECN)
EARNINGS: 11/25/2020 (AMC)
Beacon Roofing Supply, Inc. engages in the distribution of residential and non-residential roofing materials. It also distributes complementary building products including siding, windows, specialty exterior building products, insulation, and waterproofing systems for building exteriors. The company was founded on August 22, 1997 and is headquartered in Herndon, VA.
BECN had a nice breakout on Monday. The RSI just reached positive territory and the PMO has turned up and moved above the zero line. Volume is definitely coming in. The SCTR is strong. The 9% stop gives price room to fall below the 200-EMA, but not that far.
The weekly PMO had begun to top, but with this week's strong price action, it is turning back up.
TopBuild Corp. (BLD)
EARNINGS: 11/3/2020 (BMO)
TopBuild Corp. is an installer and distributor of insulation products and other building products to the U.S. construction industry. It operates through two segments: Installation and Distribution. The Installation segment provides insulation installation services nationwide through its TruTeam contractor services business branches located in the U.S. The Distribution segment distributes insulation and other building products, including rain gutters, fireplaces, closet shelving, and roofing materials through its Service Partners business. The company was founded in February 2015 and is headquartered in Daytona Beach, FL.
I really like the breakout on BLD. It is coming with a positive RSI and a rising PMO. The OBV is confirming the upside move with rising bottoms to match price bottoms. The SCTR is very strong. Looking at the "personality" of this stock, the 50-EMA is where BLD finds support. If it drops well-below it, it is time to look elsewhere. Consequently, you made to give this one a longer leash or deeper stop.
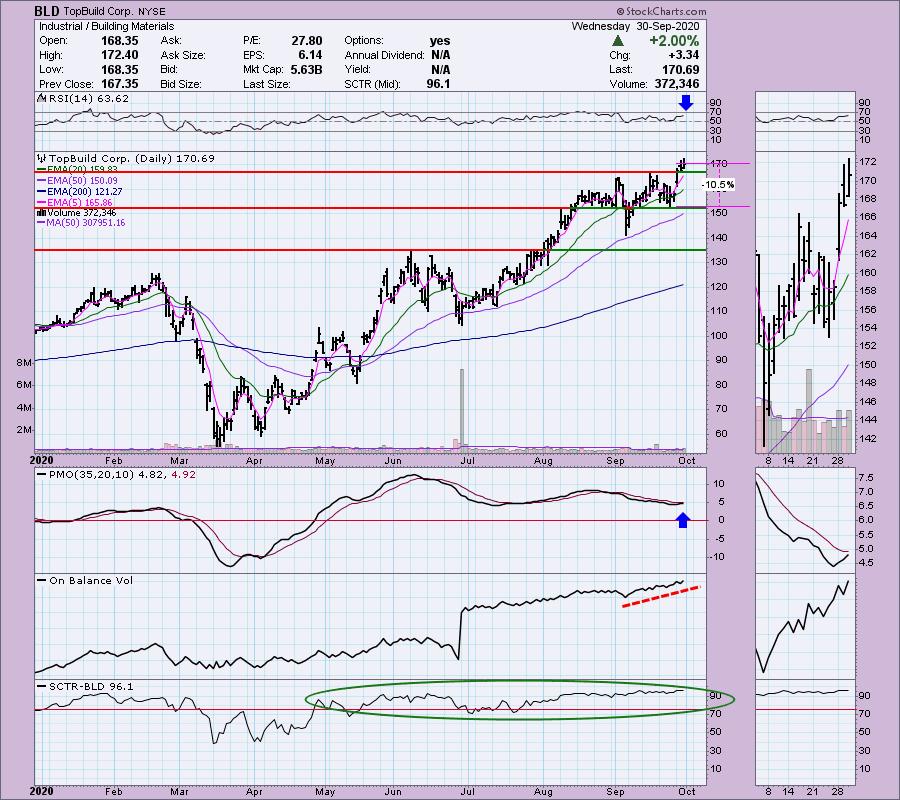
Given the strong weekly PMO and RSI, this one could be a potential intermediate-term investment. I set very deep stops on my IT investments because I'm counting on the current trend and momentum to continue. Looking at the weekly chart, you could set a very deep stop at $125 or $135. You can see what to look for on a weekly chart to give you warning prior to big bearish declines in the intermediate term. Additionally, you can see what to look for to spot bottoms.

Don't forget, on Thursdays I look at reader-requested symbols, so shoot me an email at erin@decisionpoint.com. I read every email I receive and try to answer them all!
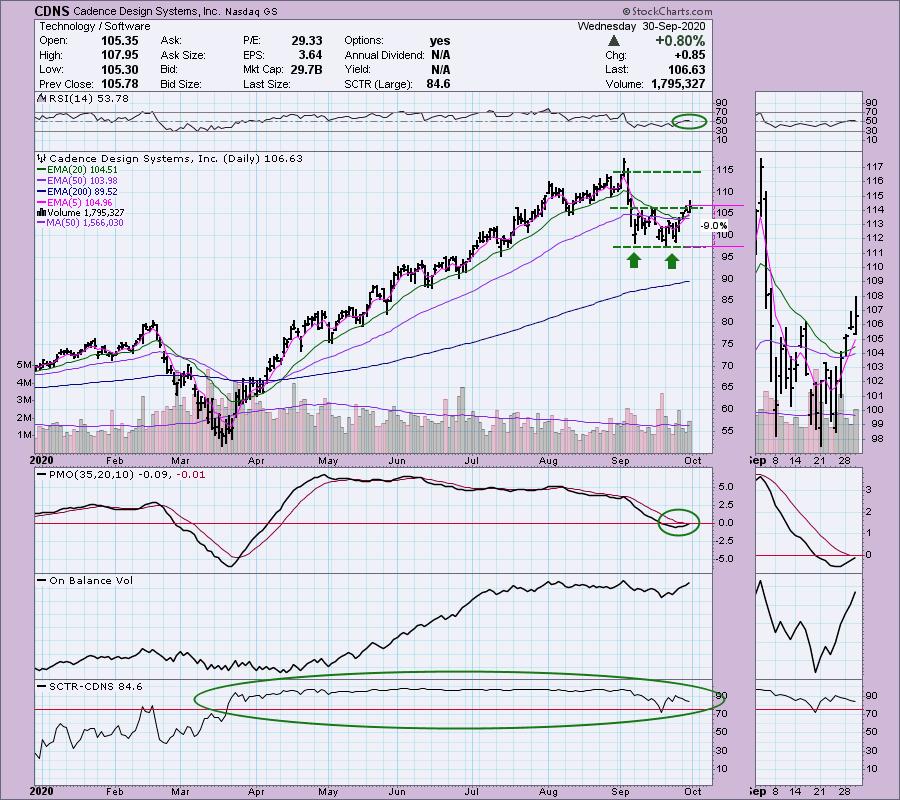
Cadence Design Systems, Inc. (CDNS)
EARNINGS: 10/19/2020 (AMC)
Cadence Design Systems, Inc. engages in the design and development of integrated circuits and electronic devices. Its products include electronic design automation, software, emulation hardware, and intellectual property, commonly referred to as verification IP, and design IP. The company was founded by Alberto Sangiovanni-Vincentelli, Gudmundur A. Hjartarson, K. Bobby Chao, and K. Charles Janac in June 1988 and is headquartered in San Jose, CA.
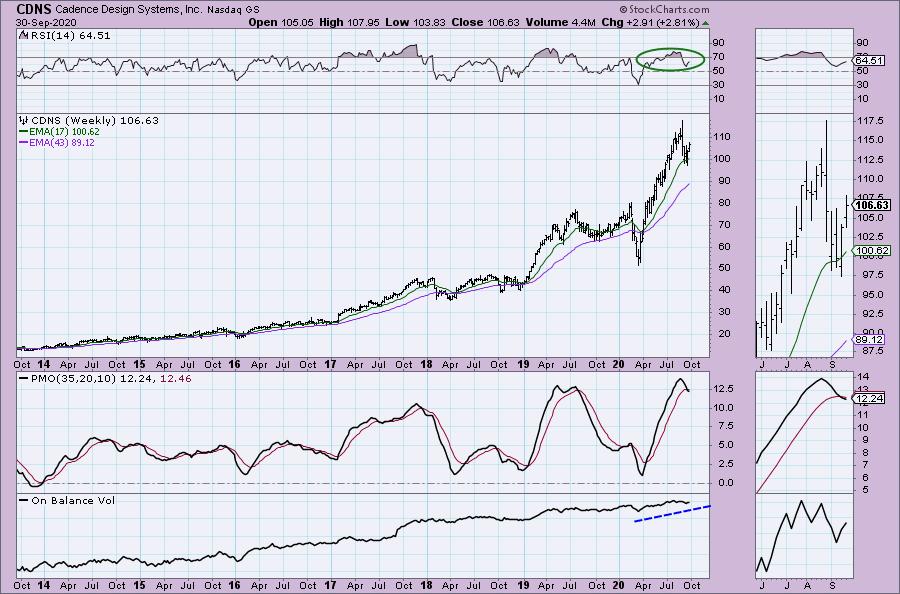
CDNS was a reader requested "diamond in the rough" in the 8/20 Diamond Report. It's down less than 5% so while it looks somewhat ugly on the Technology correction, it's coming back. This looks like an Adam and Eve double-bottom and today's breakout triggered it. The minimum upside target for the pattern would put price at about $115. You can set a stop below the September lows. The PMO is nearing a crossover BUY signal and the RSI just entered positive territory. Volume is coming in. If I had a complaint it is the reverse divergence on the OBV. The OBV is getting ready to test the September top, yet price isn't even halfway there yet. So despite a lot of volume, price didn't move much to upside. Price should follow volume. In any case, volume increased today on the breakout which is positive.
The weekly RSI is now out of overbought territory but remains firmly in positive territory above net neutral (50). This sure looks like a very long bull flag. At issue would be the weekly PMO SELL signal. It tells me that you should keep a watchful eye on this one. Should Technology decide to correct again, this one will be vulnerable based on prior price action.
QUALCOMM Inc. (QCOM)
EARNINGS: 11/4/2020 (AMC)
QUALCOMM, Inc. engages in the development, design, and provision of digital telecommunications products and services. It operates through the following segments: Qualcomm CDMA Technologies (QCT), Qualcomm Technology Licensing (QTL), and Qualcomm Strategic Initiatives (QSI). The QCT segment develops and supplies integrated circuits and system software based on technologies for the use in voice and data communications, networking, application processing, multimedia, and global positioning system products. The QTL segment grants licenses and provides rights to use portions of the firm's intellectual property portfolio. The QSI segment focuses on opening new or expanding opportunities for its technologies and supporting the design and introduction of new products and services for voice and data communications. The company was founded by Franklin P. Antonio, Adelia A. Coffman, Andrew Cohen, Klein Gilhousen, Irwin Mark Jacobs, Andrew J. Viterbi, and Harvey P. White in July 1985 and is headquartered in San Diego, CA.
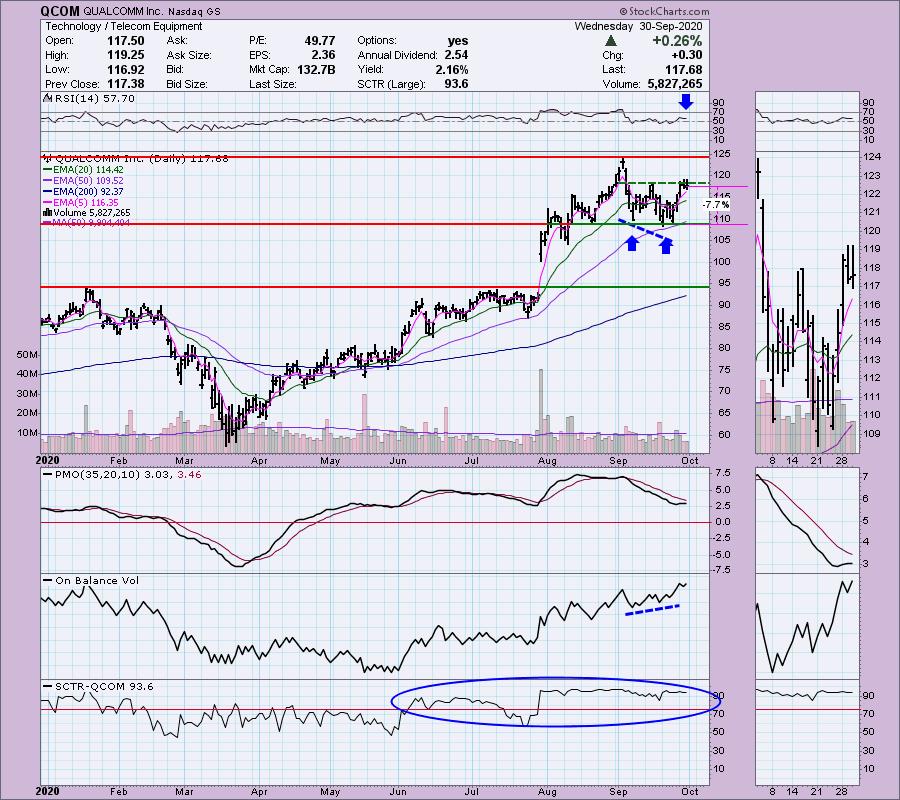
Here is another Adam and Eve double-bottom. In this case there is a very nice positive divergence between the OBV and price. The PMO has decelerated somewhat, but it is positive and has bottomed. The RSI is in positive territory. The minimum upside target of this double-bottom should be get a more decisive breakout would take price to about $130. The SCTR is in the "hot zone" above 75.
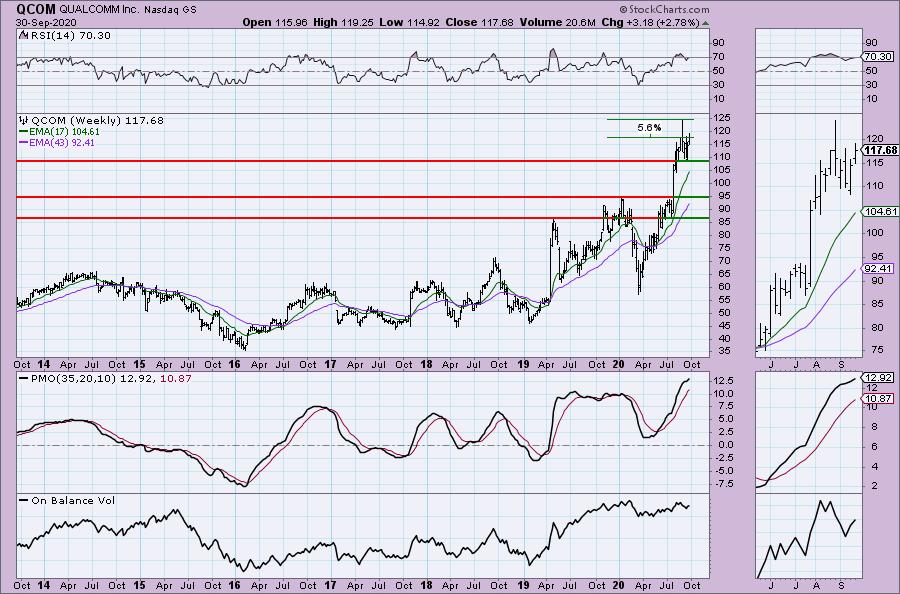
The weekly chart is positive, but the RSI is somewhat overbought. The PMO is overbought, but still rising.
SunPower Corp. (SPWR)
EARNINGS: 11/4/2020 (AMC)
SunPower Corp. engages in the design, manufacture and deliver of solar panels and systems. It operates through the SunPower Energy Services and SunPower Technologies segments: The SunPower Energy Services Segment deals with the sales of solar energy solutions in the North America region including direct sales of turn-key engineering, procurement and construction. The SunPower Technologies Segment involves technology development, worldwide solar panel manufacturing operations, equipment supply to resellers, commercial and residential end-customers outside of North America. The company was founded by Thomas L. Dinwoodie, Robert Lorenzini and Richard M. Swanson in April 1985 and is headquartered in San Jose, CA.
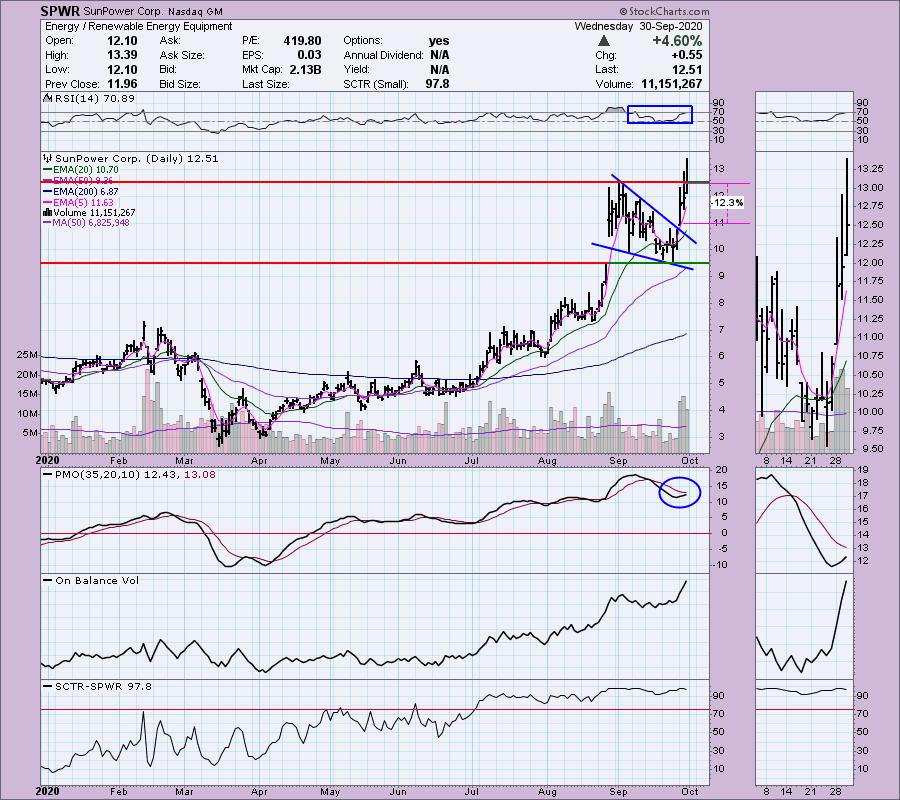
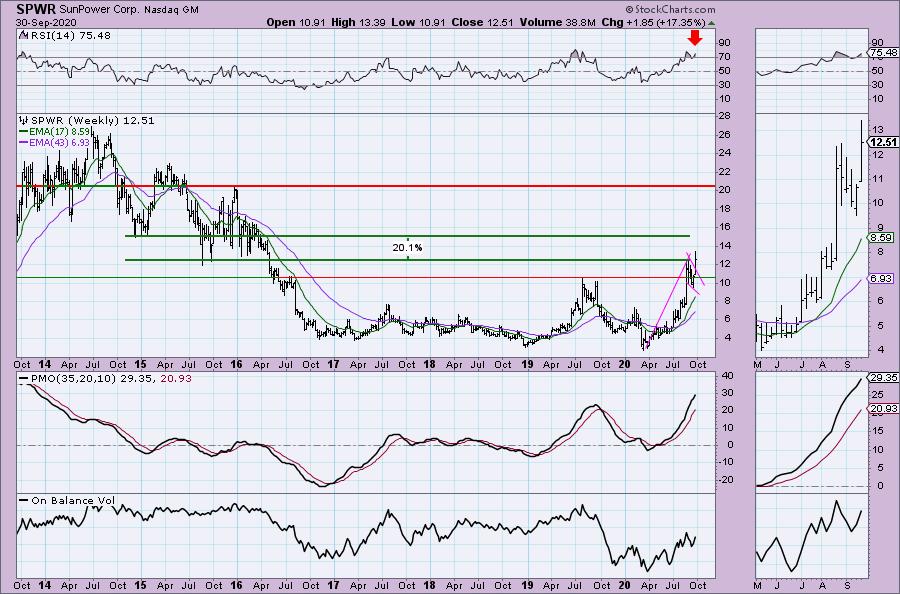
This area of the market has been enjoying a huge rally. I apologize for not getting on top of this sooner, but the stocks weren't hitting my scans. Like I said, I still like SunRun (RUN) and may get into it (I definitely will if there is another pullback), but in the meantime, SPWR is a strong contender. It has broken out of a bullish falling wedge and has now popped above the September top. It was up much higher than this intraday so this mid-day pullback could work to our advantage. The PMO is rising nicely and isn't that overbought. The RSI has remained strong along with the SCTR. Volume has been pouring in and price is following that volume based on the OBV breaking to a new high with price.
The bull flag has been executed this week. The PMO looks great. The RSI is overbought which is a problem, but overbought conditions can persist for weeks. Upside potential is about 64% to the next area of strong overhead resistance. Even if it challenges the 2014 low, that would be a 20% gain.
Full Disclosure: I am not adding any new positions, although I am scoping out SPWR, RUN and BLD intraday tomorrow. I'm about 35% invested and 65% is in 'cash', meaning in money markets and readily available to trade with.
Current Market Outlook:
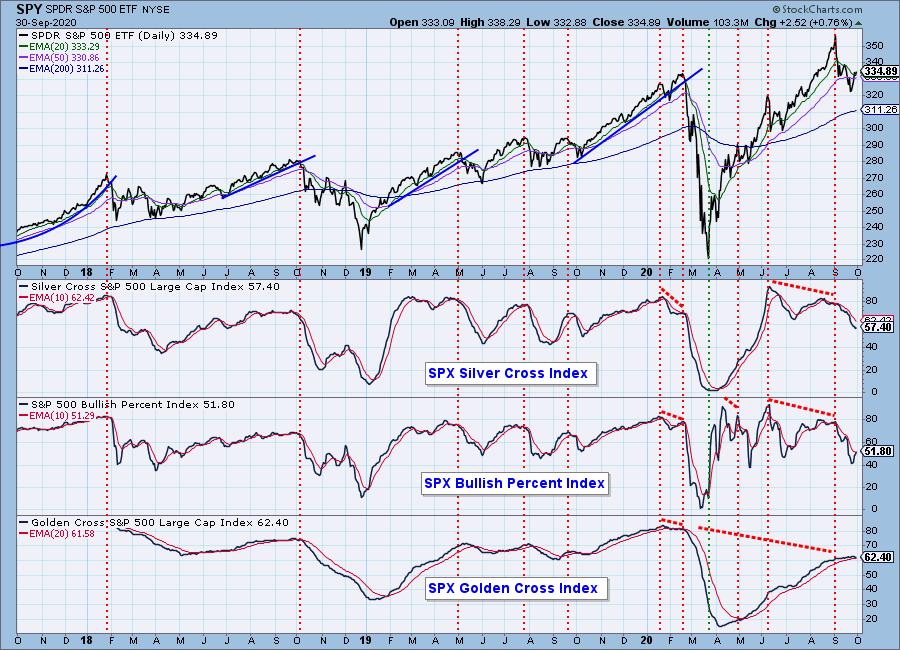
Market Environment: It is important to consider the odds for success by assessing the market tides. The following chart uses different methodologies for objectively showing the depth and trend of participation for intermediate- and long-term time frames.
- The Silver Cross Index (SCI) shows the percentage of SPX stocks on IT Trend Model BUY signals (20-EMA > 50-EMA)
- The Golden Cross Index (GCI) shows the percentage of SPX stocks on LT Trend Model BUY signals (50-EMA > 200-EMA)
- The Bullish Percent Index (BPI) shows the percentage of SPX stocks on Point & Figure BUY signals.
Don't forget that as a "Diamonds" member, you have access to our GCI/SCI curated ChartList on DecisionPoint.com. You'll find it under "Members Only" links on the left side on the Blogs and Links Page.
Here is the current chart:
Diamond Index:
- Diamond Scan Results: 113
- Diamond Dog Scan Results: 6
- Diamond Bull/Bear Ratio: 18.83
Technical Analysis is a windsock, not a crystal ball.
Happy Charting!
- Erin
erin@decisionpoint.com
Watch the latest episode of DecisionPoint with Carl & Erin Swenlin on Mondays 7:00p EST or on the DecisionPoint playlist on the StockCharts TV YouTube channel here!
NOTE: The stocks reported herein are from mechanical trading model scans that are based upon moving average relationships, momentum and volume. DecisionPoint analysis is then applied to get five selections from the scans. The selections given should prompt readers to do a chart review using their own analysis process. This letter is not a call for a specific action to buy, sell or short any of the stocks provided. There are NO sure things or guaranteed returns on the daily selection of "diamonds in the rough."
Helpful DecisionPoint Links:
DecisionPoint Shared ChartList and DecisionPoint Chart Gallery
Price Momentum Oscillator (PMO)
Swenlin Trading Oscillators (STO-B and STO-V)
For more links, go to DecisionPoint.com!