
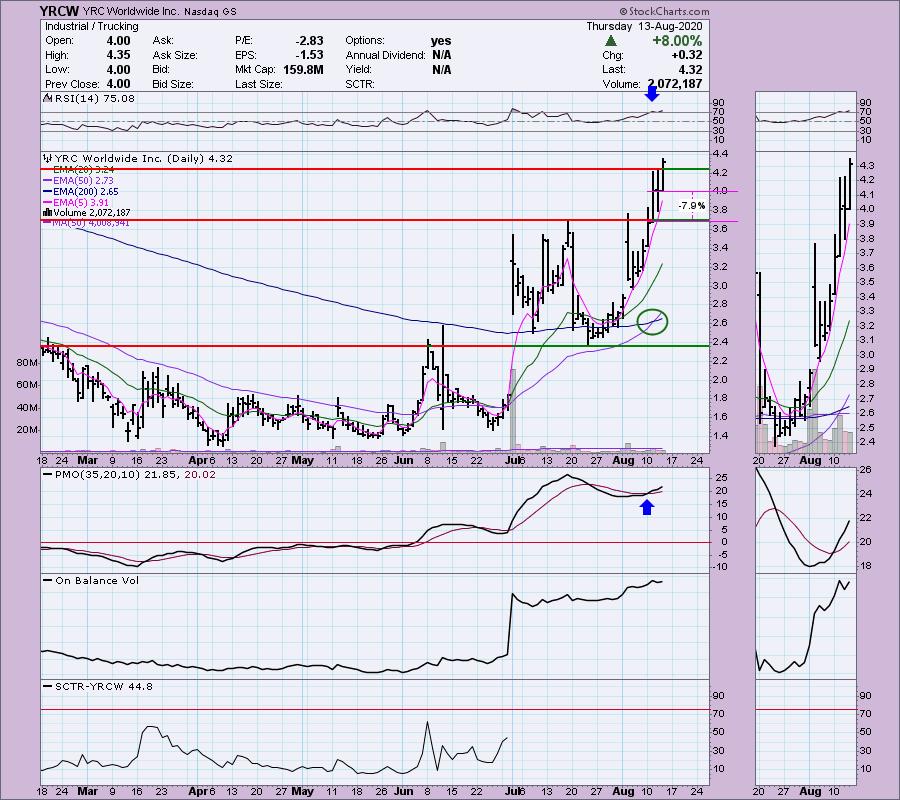
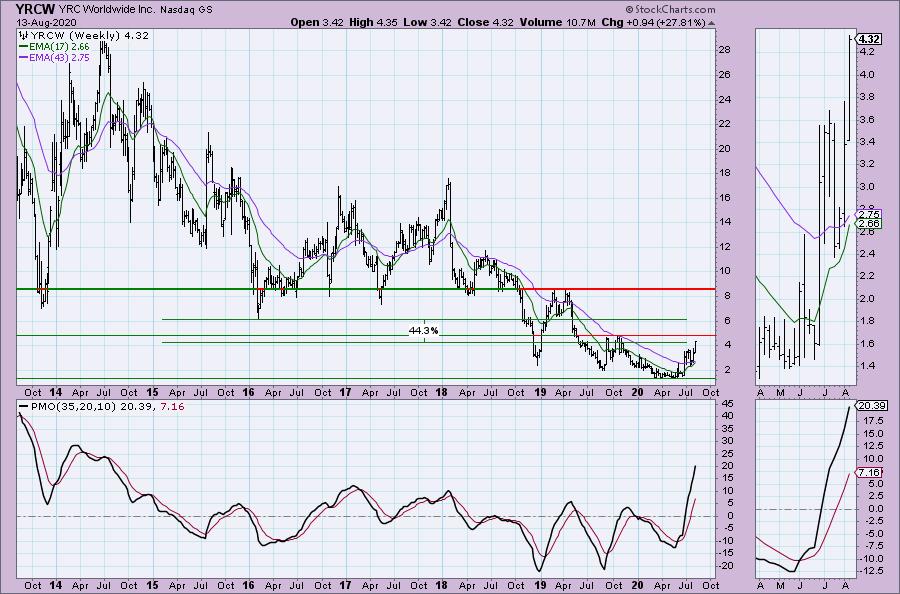
Thank you to readers, Richard, Olivia, Brian & George, for this week's requests. It was a pretty good selection to choose from but there were a few that really stood out to me today. Before I get started though, I want to admit to kicking myself plenty today after yesterday's high volatility bottom fish, YRCW rallied strongly today. I had mentioned I was looking to enter, but by the time I got to it, I'd missed much of today's upside move. However, it still looks interesting to me after a near-term breakout, rising PMO and confirming OBV. I'm not thrilled about the RSI right now which could prevent me from giving this one a try, although I have to admit that weekly chart still looks very enticing. Congratulations to any readers who were able to take the plunge! I decided I would include another very short-term bottom fish at the end of today's article. No promises obviously, but it could be interesting.
** PRICES ARE GOING UP! **
You do NOT need to concern yourself if you're happy with what you have. Your current rate will stay the same as long as your subscription remains in good standing. You can also switch to an annual subscription at anytime where you pay for 10 months and get 12 months.
For our DP Diamond-only subscribers: You should consider our Bundle package. DP Alert Reports will be going up 33% to $40/mo so adding DP Alert later will be more expensive. Bundles currently are $50/mo or $500/yr. If you add DP Alert after August 16th, it will cost you an additional $40/mo or $400/yr for a Bundle total of $65/mo or $650/yr after August 16th!
To summarize, if you don't have the Bundle, subscribe now before it becomes very expensive!
For my Diamonds subscribers, there will be a new 1-hour trading room, "The DecisionPoint Diamond Mine" on Fridays beginning 8/21! It will be an opportunity for us to talk live, review current and past Diamonds for possible entries/exits/stops/targets and take your questions and symbol requests in this intimate trading room. But wait, there's more for Diamonds subscribers! I will be adding a Friday Diamonds Recap where I will look at the performance of that week's Diamonds and their prospects moving forward. Over the weekend we clean the slate and start over again.

Welcome to DecisionPoint Daily Diamonds, wherein I highlight five "diamonds in the rough." These are selected from the results of my DecisionPoint scans, which search for stocks that could benefit from the trend and condition of the market. Remember, these are not recommendations to buy or sell, but are the most interesting of the stocks that surfaced in my scans. My objective is to save you the work of the initial, tedious culling process, but you need to apply your own analysis to see if these stocks pique your interest as well. There are no guaranteed winners here!
Equifax Inc (EFX) - Earnings: 10/21/2020 (AMC)
Equifax, Inc. engages in the provision of information solutions and human resources business process outsourcing services. It operates through the following business segments: U.S. Information Solutions, Workforce Solutions, International, and Global Consumer Solutions. The U.S. Information Solutions segment includes consumer and commercial information services, mortgage loan origination information, financial marketing services, and identity management. The Workforce Solutions segment covers employment, income, and social security number verification services as well as complementary payroll-based transaction and employment tax management services. The International segment offers information, technology, and services to support debt collections and recovery management in Canada, Europe, Latin America, and Asia Pacific. The Global Consumer Solutions segment provides consumer and credit information to resellers.
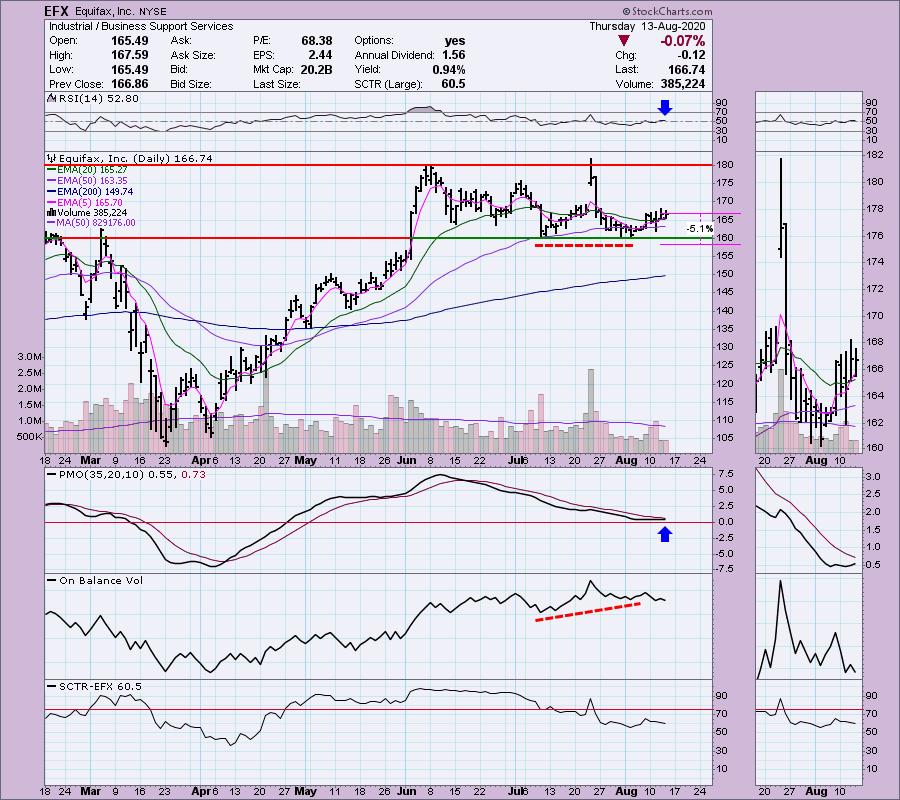
I still like the Industrial sector and this one looks ready to test the top of this trading channel. The RSI just turned positive and the PMO has turned up. You can see we had a bit of a positive divergence with the OBV to begin this current rally. The SCTR is mid-range which is fine, but we want it rising not falling.
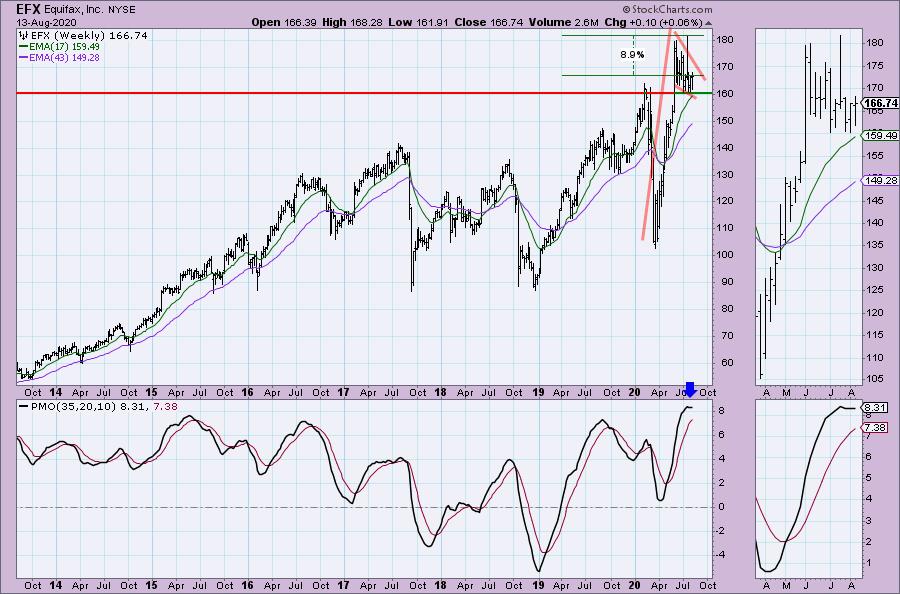
Upside potential could certainly be more than 9%, I just wanted to note how far away EFX is from its all-time high. I like the look of that very large bull flag formation. However, I'm not a fan of that overbought PMO. It does look like it might turn back up which is good.
Enterprise Products (EPD) - Earnings: 10/28/2020 (BMO)
Enterprise Products Partners LP operates as holding company, which engages in the production and trade of natural gas and petrochemicals. It operates through the following segments: NGL Pipelines & Services, Crude Oil Pipelines & Services, Natural Gas Pipelines & Services, and Petrochemical & Refined Products Services. The NGL Pipelines & Services segment manages natural gas processing plants. The Crude Oil Pipelines & Services segment stores and markets crude oil products. The Natural Gas Pipelines & Services segment stores and transports natural gas. The Petrochemical & Refined Products Services segment offers propylene fractionation, butane isomerization complex, octane enhancement, and refined products.
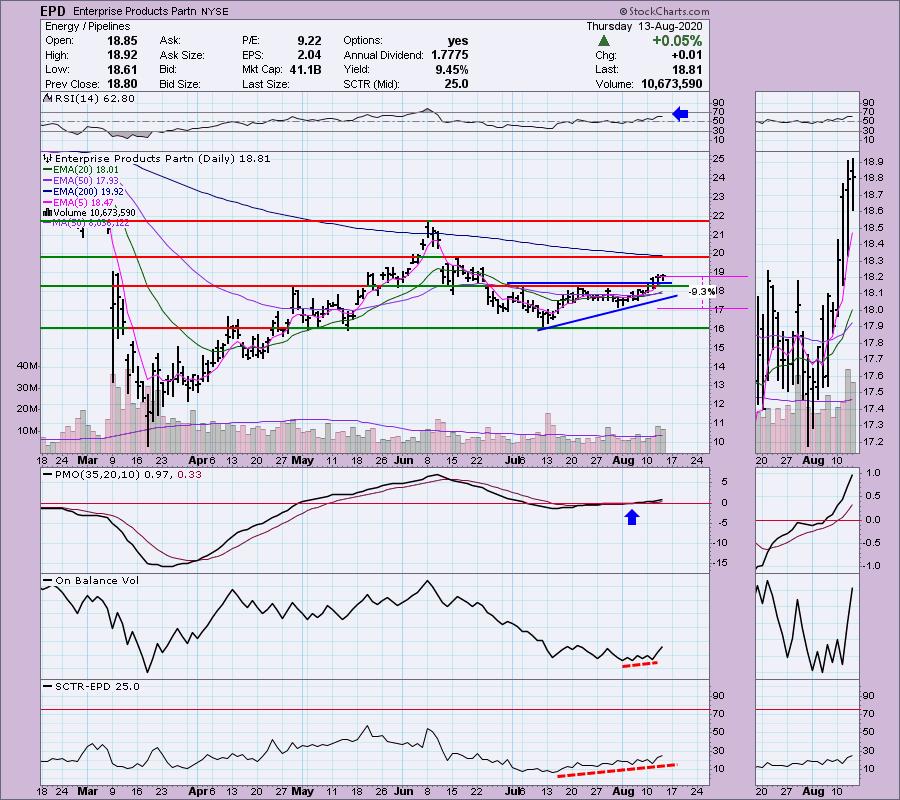
EPD is up 0.42% in after hours trading right now so maybe my reader is onto something here. I really like the chart. The RSI is positive, the PMO is rising and is now above zero. The 20-EMA just crossed above the 50-EMA for a "silver cross" IT Trend Model BUY signal. The OBV is confirming this short-term rally. The SCTR is showing improvement as well. The big problem here is the sector and industry group although there are always pockets of strength and this one is outperforming its brethren.
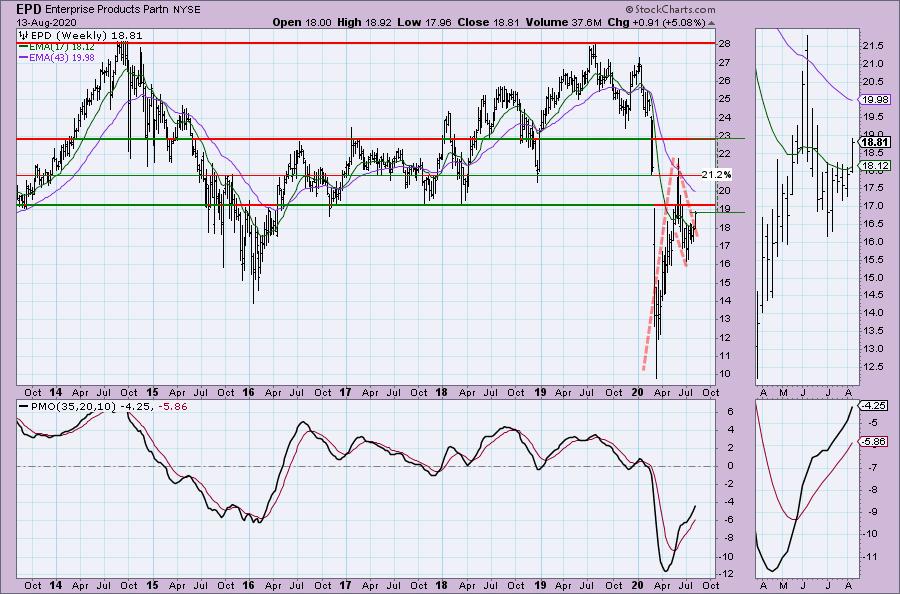
The weekly chart looks great! Rising PMO out of very oversold territory and a tall bull flag formation that could be executing right now.
Don't forget, on Thursdays I look at reader-requested symbols, so shoot me an email at erin@decisionpoint.com. I read every email I receive and try to answer them all!
ServiceNow Inc (NOW) - Earnings: 10/28/2020 (AMC)
ServiceNow, Inc. engages in the provision of enterprise cloud computing solutions. It offers customer and facilities service management, orchestration core, service mapping, cloud and portfolio management, edge encryption, performance analytics, service portal designer, visual task boards and configuration management database. The firm offers its solutions for the industries under the categories of Healthcare, Education, Government and Financial services.
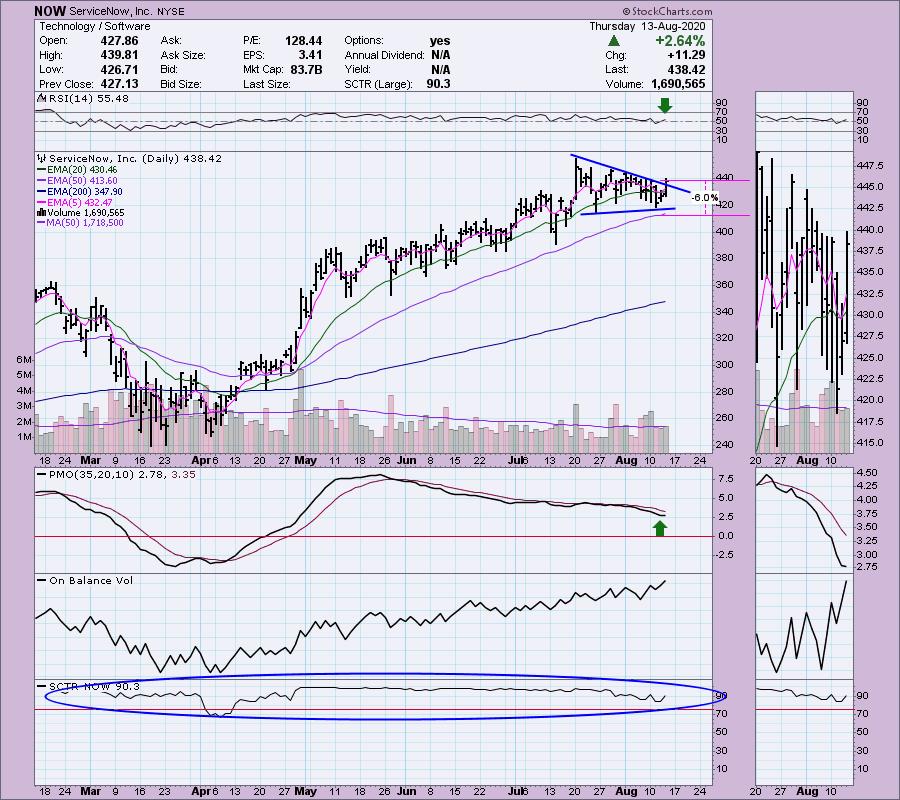
I presented this one in the 5/21 Diamonds Report. From then until now (no pun intended), NOW is up about 14%. If I had looked at this chart two days ago, I would have left it in the dust. Today it looks much more bullish. We have a short-term breakout from the declining trend that is executing a symmetrical triangle. These are continuation patterns so we should expect to see that breakout move. The RSI has just turned positive and the PMO is ready to turn back up. The SCTR is very strong and best of all, you can set a tight stop around the 50-EMA.
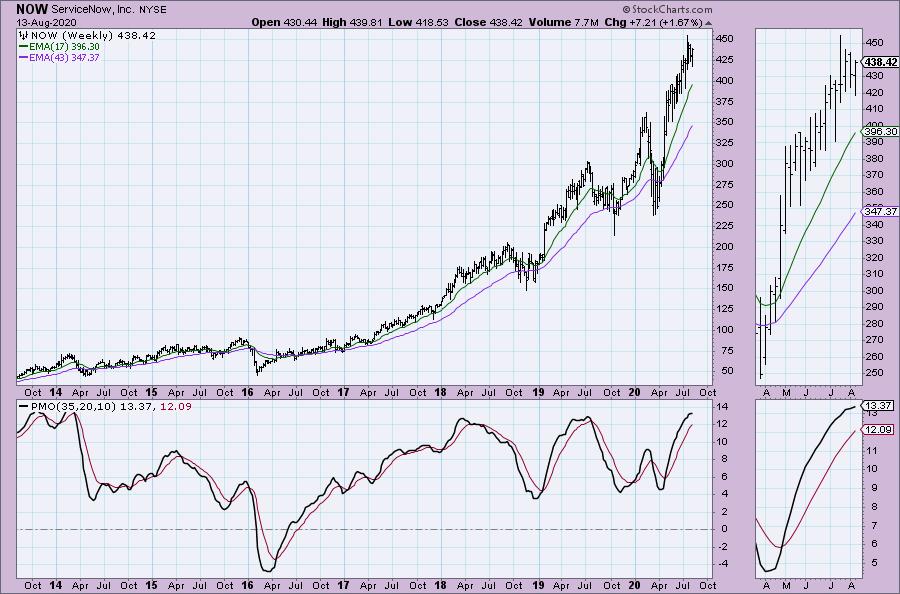
The weekly PMO is a bit concerning as it is trying to top in overbought territory, but overall it is a healthy chart.
S&P Global Inc (SPGI) - Earnings: 10/29/2020 (BMO)
S&P Global, Inc. engages in the provision of transparent and independent ratings, benchmarks, analytics and data to the capital and commodity markets worldwide. It operates through the following segments: Ratings, Market Intelligence, Platts and Indices. The Ratings segment offers credit ratings, research, and analytics to investors, issuers, and other market participants. The Market Intelligence provides multi-asset-class data, research and analytical capabilities, which integrate cross-asset analytics and desktop services. The Platts segment provides information and benchmark prices for the commodity and energy markets. The Indices segment provides variety of valuation and index benchmarks for investment advisors, wealth managers and institutional investors.
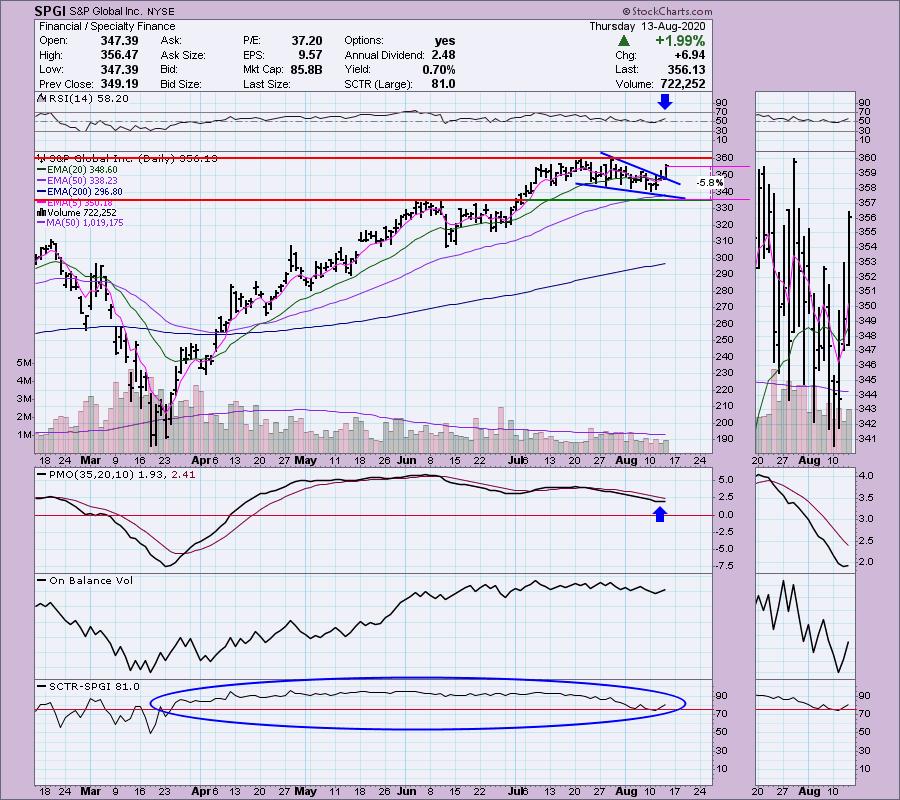
This one really piqued my interest today! I have been looking for more money to begin rotating into the Financial sector. This is a contender. We have a breakout from a short-term bullish falling wedge pattern. The PMO has just turned up and the RSI has been staying mostly positive since mid-June. The SCTR is strong. If I had to nit pick, I would say that I would've liked to have seen more volume on this breakout move today.
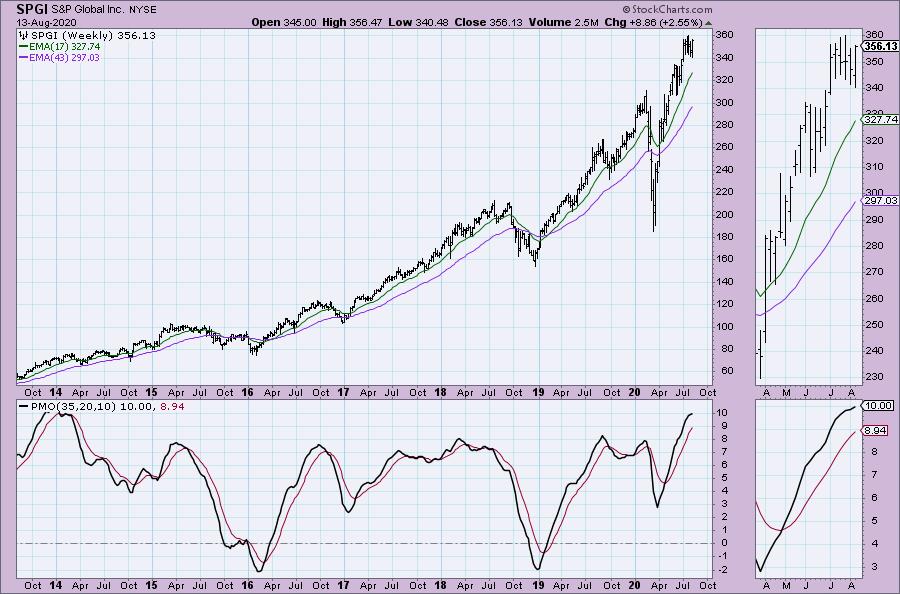
Like NOW, we are seeing a topping weekly PMO in overbought territory so this might be better suited as a shorter-term investment.
MEI Pharma Inc (MEIP) - Earnings: 8/26/2020 (BMO)
MEI Pharma, Inc. engages in the clinical development of therapies for cancer. Its drug candidates includes Pracinostat, an oral HDAC inhibitor that is being developed in combination with azacitidine for the treatment of acute myeloid leukemia and myelodysplastic syndrome. Its pipeline also consists of ME-401, an oral PI3K delta inhibitor; Voruciclib, an oral CDK inhibitor; and ME-344, a mitochondrial inhibitor.
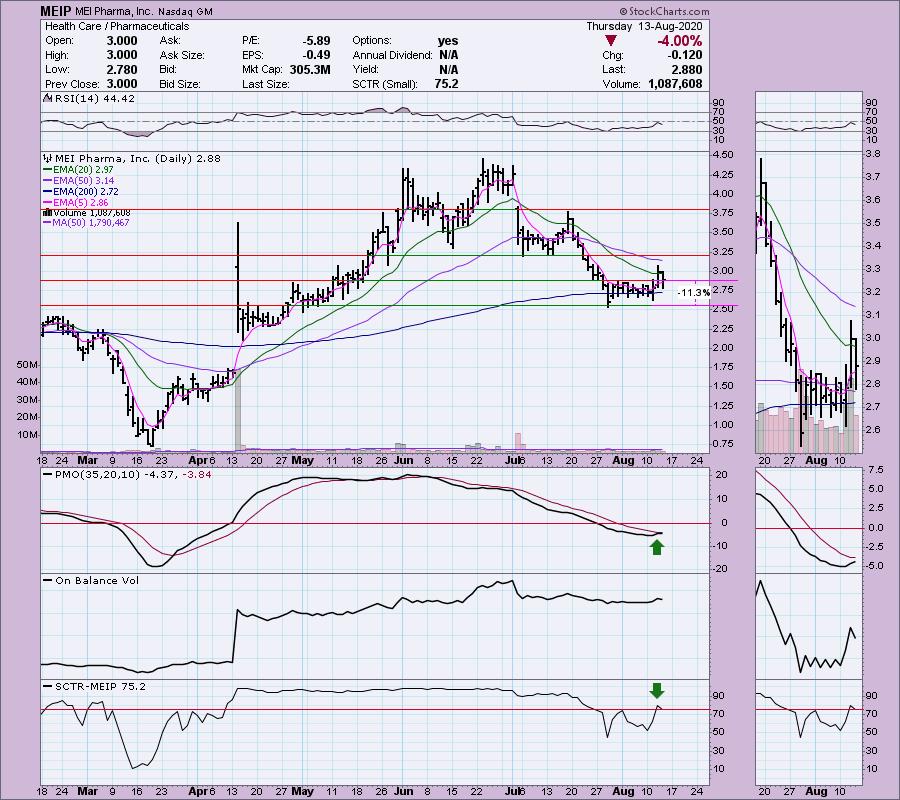
This one is probably not as bullish as YRCW was yesterday, but there are some signs of life on this low priced stock. Remember to position size appropriately here, these low priced stocks can swing wildly. Yesterday saw a strong breakout move and today it has pulled back to the breakout point. The PMO remains healthy despite a 4% drop today. The RSI is not great, but it is a bottom fish after all. The SCTR has now gotten back into the "hot zone" above 75. Volume was lower on today's pullback and that is a positive to me.
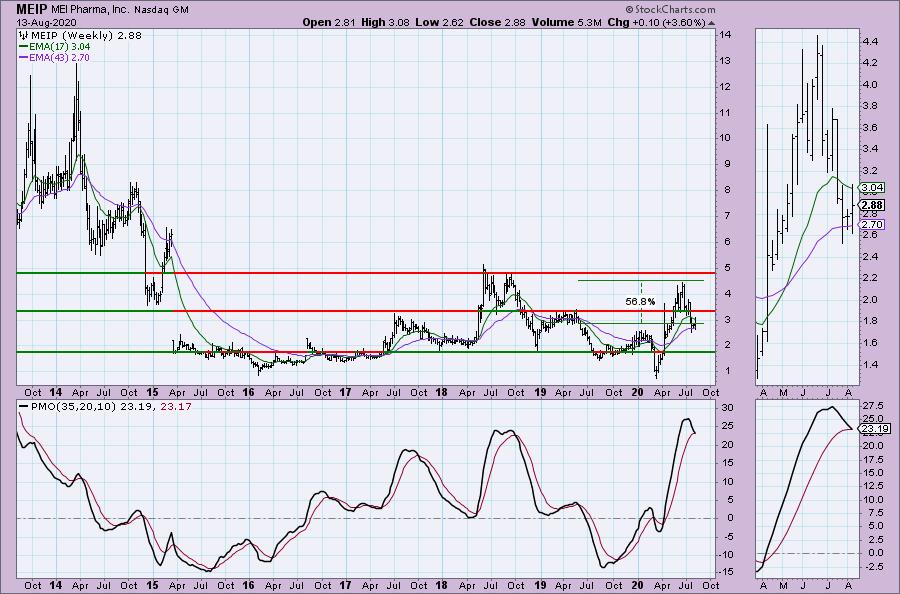
I would say this is definitely a short-term investment given the nearing PMO SELL signal in overbought territory. You'll want this one on a rather tight leash. The stop above is pretty deep at 11% so getting a better entry tomorrow might make this one more attractive.
Current Market Outlook:
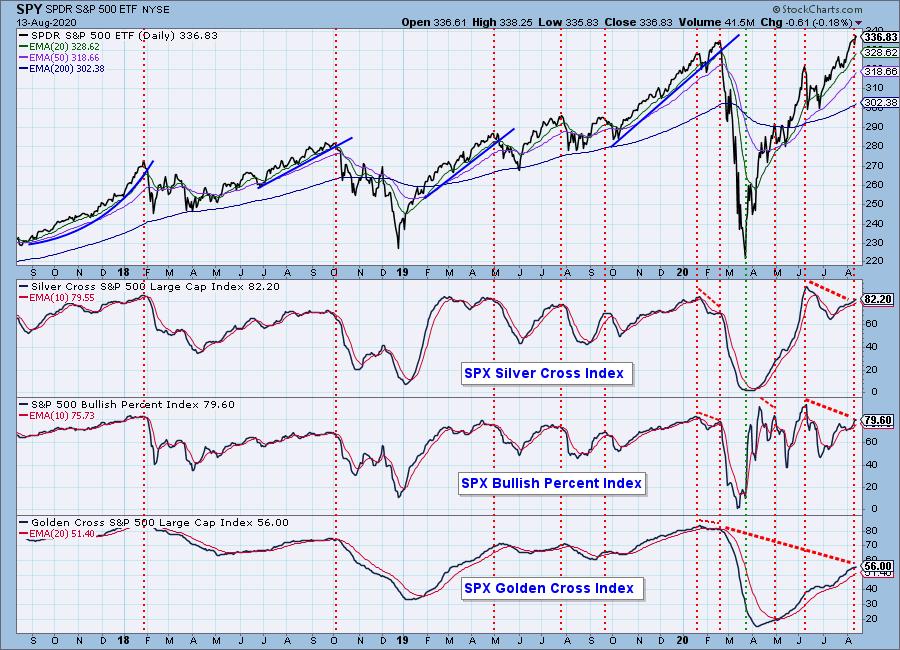
Market Environment: It is important to consider the odds for success by assessing the market tides. The following chart uses different methodologies for objectively showing the depth and trend of participation for intermediate- and long-term time frames.
- The Silver Cross Index (SCI) shows the percentage of SPX stocks on IT Trend Model BUY signals (20-EMA > 50-EMA)
- The Golden Cross Index (GCI) shows the percentage of SPX stocks on LT Trend Model BUY signals (50-EMA > 200-EMA)
- The Bullish Percent Index (BPI) shows the percentage of SPX stocks on Point & Figure BUY signals.
Don't forget that as a "Diamonds" member, you have access to our GCI/SCI curated ChartList on DecisionPoint.com. You'll find it under "Members Only" links on the left side on the Blogs and Links Page.
Here is the current chart:
Diamond Index:
- Diamond Scan Results: 3
- Diamond Dog Scan Results: 2
- Diamond Bull/Bear Ratio: 1.50
Full Disclosure: I'm about 65% invested right now and 25% is in 'cash', meaning in money markets and readily available to trade with. Some of my stops have not triggered, but I will probably close a few positions tomorrow.
Technical Analysis is a windsock, not a crystal ball.
Happy Charting!
- Erin
erin@decisionpoint.com
ANNOUNCEMENT:
I have the information for my VIRTUAL presentation at The Money Show! My presentation will on August 19th at 1:20p EST! Click here for information on how to register to see me!

Watch the latest episode of DecisionPoint with Carl & Erin Swenlin on Mondays 7:00p EST or on the DecisionPoint playlist on the StockCharts TV YouTube channel here!
NOTE: The stocks reported herein are from mechanical trading model scans that are based upon moving average relationships, momentum and volume. DecisionPoint analysis is then applied to get five selections from the scans. The selections given should prompt readers to do a chart review using their own analysis process. This letter is not a call for a specific action to buy, sell or short any of the stocks provided. There are NO sure things or guaranteed returns on the daily selection of "diamonds in the rough."
Helpful DecisionPoint Links:
DecisionPoint Shared ChartList and DecisionPoint Chart Gallery
Price Momentum Oscillator (PMO)
Swenlin Trading Oscillators (STO-B and STO-V)
For more links, go to DecisionPoint.com!