
One of my readers, Olivia, gave me four stock symbols with the question, "Short or Buy?" I picked two that I thought would be interesting for discussion. My friend George has another interesting pick to share. Chris joined in today with a popular stock with potential. And finally, I ran "Carl's Scan" which looks for bottom fishing opportunities. It hasn't produced many results but today I found one that I like a great deal. You'll have to tell me what you think!
Welcome to DecisionPoint Daily Diamonds, wherein I highlight five "diamonds in the rough." These are selected from the results of my DecisionPoint scans, which search for stocks that could benefit from the trend and condition of the market. Remember, these are not recommendations to buy or sell, but are the most interesting of the stocks that surfaced in my scans. My objective is to save you the work of the initial, tedious culling process, but you need to apply your own analysis to see if these stocks pique your interest as well. There are no guaranteed winners here!
Eidos Therapeutics Inc (EIDX) - Earnings: 7/30/2020 (AMC)
Eidos Therapeutics, Inc. focuses on addressing the large and growing unmet need in diseases caused by transthyretin (TTR) amyloidosis (ATTR). Its product include the AG10, an orally-administered small molecule designed to potently stabilize TTR, suggesting a treatment with the potential to halt the progression of ATTR.
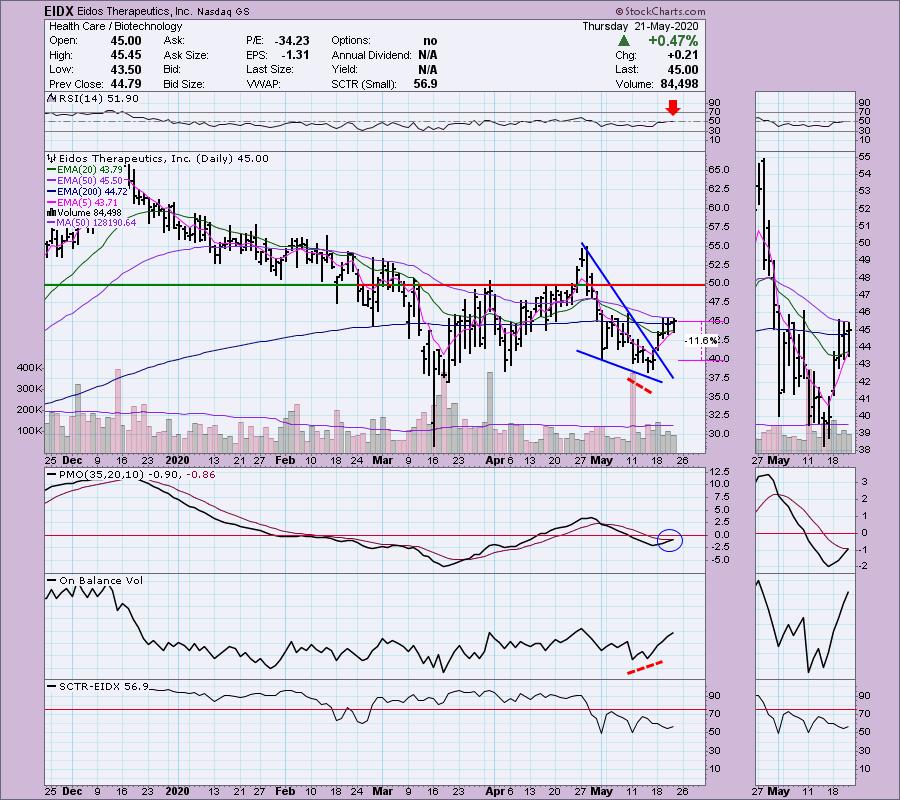
This is my bottom fishing catch. EIDX broke from a bullish descending wedge and is now moving sideways. It is staying mostly above the 20-EMA. I'm a bit worried about the 50-EMA as overhead resistance, price failed there earlier in May. The OBV had a short-term positive divergence that resulted in this breakout rally. The RSI just moved above 50 and the PMO is readying for a crossover BUY signal. I would set a stop below $40, but you could go tighter.
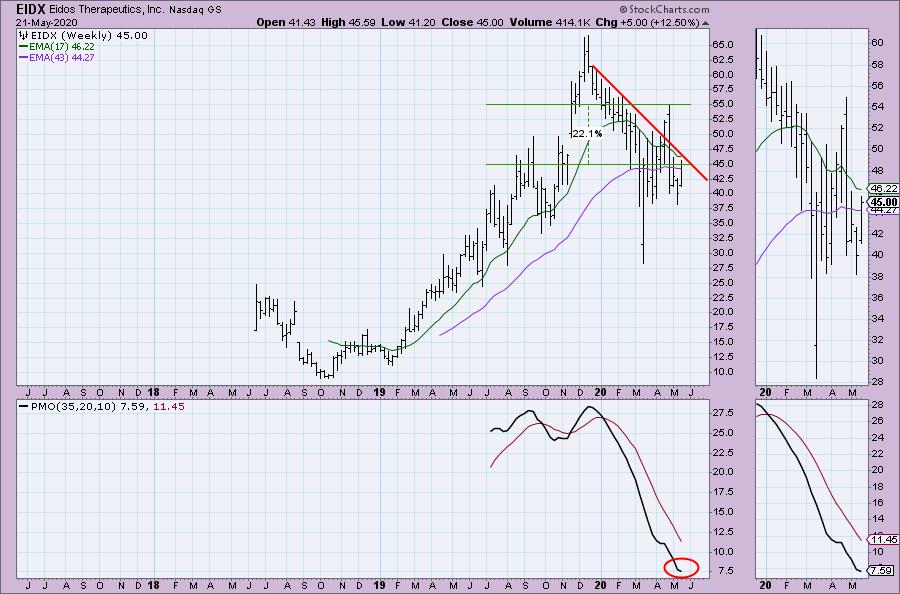
The weekly PMO has decelerated and could be ready to turn back up. One thing to consider is that a long-term declining tops trendline hasn't been successfully broken this week.
Remember DecisionPoint Bundle Subscribers Get the
LIVE Trading Room for FREE ($49 Value)! Upgrade Today!
Olivia - Service Now Inc (NOW) - Earnings: 7/22/2020 (AMC)
ServiceNow, Inc. engages in the provision of enterprise cloud computing solutions. It offers customer and facilities service management, orchestration core, service mapping, cloud and portfolio management, edge encryption, performance analytics, service portal designer, visual task boards and configuration management database. The firm offers its solutions for the industries under the categories of Healthcare, Education, Government and Financial services.
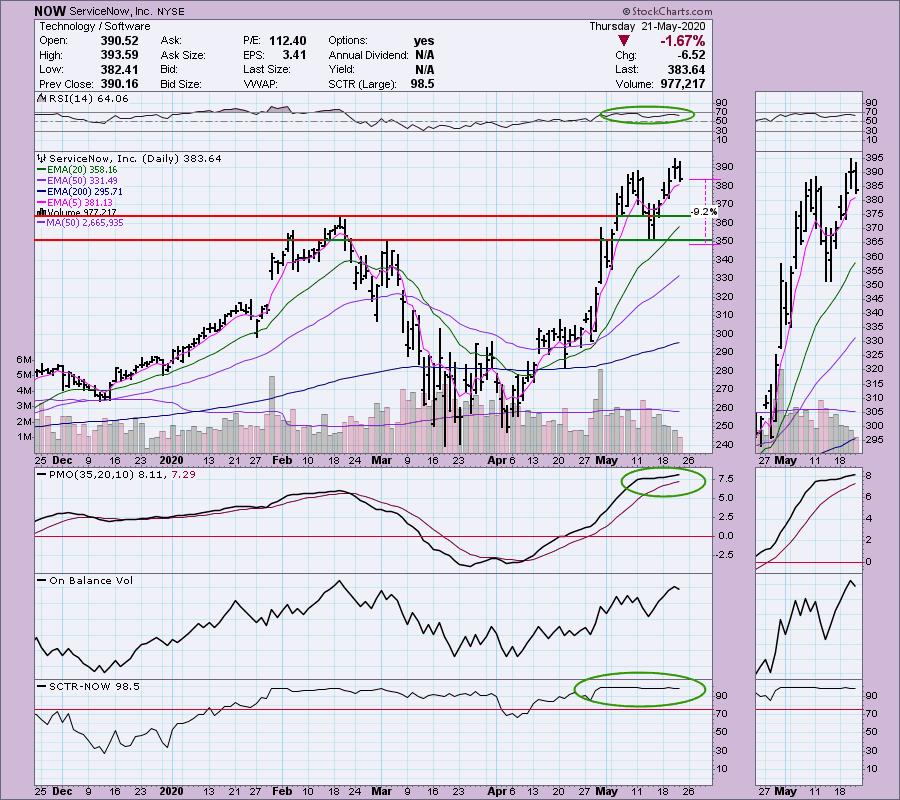
Buy or short? I would consider this for a possible BUY not a short. I prefer to short when I see an RSI below 50 and given the SCTR is still going strong well above 90, it isn't ripe. However, it could likely be in for a pullback here. It already began it. So if you're a day trader or hold trades only a few days, you could play this as a short, but the stock isn't showing enough weakness to look for more breakdown. My concern would be the formation of a double-top. We don't really have that yet, but something to consider if you get in. I like seeing a pullback before possible entry and today provided one. The RSI is strong, you can set a reasonable stop just below what would be a confirmation line for the possible double-top.
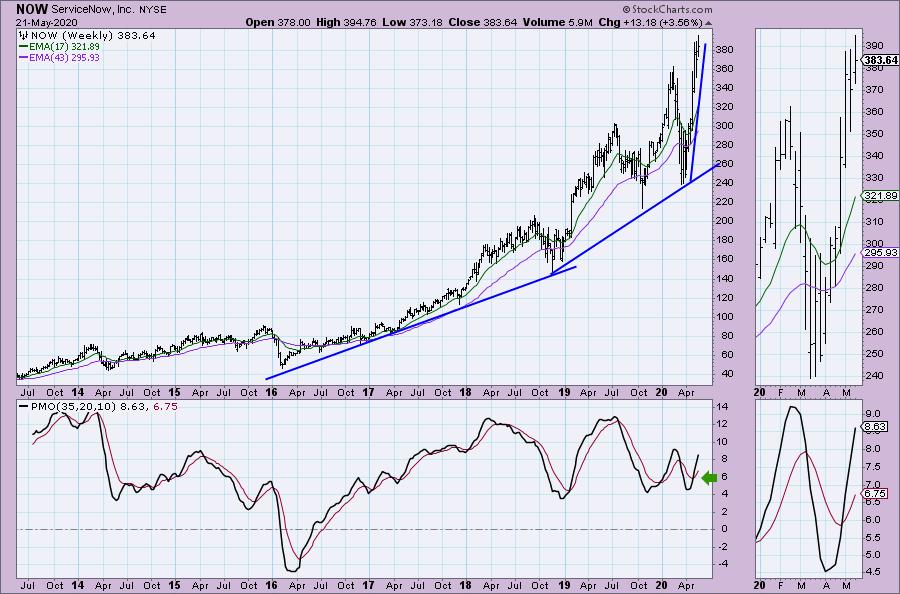
I can see why this might be attractive as a short given the steep rising trend, but the weekly chart isn't exposing much weakness given the PMO crossover Buy signal.
Don't forget, on Thursdays I look at reader-requested symbols, so shoot me an email at erin@decisionpoint.com. I read every email I receive and try to answer them all!
Olivia - RH Inc (RH) - Earnings: 6/11/2020 (AMC)
RH operates as a holding company which operates the business through its subsidiary Restoration Hardware, Inc. It offers furniture, lighting, textiles, bathware, decor, outdoor and garden, as well as baby and child products. The company operates an integrated business with multiple channels of distribution including galleries, source books and websites.
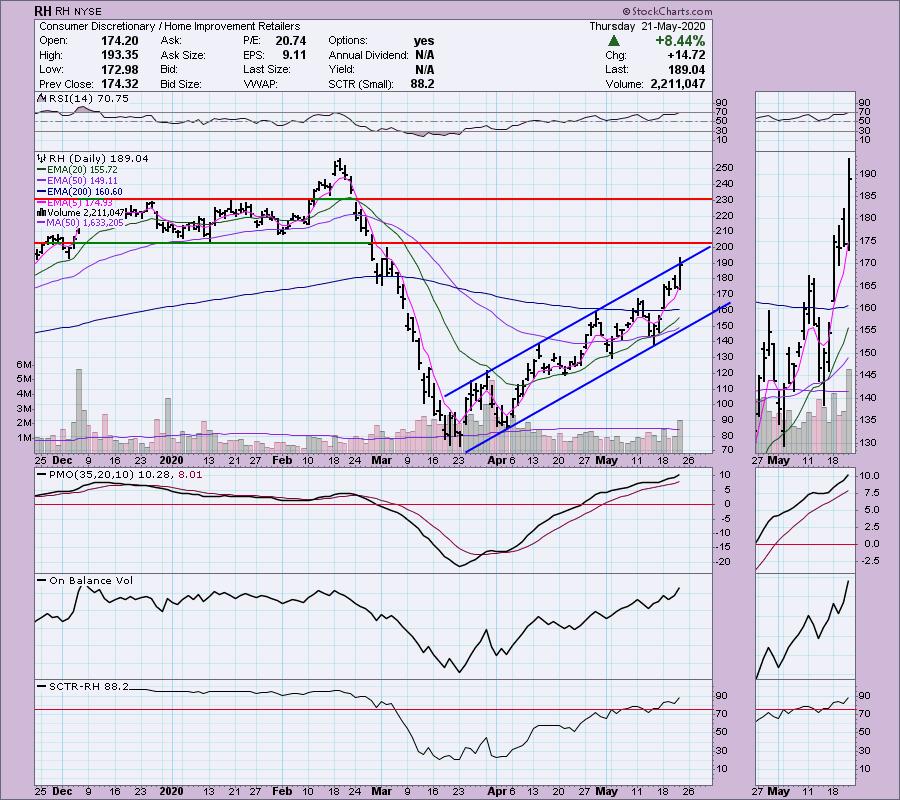
Is this a BUY or SHORT? I like this as a possible BUY not short. The chart is showing too much strength for a short right now. It is certainly getting extended and has now made it to the top of its trend channel, meaning it could be ready for a pullback to test the rising bottoms trendline. Beside running into the top of the trend channel, it is coming up on overhead resistance of the January lows. It could be quite interesting with a pullback (which you could short, but again a lot of internal and relative strength here based on the SCTR). Momentum suggests it could go higher. The RSI is getting overbought, but overbought conditions will persist in a bullish trend. Before I would consider entry, I would want to see what happens over the next few days to possibly take back some of today's near +8.5% gain.
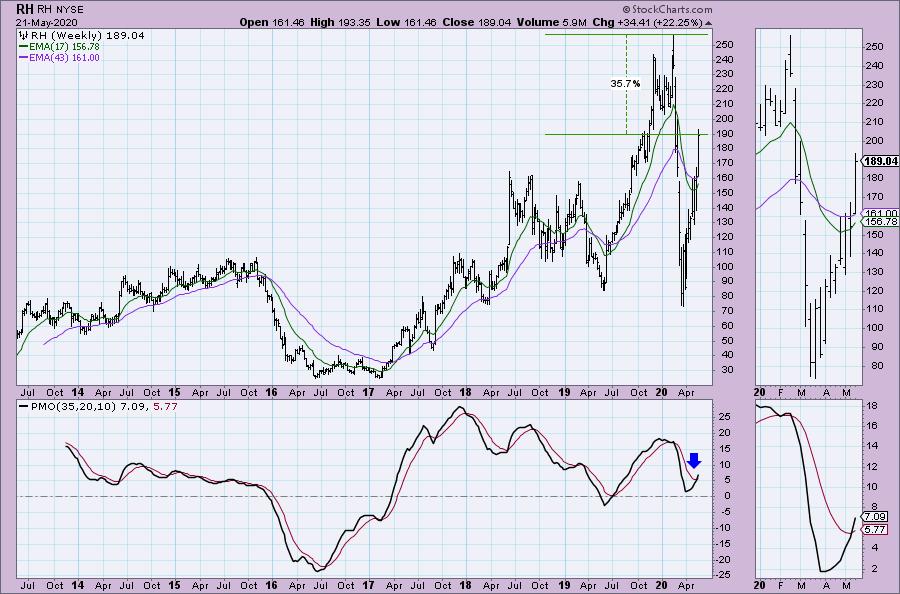
I like the weekly chart. It has a nice PMO BUY signal in place and plenty of upside potential.
Chris - Teladoc Health Inc (TDOC) - Earnings: 7/29/2020
Teladoc Health, Inc. engages in the provision of telehealthcare services using a technology platform via mobile devices, the Internet, video and phone. Its portfolio of services and solutions covers medical subspecialties from non-urgent, episodic needs like flu and upper respiratory infections, to chronic, complicated medical conditions like cancer and congestive heart failure.
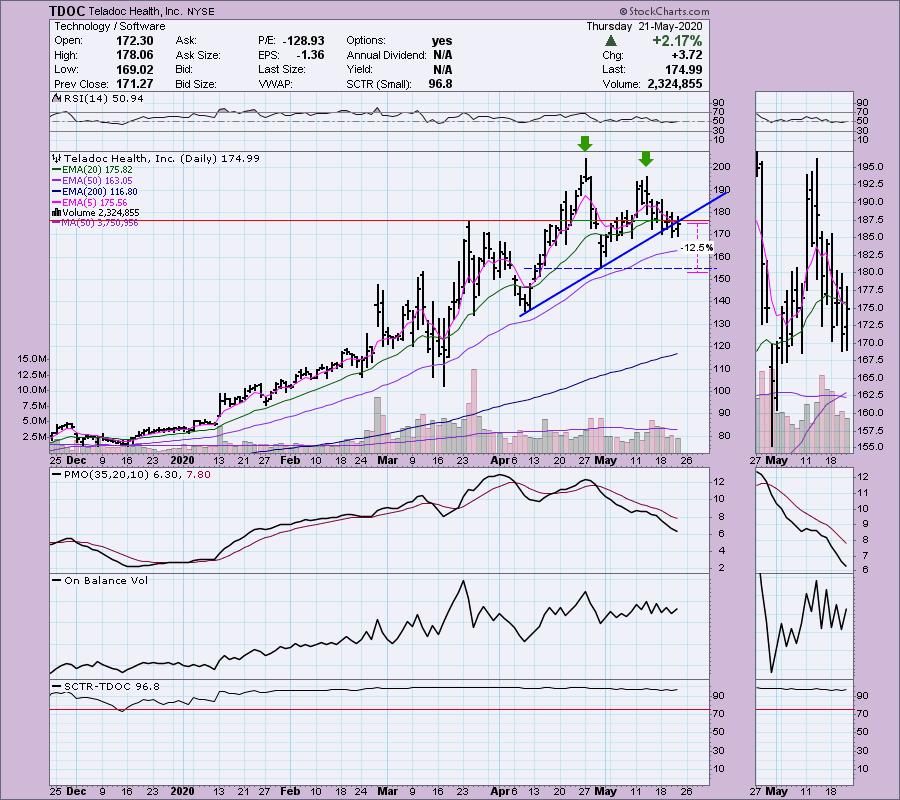
I very much like the pullback we are seeing on TDOC. It has broken the rising trend though and I am a bit concerned by the large double-top that could be forming. The PMO is suggesting we will see a test of the confirmation line. If you got in now, I would set a stop below the confirmation line. However, I would wait and put this one in a watch list. It's a great company with an important role in the post-COVID world. I am expecting this one to turn around, but it may require a bit more pullback given downside momentum isn't decelerating just yet.
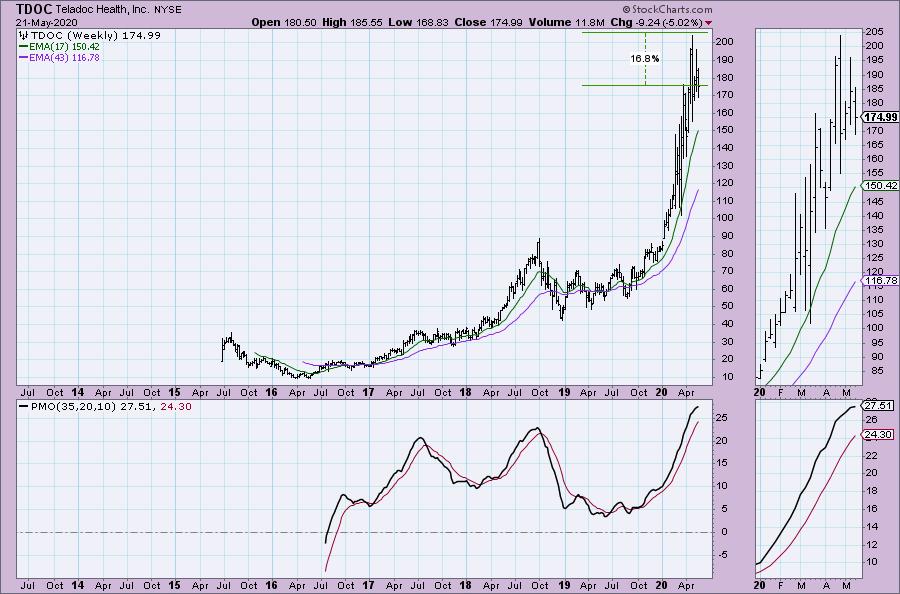
We can see that there is a possible upside target of 16.8% which is certainly reachable, but as I said above, I think it will pullback further before it begins to run higher again.
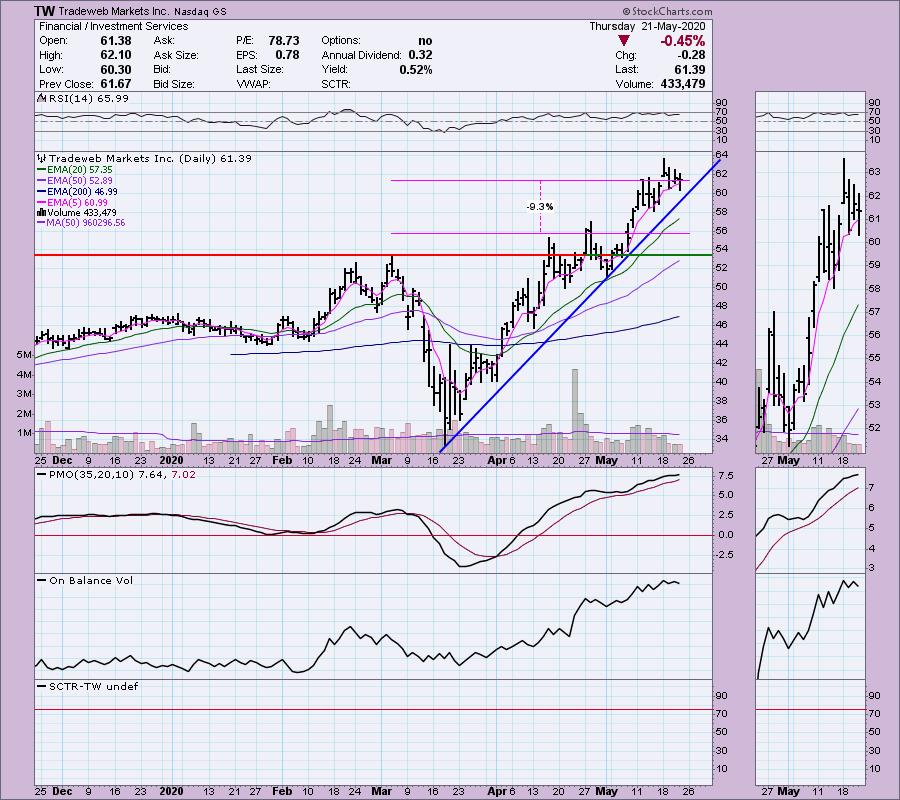
George - Tradeweb Markets Inc (TW) - Earnings: 8/6/2020
Tradeweb Markets, Inc. engages in the operation of electronic marketplaces for the trading of products across the rates, credit, money markets, and equities asset classes. It also provides related pre-trade pricing and post-trade processing services. Its network is comprised of clients across the institutional, wholesale, and retail client sectors, including global asset managers, hedge funds, insurance companies, central banks, banks and dealers, proprietary trading firms and retail brokerage and financial advisory firms, as well as regional dealers.
TW is very interesting indeed. We have a solid rising trend that is holding up. We are currently get a pullback off this week's high. The PMO is very overbought, but is still rising. I'm okay with the overbought PMO because price itself isn't overbought given the RSI is below 70. This one could certainly continue higher. I would put a stop in just below the April top.
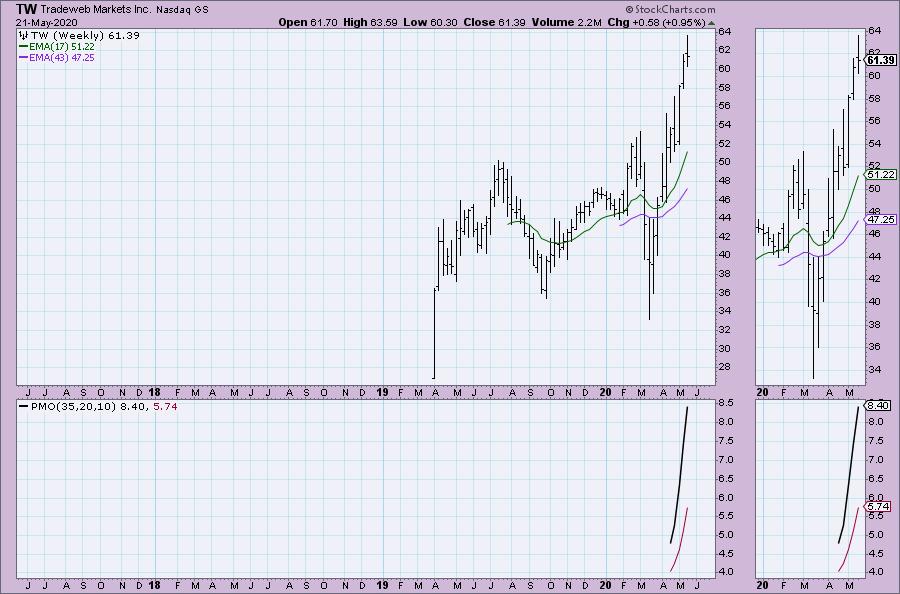
Nice breakout on the weekly chart. It is a very steep rising trend here, but remains intact. I could see this one moving higher.
Current Market Outlook:
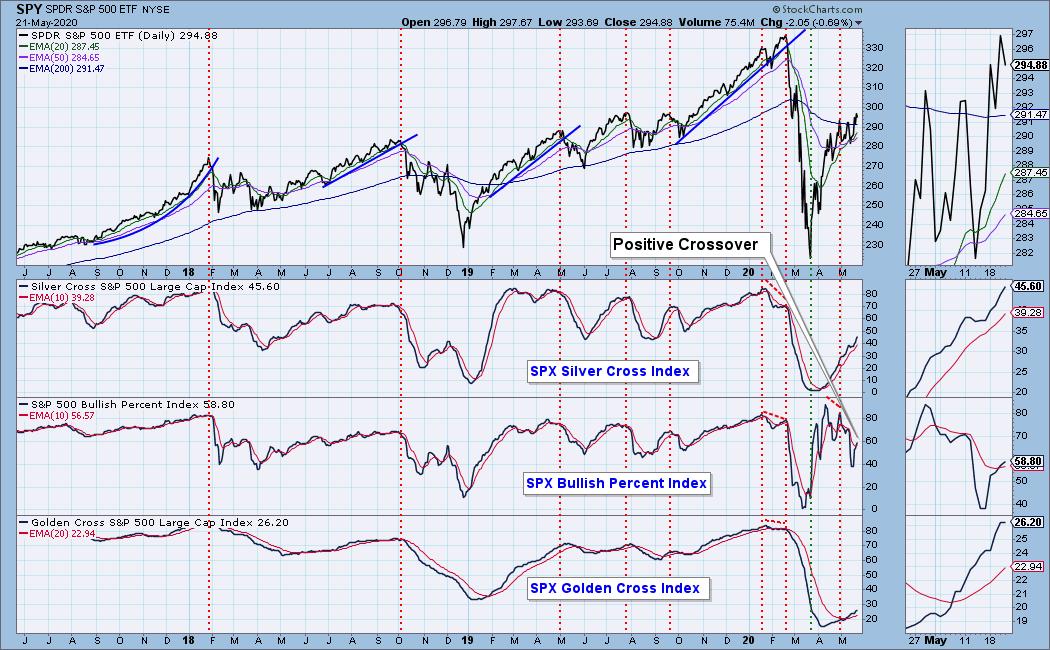
Market Environment: It is important to consider the odds for success. The Silver Cross Index measures the percentage of stocks on IT Trend Model BUY signals (20-EMA > 50-EMA), while the Golden Cross Index measures the percentage of stocks on LT Trend Model BUY signals (50-EMA > 200-EMA). Don't forget that as a "Diamonds" member, you have access to our GCI/SCI curated ChartList on DecisionPoint.com. You'll find it under "Members Only" links on the left side on the Blogs and Links Page. Here are the current percentages on the Silver and Golden Cross Indexes:
Diamond Index:
- Diamond Scan Results: 6
- Diamond Dog Scan Results: 6
- Diamond Bull/Bear Ratio: 1.00
For a more comprehensive review of current market conditions as well as analysis of Dollar, Gold, Oil and Bonds, subscribe to the DecisionPoint Alert! For a LIMITED TIME you can get a coupon code that will give you a discount for bundling your Diamonds subscription with the DecisionPoint Alert! Contact support@decisionpoint.com for more details.
Full Disclosure: I have cashed out on a few of my positions to lock in profit. I believe the market may be topping, so I may not enter many new positions. I am currently 55% in cash.

Erin Swenlin will be presenting at the The MoneyShow Las Vegas August 16 - 20 at Bally's/Paris Resort! You'll have an opportunity to meet Erin and discuss the latest DecisionPoint news and Diamond Scans. Claim your FREE pass here! You can watch online with this pass too!! There will be online events held in May and when I have more information I'll let you know.
Watch the latest episode of DecisionPoint with Carl & Erin Swenlin on Thursdays 8:00a EST or on the DecisionPoint playlist on the StockCharts TV YouTube channel here!
Technical Analysis is a windsock, not a crystal ball.
Happy Charting!
- Erin
erin@decisionpoint.com
NOTE: The stocks reported herein are from mechanical trading model scans that are based upon moving average relationships, momentum and volume. DecisionPoint analysis is then applied to get five selections from the scans. The selections given should prompt readers to do a chart review using their own analysis process. This letter is not a call for a specific action to buy, sell or short any of the stocks provided. There are NO sure things or guaranteed returns on the daily selection of "diamonds in the rough."
Helpful DecisionPoint Links:
DecisionPoint Shared ChartList and DecisionPoint Chart Gallery
Price Momentum Oscillator (PMO)
Swenlin Trading Oscillators (STO-B and STO-V)
For more links, go to DecisionPoint.com!
