
I remember opening a book by Charles Kirkpatrick. He stated that it is far easier to find a stock to buy than to determine when to sell it. My advice is fairly simple. Set stops and TARGETS. And, second, get rid of losers to make room for winners. Many folks don't set stops and that is the first way to end up in trouble. The second way is to get greedy. Don't get me wrong, greed is necessary, but it works far better with a side of prudence. How to avoid this? Set targets. You don't have to sell at that target, but you do have to reevaluate. If there is anything on the chart that could be a concern (momentum shifting lower, RSI highly overbought, strong overhead resistance), make a pact to sell part of your position, if not all. To avoid regret...I find another vehicle that has a chart that looks more promising than the one I'm going to sell and focus on that or look at possible reentry points. If you have the ability (stockcharts.com does), set price alerts. Have it alert you to stop levels being reached and targets being reached. If it is any comfort, I still have trouble following through on selling, but I at least get an opportunity to talk myself into or out of a stock with price alerts. In the Diamonds Report, I put in suggested stop areas and on the weekly chart will list possible targets. If the stock is at an all-time high, I will look at the stop level I have picked and double the percentage as the target I want. For example, I have an 8% stop set from current price, I make my target might be a 16% higher than the current price. Minimum upside targets calculated from chart patterns are also a way you can determine targets.
I changed the look of my daily charts. Rather than one year, they are about 8 months but they have thicker OHLC bars. I found that I was concentrating on the right side of the chart and the one year chart, while giving me support and resistance levels, was making it hard to see the price action on the right. The weekly chart is great for determining those support and resistance levels that may get lost on an 8-month chart. Let me know your thoughts (and throw in a symbol request) at erin@decisionpoint.com.
Welcome to DecisionPoint Daily Diamonds, wherein I highlight five "diamonds in the rough." These are selected from the results of my DecisionPoint scans, which search for stocks that could benefit from the trend and condition of the market. Remember, these are not recommendations to buy or sell, but are the most interesting of the stocks that surfaced in my scans. My objective is to save you the work of the initial, tedious culling process, but you need to apply your own analysis to see if these stocks pique your interest as well. There are no guaranteed winners here!
Adobe Systems Inc (ADBE) - Earnings: 6/11/2020 (AMC)
Adobe is making its way out of a congested area on the chart. The PMO is not overbought and you can set a reasonable stop at the bottom of that congestion area. The OBV and RSI are rising nicely and as with almost every Diamond, the SCTR is in the "hot zone" above 75. A high SCTR implies not only relative strength, it also tells us that the stock or ETF is internally strong.

The weekly PMO is rising and hasn't yet given us a BUY signal. We're only about 8.5% away from the all-time high. That would be an excellent area for reevaluation.

Free Live Trading Room - Tuesdays/Thursdays
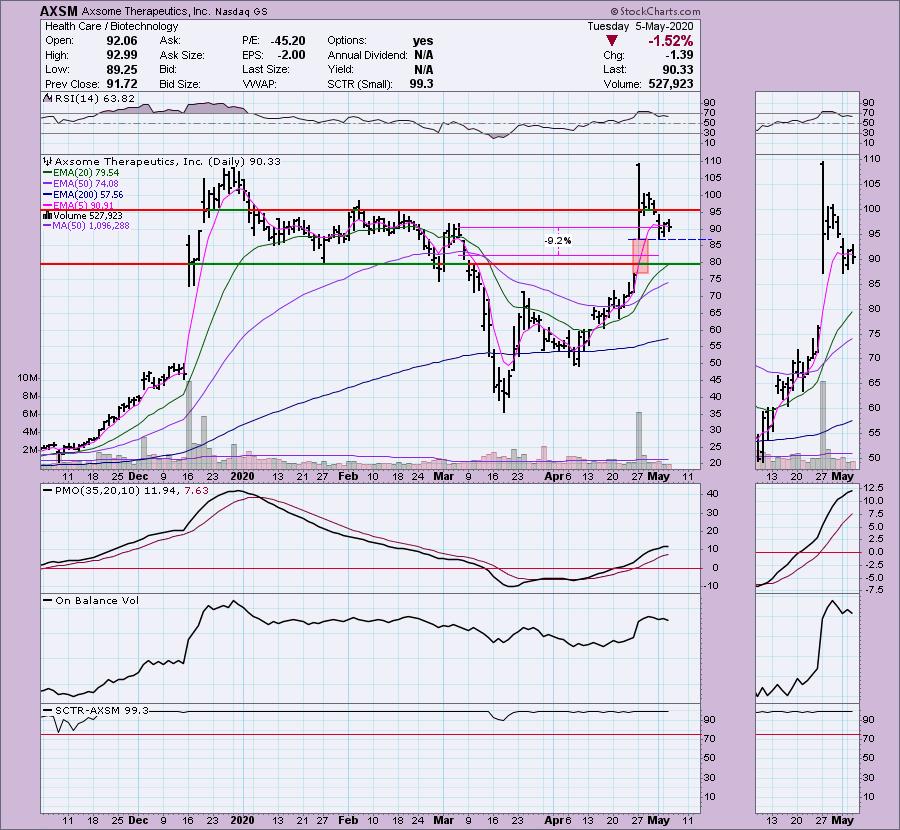
Axsome Therapeutics Inc (AXSM) - Earnings: 5/8/2020 (BMO)
Axsome Therapeutics, Inc. is a clinical stage biopharmaceutical company, which engages in the development of novel therapies for the management of central nervous system disorders. Its product candidates include AXS-05, AXS-07, AXS-09, AXS-12, and AXS-14 which are developing for multiple pain and primary care indications.
The gap on this chart is actually what interested me. So far price is holding gap support. The PMO is decelerating, but that isn't surprising given the pullback. The pullback also makes this one interesting. If gap support doesn't hold, I may hold off on this one, but if you're ready to get in, I would recommend setting a stop about halfway down the gap. Watch the 5 and 30-minute charts and watch the PMO for possible entry. I talk about this in the live trading room, so if you haven't checked it out, I recommend you do!
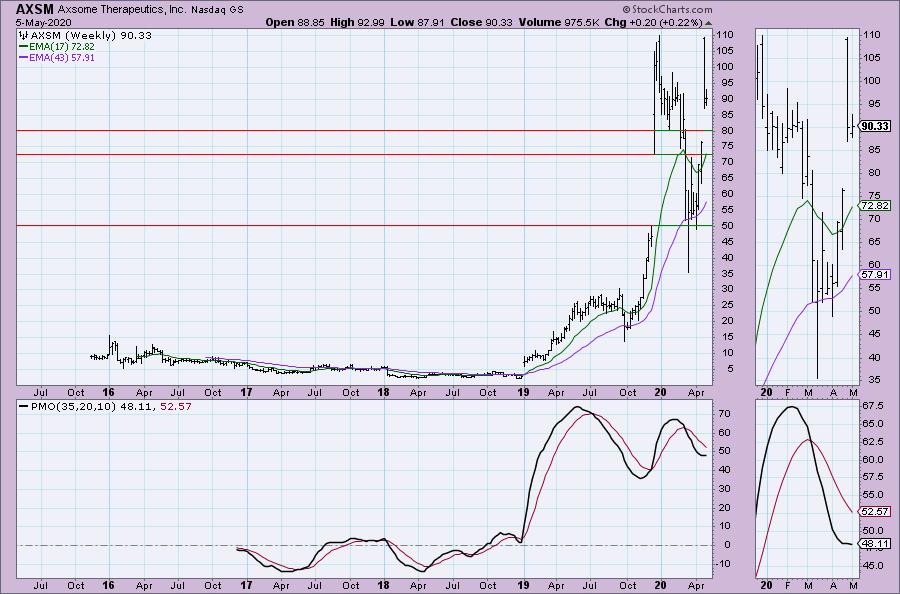
The weekly PMO is starting to rise. You can see that halfway down the gap is support at about $80. If it is already making a move to cover that gap, it will likely continue down so be careful and true to your stop level.
Don't forget, on Thursdays I look at reader-requested symbols, so shoot me an email at erin@decisionpoint.com. I read every email I receive and try to answer them all!
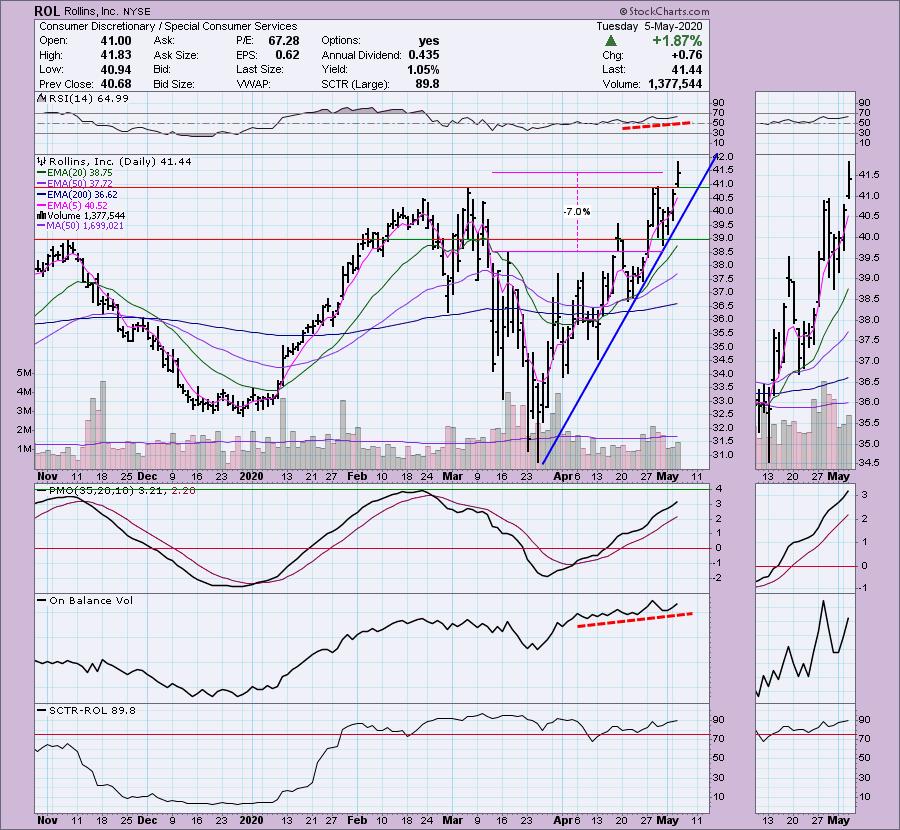
Rollins Inc (ROL) - Earnings: 7/22/2020 (BMO)
Rollins, Inc. engages in the provision of pest and termite control services through its wholly-owned subsidiaries to both residential and commercial customers in United States, Canada, Central America, South America, the Caribbean, the Middle East, Asia, the Mediterranean, Europe, Africa, Mexico, and Australia.
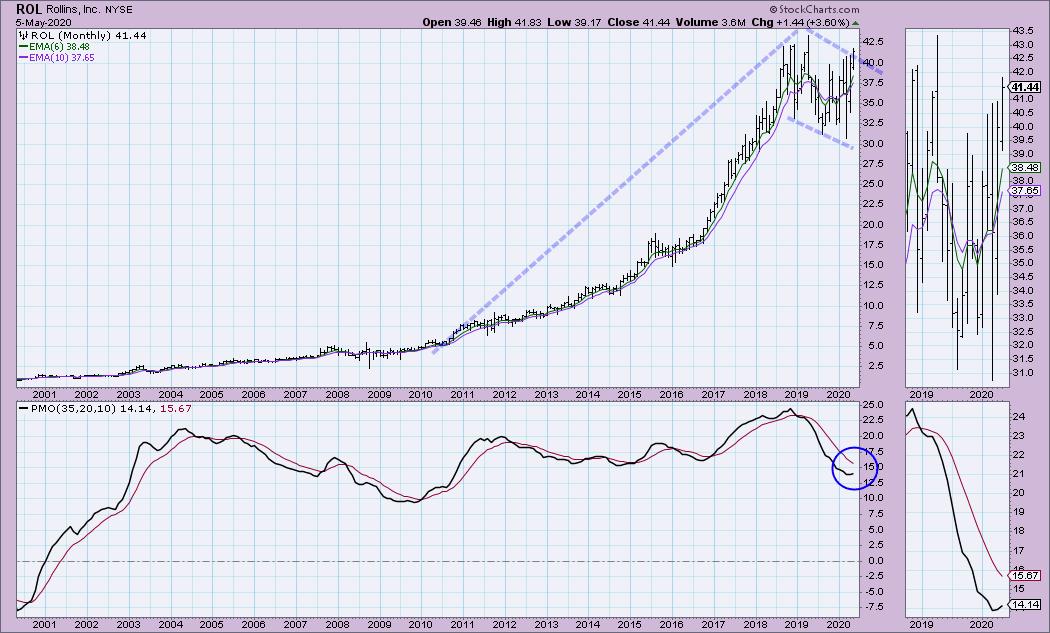
Nice breakout for Rollins today. The PMO is not particularly overbought and the neither is the RSI. It has held a nice rising trend since the March low. The OBV is rising and the SCTR is in the hot zone. You can set a stop around $38.50.
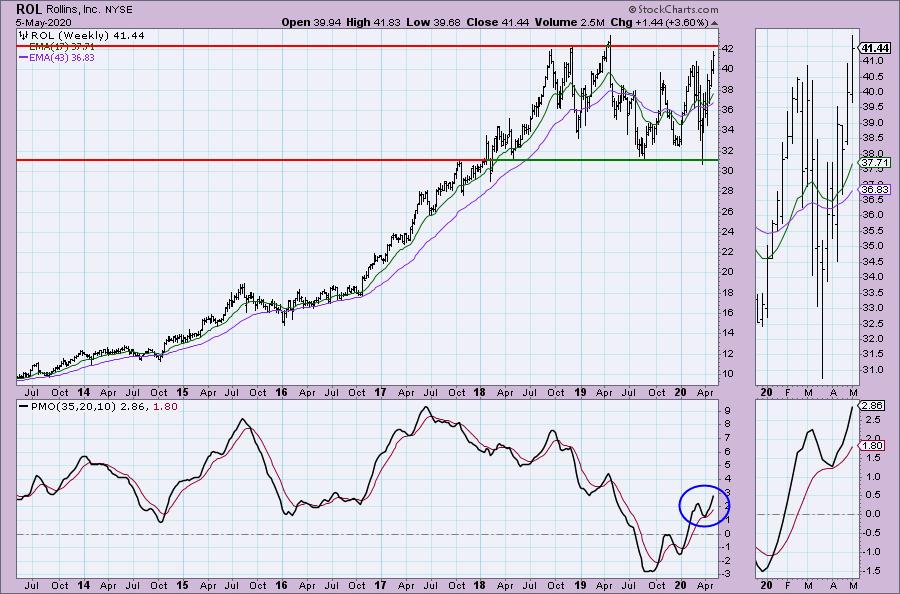
A PMO bottom above the signal line is very bullish and we can see it is still rising. ROL is getting ready to test overhead resistance near the all-time high. I'm looking for a breakout. The consolidation zone length is around $10, so I would set my target by adding half that to the breakout area...gives us a target around $47. There is a very bullish flag on the monthly chart and the PMO is turning up as well.
Verisk Analytics Inc (VRSK) - Earnings: 5/5/2020 (AMC)
Verisk Analytics, Inc. is a holding company, which engages in the provision of data analytics for customers in insurance, energy markets and financial services. It operates through the following segments: Insurance, Energy & Specialized Markets and Financial Services. The Insurance segment serves insurance customers and focuses on the prediction of loss, the selection and pricing of risk, and compliance. The Energy & Specialized Markets segment provides data analytics services. It also provides research and consulting services focusing on exploration strategies and screening, asset development and acquisition, commodity markets and corporate analysis. The Financial Services segment maintains bank account consortia to provide competitive benchmarking, decisioning algorithms, business intelligence, and customized analytic services to financial institutions, payment networks and processors, alternative lenders, regulators and merchants.
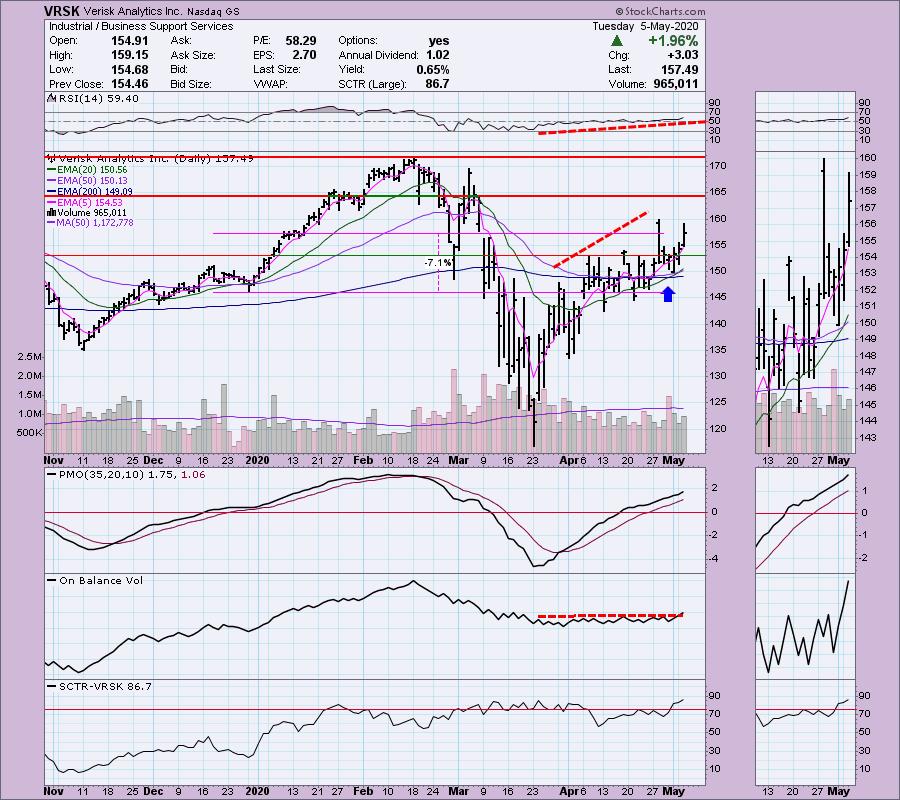
VRSK is in a rising trend and only recently has a 20/50-EMA positive crossover (silver cross) that triggered an IT Trend Model BUY signal. RSI is trending higher but is not overbought. Volume broke out on the OBV and while it may seem bearish to have a flat OBV, I like that the tops are flat and not declining. It tells me that despite a lack of upside volume (the downside volume didn't deteriorate the OBV bottoms or tops), price still trended higher. It was a push/pull as price was up one day and down the next on similar volume. I would set a stop around the December 2019 lows, but honestly a loss of the 200-EMA would be a deal breaker for me.
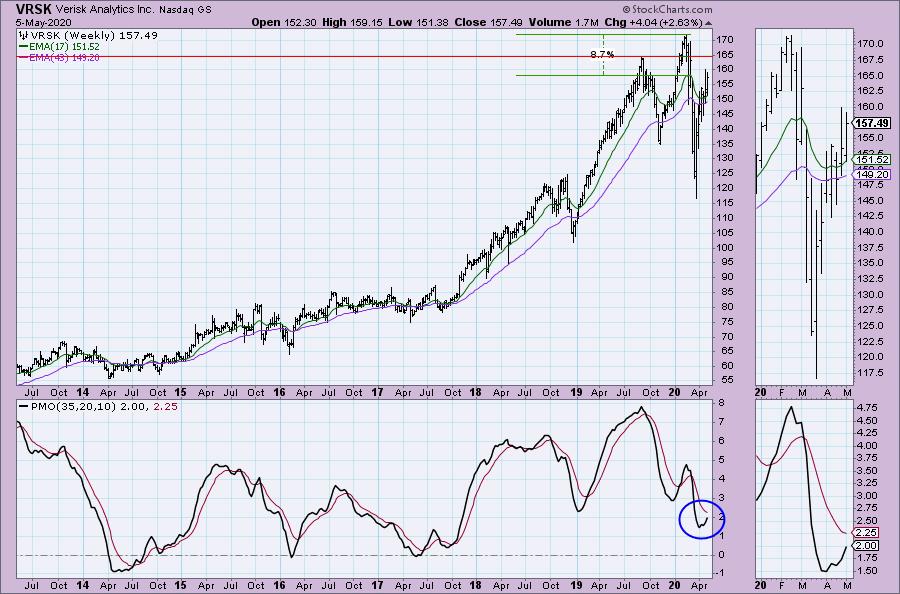
The weekly PMO is favorable and while the upside target is less than 9% away, the PMO is promising higher prices. As I said in my opening, that all-time high target would be a good time to reevaluate.
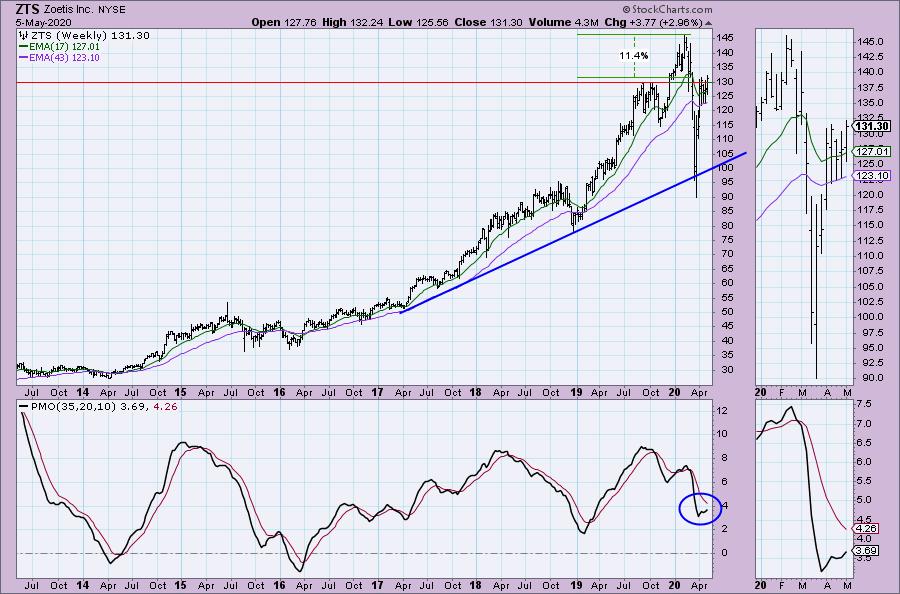
Zoetis Inc (ZTS) - Earnings: 5/6/2020 (BMO)
Zoetis, Inc. discovers, develops and manufactures a portfolio of animal health medicines and vaccines. The company operates through the following segments: United States &International. Its products are complemented by diagnostic products, genetic tests, bio devices and services. These are designed to meet the needs of veterinarians and the livestock farmers and companion animal. The company provides its services though five categories namely, anti-invectives, vaccines, parasitic ides, medicated feed additives, and other pharmaceuticals.
The RSI has remained steady above 50 or "net neutral" and that is positive. Today we saw a tiny breakout from the consolidation zone. The PMO is rising and is not overbought. We just got an IT Trend Model BUY signal or silver cross. The OBV is confirming the short-term rising trend.
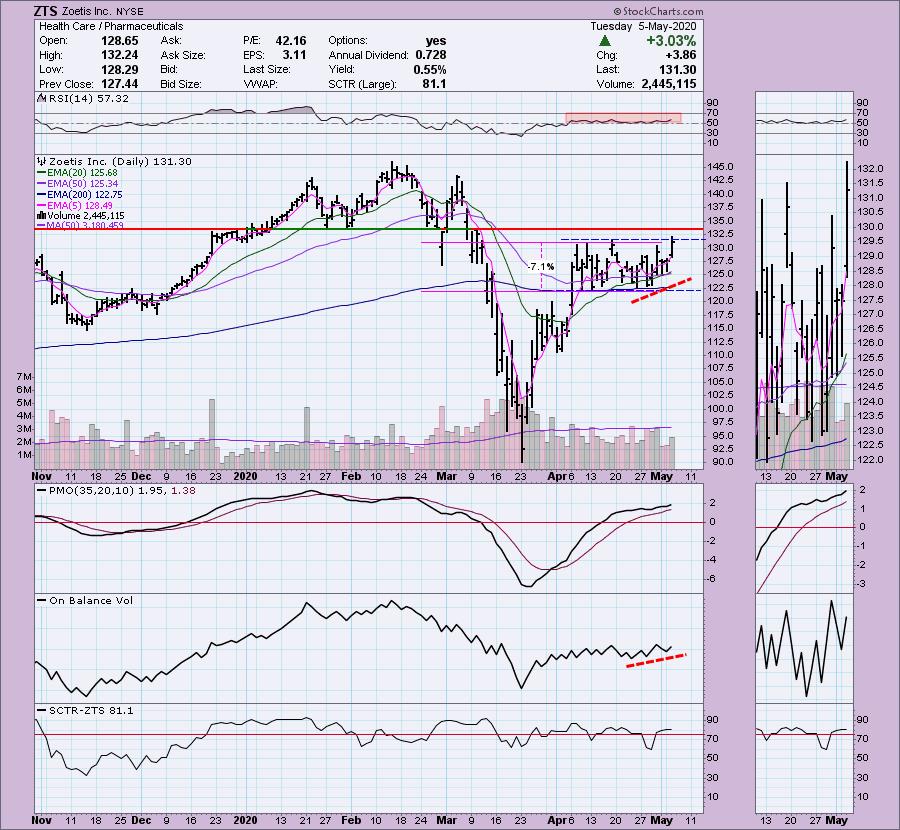
Upside target is the all-time high. I would want to reevaluate at that point. The weekly PMO suggests higher prices.
Current Market Outlook:
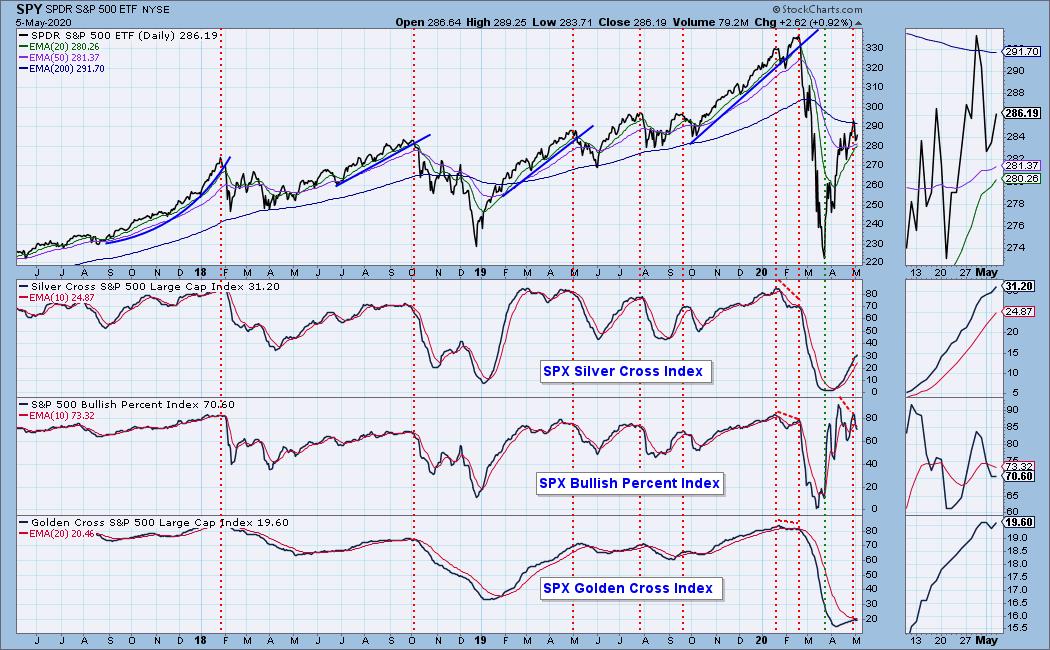
Market Environment: It is important to consider the odds for success. The Silver Cross Index measures the percentage of stocks on IT Trend Model BUY signals (20-EMA > 50-EMA), while the Golden Cross Index measures the percentage of stocks on LT Trend Model BUY signals (50-EMA > 200-EMA). Don't forget that as a "Diamonds" member, you have access to our GCI/SCI curated ChartList on DecisionPoint.com. You'll find it under "Members Only" links on the left side on the Blogs and Links Page. Here are the current percentages on the Silver and Golden Cross Indexes:
Diamond Index:
- Diamond Scan Results: 0
- Diamond Dog Scan Results: 272
- Diamond Bull/Bear Ratio: 0.00
For a more comprehensive review of current market conditions as well as analysis of Dollar, Gold, Oil and Bonds, subscribe to the DecisionPoint Alert! For a LIMITED TIME you can get a coupon code that will give you a discount for bundling your Diamonds subscription with the DecisionPoint Alert! Contact support@decisionpoint.com for more details.
Full Disclosure: I don't own any of the stocks above. I'm currently 20% in cash. My trading timeframe has moved from intermediate-term to short-term and therefore I'm investing more.

Erin Swenlin will be presenting at the The MoneyShow Las Vegas August 16 - 20 at Bally's/Paris Resort! You'll have an opportunity to meet Erin and discuss the latest DecisionPoint news and Diamond Scans. Claim your FREE pass here! You can watch online with this pass too!! There will be online events held in May and when I have more information I'll let you know.
Watch the latest episode of DecisionPoint with Carl & Erin Swenlin on Thursdays 8:00a EST or on the DecisionPoint playlist on the StockCharts TV YouTube channel here!
Technical Analysis is a windsock, not a crystal ball.
Happy Charting!
- Erin
erinh@stockcharts.com
NOTE: The stocks reported herein are from mechanical trading model scans that are based upon moving average relationships, momentum and volume. DecisionPoint analysis is then applied to get five selections from the scans. The selections given should prompt readers to do a chart review using their own analysis process. This letter is not a call for a specific action to buy, sell or short any of the stocks provided. There are NO sure things or guaranteed returns on the daily selection of "diamonds in the rough."
Helpful DecisionPoint Links:
DecisionPoint Shared ChartList and DecisionPoint Chart Gallery
Price Momentum Oscillator (PMO)
Swenlin Trading Oscillators (STO-B and STO-V)
For more links, go to DecisionPoint.com!
