
On Monday's DecisionPoint Show, Carl displayed a chart of the Retailers industry group and it was clear they were beginning to become interesting off bear market lows. I had a few show up in my scans that I'll cover below. Additionally I had some big names appear in my scan results. You'll have to do your own analysis on these, but I did cover some of these previously, I've added the date of the Diamonds Reports next to them: NFLX (3/31), REGN (4/1), AKAM (2/20), VRTX (4/7), CLX, LLY, CIEN, JD and NEM. I have been slowly adding and subtracting positions in my account and am about 60% in cash right now. All of these positions except maybe two are short-term horizon only. Be nimble. Stay alert. Stay connected. Consider taking profits when you hit target levels. We aren't out of the woods here, but we do need to take advantage of bear market rallies.
Live Trading Room - Tuesdays/Thursdays
I'm teaming up with Mary Ellen McGonagle (MEMInvestmentResearch.com) to do regular "LIVE Trading Room" sessions for FREE at 11:00a EST. We've had excellent reviews on our new LIVE Trading Rooms so far and plan on continuing them Tuesdays/Thursdays 11:00a EST. The link will be sent out the day before the event, so watch your email and tell your colleagues to sign up for our free email list on DecisionPoint.com to be notified!
Amazon.com Inc (AMZN) - Earnings: 4/23/2020 (AMC)
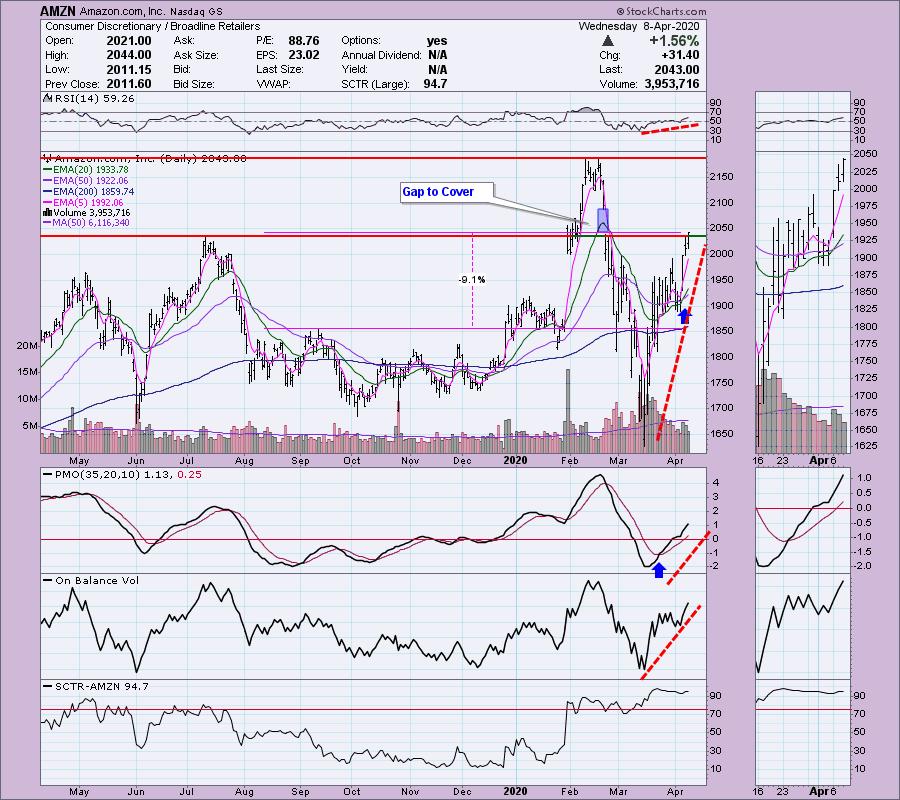
If we're talking Retailers, it is nearly impossible to leave AMZN out. I haven't covered Amazon in a Diamonds report yet, but today it hit the scan results and the chart is bullish. I note that price broke out and closed near its high today. It looks like it is ready to close that gap. We could see this resistance hold for a bit before it makes its way past that gap. The chart suggests it shouldn't take long given the strong PMO on a BUY signal, indicator rising bottoms that are confirming this current rally. The RSI is rising but isn't overbought yet. You could even set a conservative stop at around $1900 or go the distance and set a 9% stop along the September top and the bottom of the consolidation zone from January.
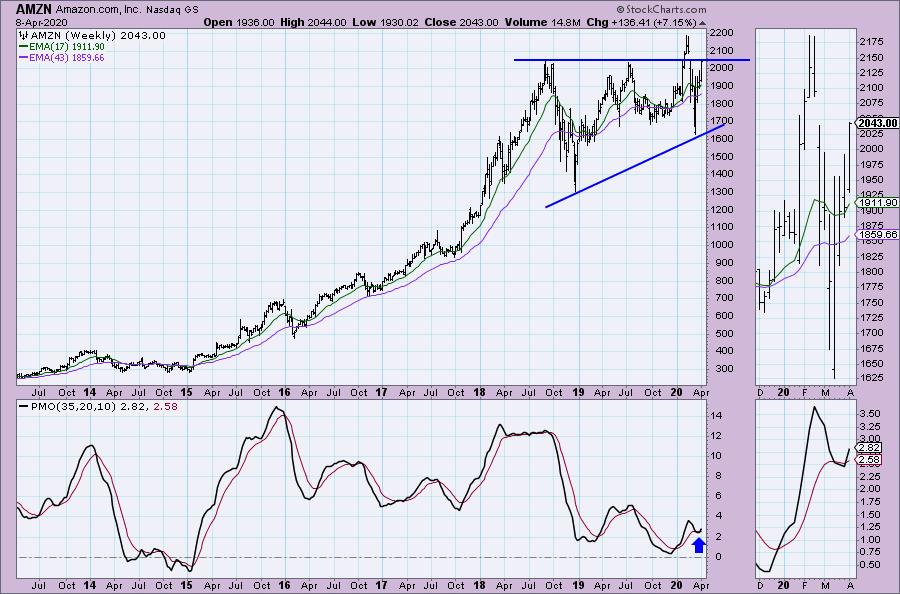
There is a lovely ascending triangle on the weekly chart. It failed to execute last time, but that was when the virus got the spotlight and all prices tanked in response. The PMO has a BUY signal on tap. We can't consider it a signal until prices close after the last day of trading for the week.
Welcome to DecisionPoint Daily Diamonds, wherein I highlight five "diamonds in the rough." These are selected from the results of my DecisionPoint scans, which search for stocks that could benefit from the trend and condition of the market. Remember, these are not recommendations to buy or sell, but are the most interesting of the stocks that surfaced in my scans. My objective is to save you the work of the initial, tedious culling process, but you need to apply your own analysis to see if these stocks pique your interest as well. There are no guaranteed winners here!
Dollar General Corp (DG) - Earnings: 5/28/2020 (BMO)
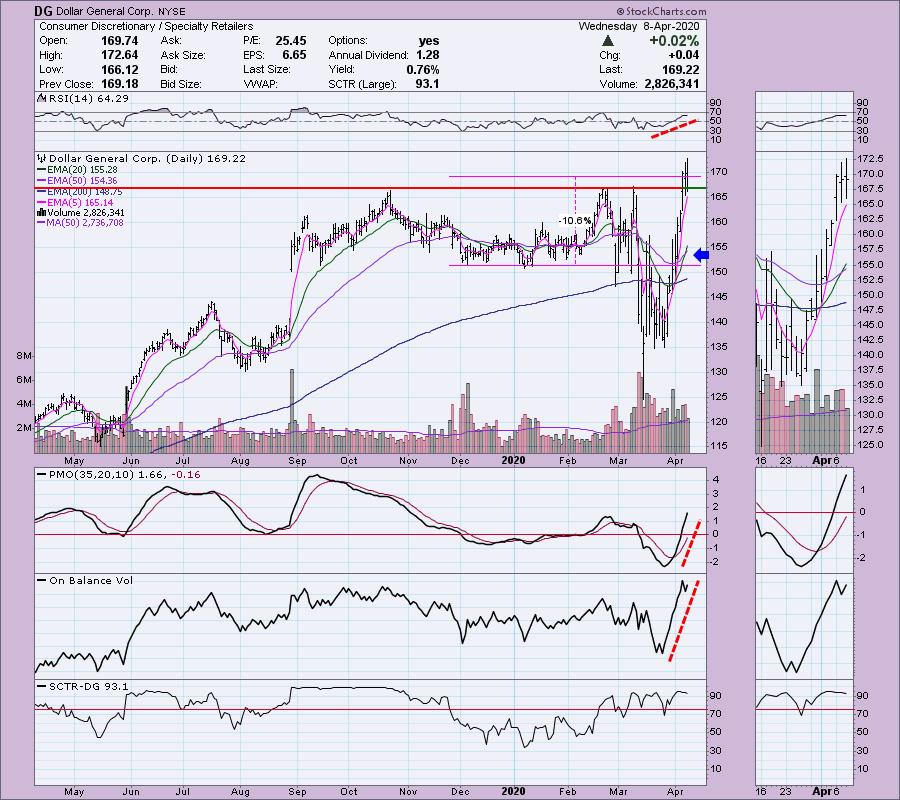
Another big retailer is Dollar General. It broke out this week and appears poised to go higher. The PMO is rising strong and is not overbought. The 20-EMA just crossed above the 50-EMA triggering an IT Trend Model BUY signal or "Silver Cross". RSI is flattening but is still positive and not overbought. Rising PMO and OBV confirm the current rally. You can set a conservative stop around $160 or a more aggressive one at $152.
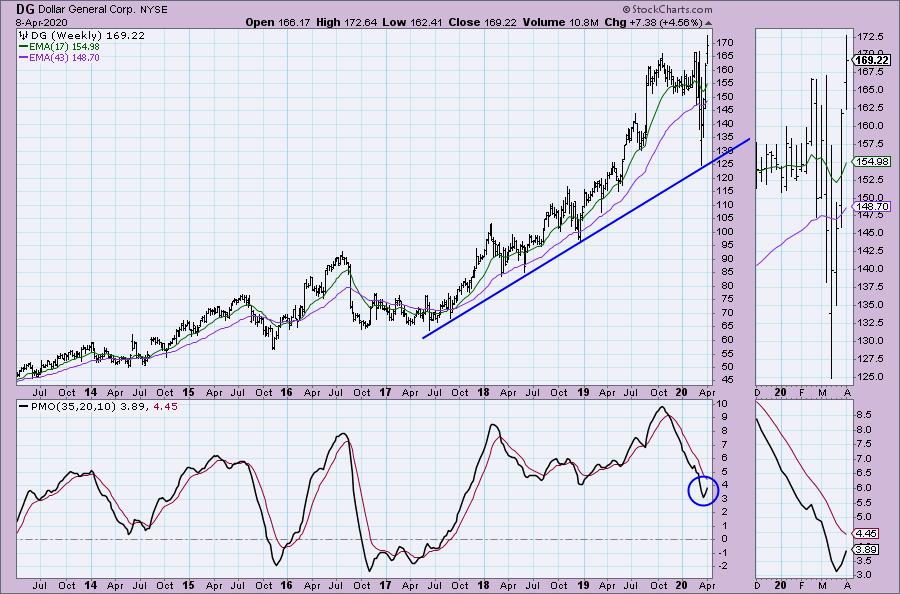
The PMO was yanked up by the extreme rally coming off the bear market low. As far as a target, since it is at all-time highs, you'll want to keep a close eye out for bearish divergences.
Don't forget, on Thursdays I look at reader-requested symbols, so shoot me an email at erin@decisionpoint.com. I read every email I receive and try to answer them all!
FTI Consulting Inc (FCN) - Earnings: 4/23/2020 (BMO)
While not in the retail space, this stock is lining up nicely. A positive OBV divergence preceded the rally off bear market lows (I'm always on the lookout for that type of OBV setup), unfortunately we're seeing it late. In any case, the RSI and PMO are rising and are not overbought. I believe all of the stocks I'm presenting today have very high SCTRs which does tell us that not only short-term technicals are looking good, but also IT technicals. Be sure and read up on the SCTR if you aren't familiar so you can see the calculations that go into it.
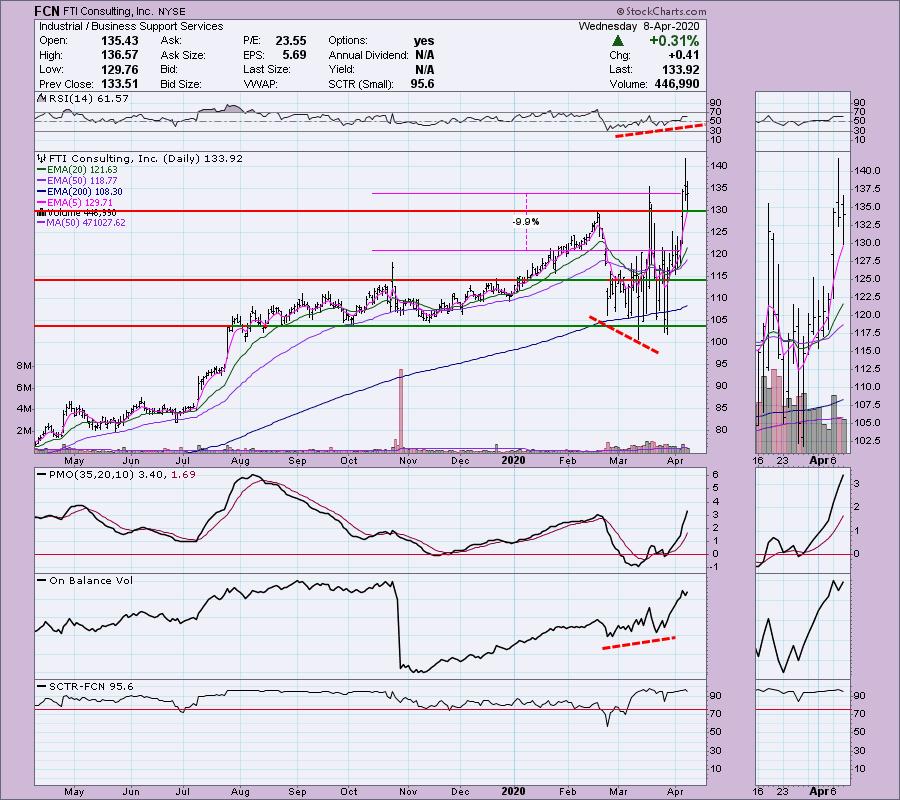
We see that FCN did accelerate its rising trend, but in a constructive, not parabolic way. We are looking at all-time highs, so like AMZN and DG, it is hard to define an upside target. I always babysit my stocks closely when they are making new all-time highs.
Walmart Inc (WMT) - Earnings: 5/19/2020 (BMO)
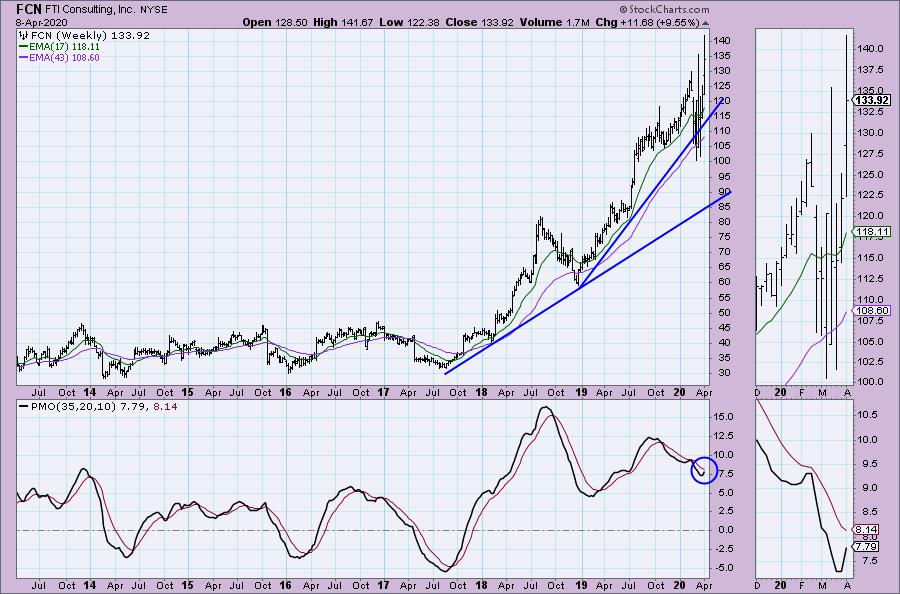
While Walmart is not considered a Retailer, it is a big name that came up on the scan results that is somewhat related to retail. I was surprised to see that the PMO wasn't particularly overbought. We also had a nice pullback yesterday that may give us a good entry. You can set a reasonable stop around $113.50. RSI is in the positive zone above 50 and is still in a rising trend.
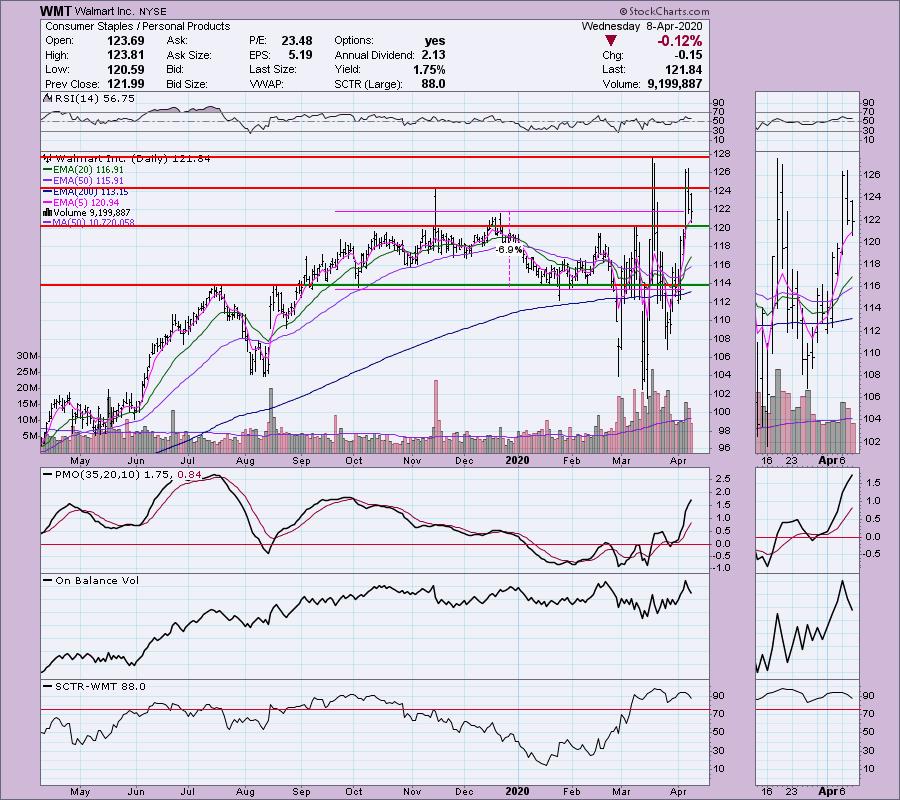
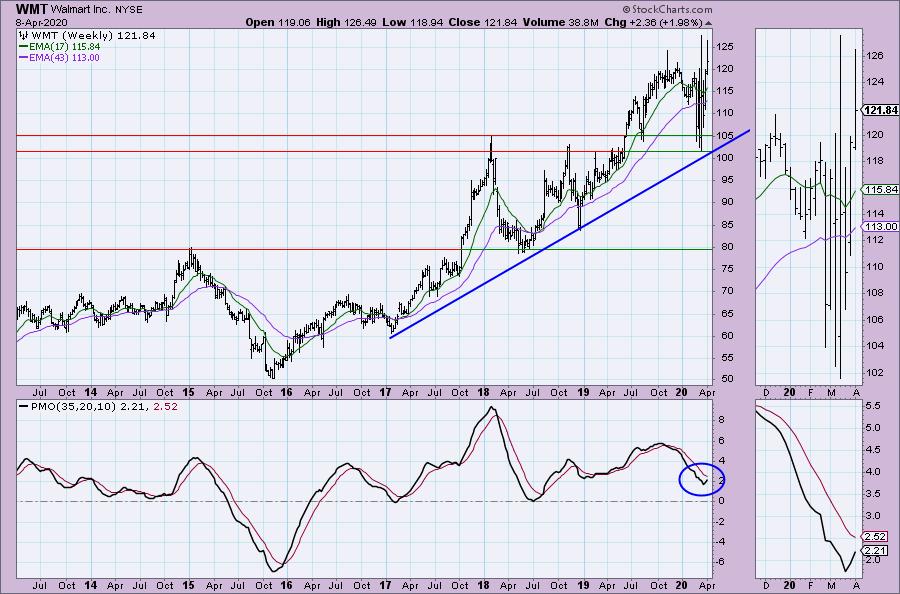
Really interesting weekly chart. Even with the bear market price drop, the longer-term rising trend was not compromised. this suggests internal strength. The PMO has now turned up.
SPDR S&P Retail ETF (XRT) - Earnings: N/A
For those who like to invest in ETFs, I think the Retail ETF is looking very interesting. We have a textbook double-bottom in last and today it executed. The upside target of this pattern would bring us right to the August low. An excellent place to take profits should it reach it. The PMO BUY signal looks good and the RSI is rising out of oversold territory. Setting a stop is a bit tricky, but chose the $29.25 area.
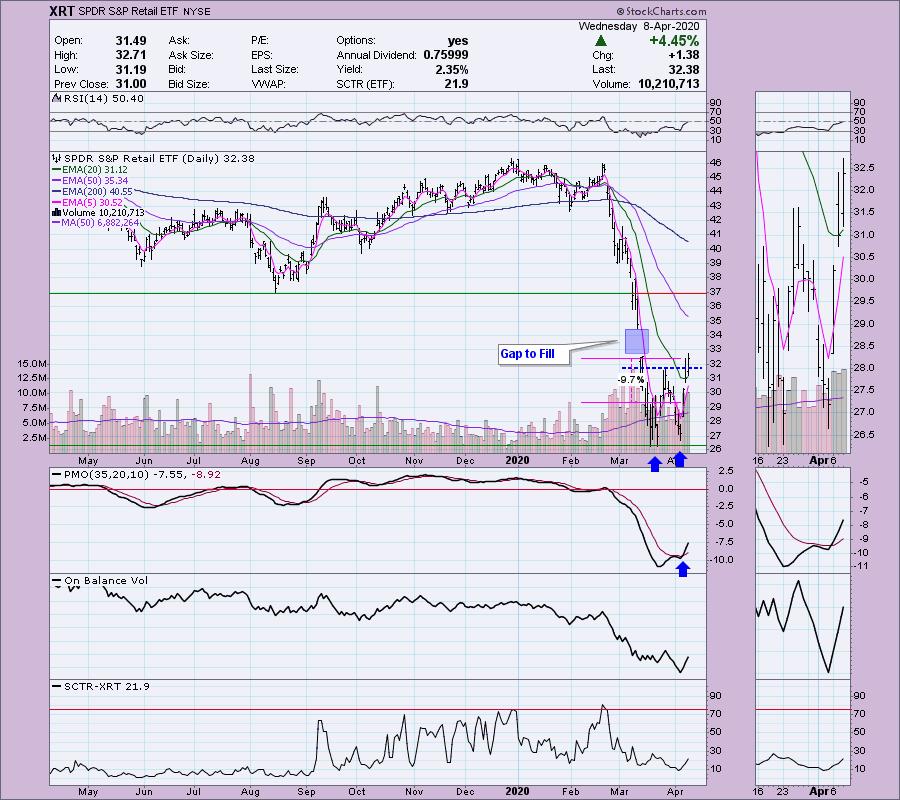
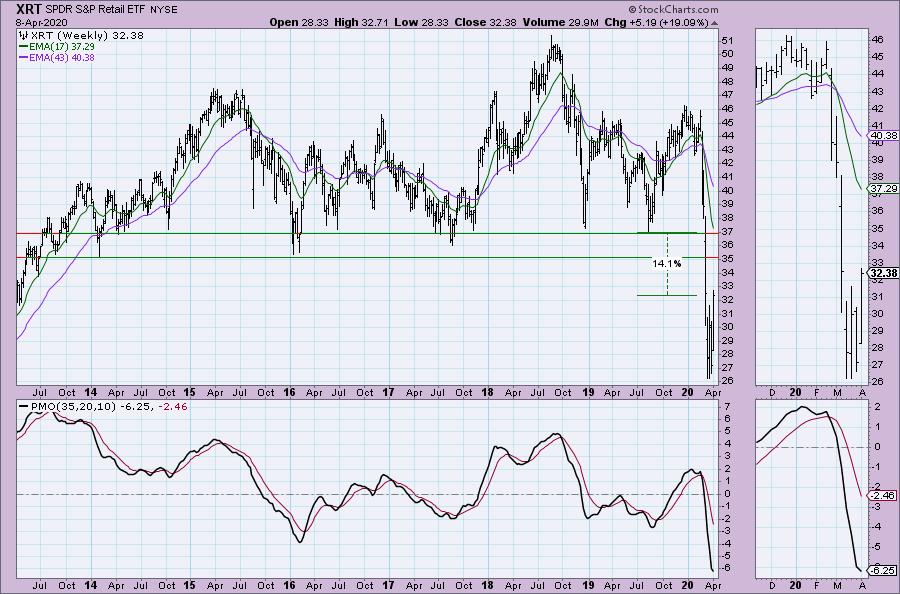
It isn't visible on the daily chart, but $35 might be a problem area of overhead resistance. Setting a target at $37 would give you a 14% profit, but watch closely when price approaches $35.
Current Market Outlook:
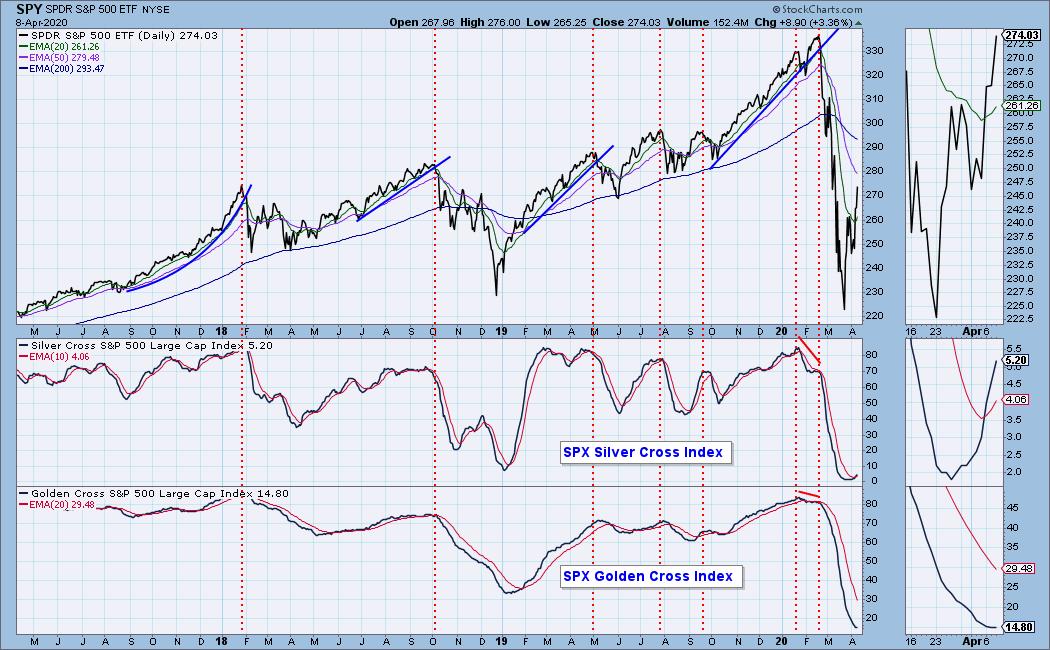
Market Environment: It is important to consider the odds for success. The Silver Cross Index measures the percentage of stocks on IT Trend Model BUY signals (20-EMA > 50-EMA), while the Golden Cross Index measures the percentage of stocks on LT Trend Model BUY signals (50-EMA > 200-EMA). Don't forget that as a "Diamonds" member, you have access to our GCI/SCI curated ChartList on DecisionPoint.com. You'll find it under "Members Only" links on the left side on the Blogs and Links Page. Here are the current percentages on the Silver and Golden Cross Indexes:
Diamond Index:
- Diamond Scan Results: 0
- Diamond Dog Scan Results: 2
- Diamond Bull/Bear Ratio: 0.00
For a more comprehensive review of current market conditions as well as analysis of Dollar, Gold, Oil and Bonds, subscribe to the DecisionPoint Alert! For a LIMITED TIME you can get a coupon code that will give you a discount for bundling your Diamonds subscription with the DecisionPoint Alert! Contact support@decisionpoint.com for more details.
Full Disclosure: I do not own any of the stocks above. I'm currently 60% in cash.

Erin Swenlin will be presenting at the The MoneyShow Las Vegas August 16 - 20 at Bally's/Paris Resort! You'll have an opportunity to meet Erin and discuss the latest DecisionPoint news and Diamond Scans. Claim your FREE pass here! You can watch online with this pass too!! There will be online events held in May and when I have more information I'll let you know.
Watch the latest episode of DecisionPoint with Carl & Erin Swenlin LIVE on Mondays 5:00p EST or on the StockCharts TV YouTube channel here!
Technical Analysis is a windsock, not a crystal ball.
Happy Charting!
- Erin
erinh@stockcharts.com
NOTE: The stocks reported herein are from mechanical trading model scans that are based upon moving average relationships, momentum and volume. DecisionPoint analysis is then applied to get five selections from the scans. The selections given should prompt readers to do a chart review using their own analysis process. This letter is not a call for a specific action to buy, sell or short any of the stocks provided. There are NO sure things or guaranteed returns on the daily selection of "diamonds in the rough."
Helpful DecisionPoint Links:
DecisionPoint Shared ChartList and DecisionPoint Chart Gallery
Price Momentum Oscillator (PMO)
Swenlin Trading Oscillators (STO-B and STO-V)
For more links, go to DecisionPoint.com!