
I love Reader Request Thursdays! It is always interesting to see what is hitting the radar of the DecisionPoint Faithful. Credit where credit is due--all of these but one is up on the week. Most requests come in a few days before I write about them here and I'm always impressed with the upside moves many of these make in the meantime. This week I have an array of stocks courtesy of my readers. I hope you find them as instructive as I did!
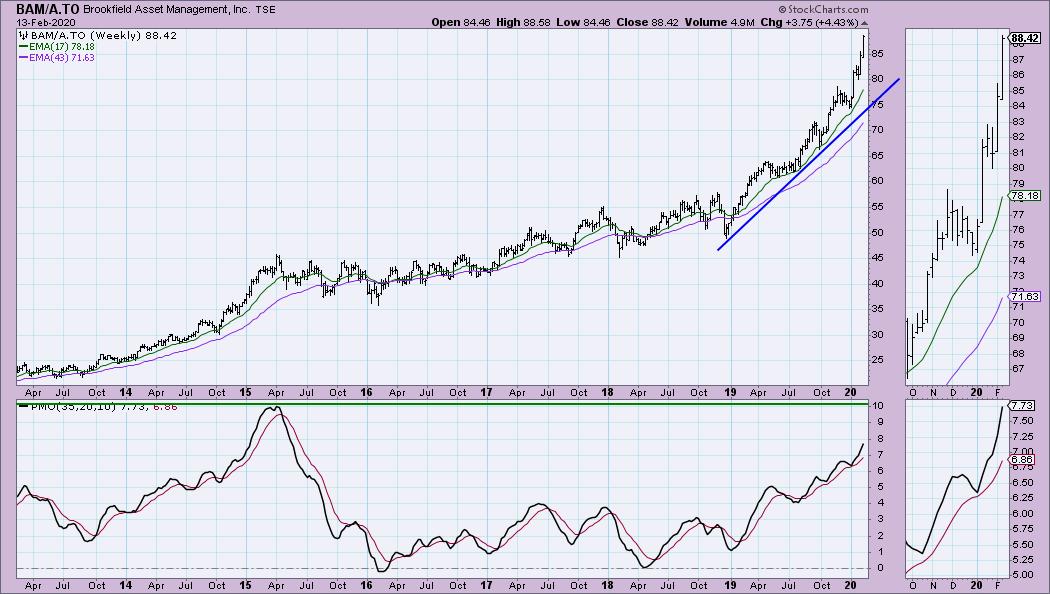
Brookfield Asset Management Inc (BAM/A.TO) - Earnings: N/A
My reader did admit to me that she hadn't pulled the trigger when she wanted to and is now interested in knowing if this one is still viable to jump onto. In all honesty, I wouldn't. Granted there are some great features on this chart, but the biggest problem for me is that it is very overbought right now. I've annotated a parabolic. It doesn't fit perfectly, but it does demonstrate how the rising trend continued to steepen as the stock has progressed since breaking out of the basing pattern in the middle of 2019. The PMO is rising strongly, but it is extremely overbought right now. One thing to look at more closely as well are the tops this past year on the OBV. Notice that as price continued to rise steeply, the OBV tops weren't really increasing as we want. When price makes a new high, I want to see a new high on the OBV. Granted the tops on the OBV are rising somewhat, but it is just something to keep in mind. If you get involved now, you could set a stop at the cardinal top in January or at $80 short-term support.

The weekly PMO is looking great here. But do notice how the rising bottoms trendline has been blown away by the vertical move this year. The PMO suggests this could go higher, but it could be ready to exhaust soon.
Welcome to DecisionPoint Daily Diamonds, wherein I highlight five "diamonds in the rough." These are selected from the results of my DecisionPoint scans, which search for stocks that could benefit from the trend and condition of the market. Remember, these are not recommendations to buy or sell, but are the most interesting of the stocks that surfaced in my scans. My objective is to save you the work of the initial, tedious culling process, but you need to apply your own analysis to see if these stocks pique your interest as well. There are no guaranteed winners here!
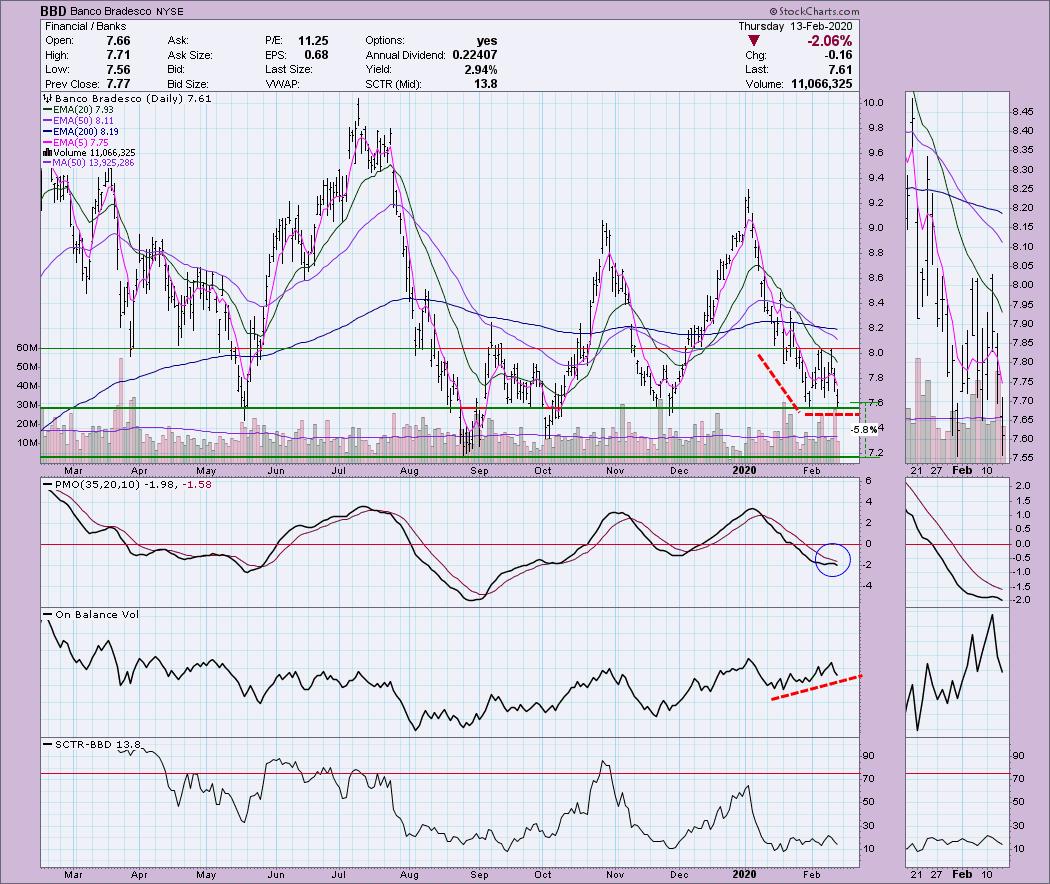
Banco Bradesco (BBD) - Earnings: 4/30/2020 (BMO)
Yes, this one had a bad day for sure, but I think it makes it more attractive coming back to a strong support level. Unfortunately, today's move turned the PMO down, but that would change quickly if we get a bounce off support. What is really intriguing is the nice positive divergence on the OBV. The worry I have is whether this support level will hold as there is another major support level at $7.20. The good news is that support level would make an excellent stop.
The weekly chart doesn't look too good. We can see the drop below the rising bottoms trendline and a PMO SELL signal. The 17-week EMA has just crossed below the 43-week EMA, but we have seen that whipsaw previously. This still has possibilities and that $7.20 support level isn't that far.

Don't forget, on Thursdays I look at reader-requested symbols, so shoot me an email at erin@decisionpoint.com. I read every email I receive and try to answer them all!
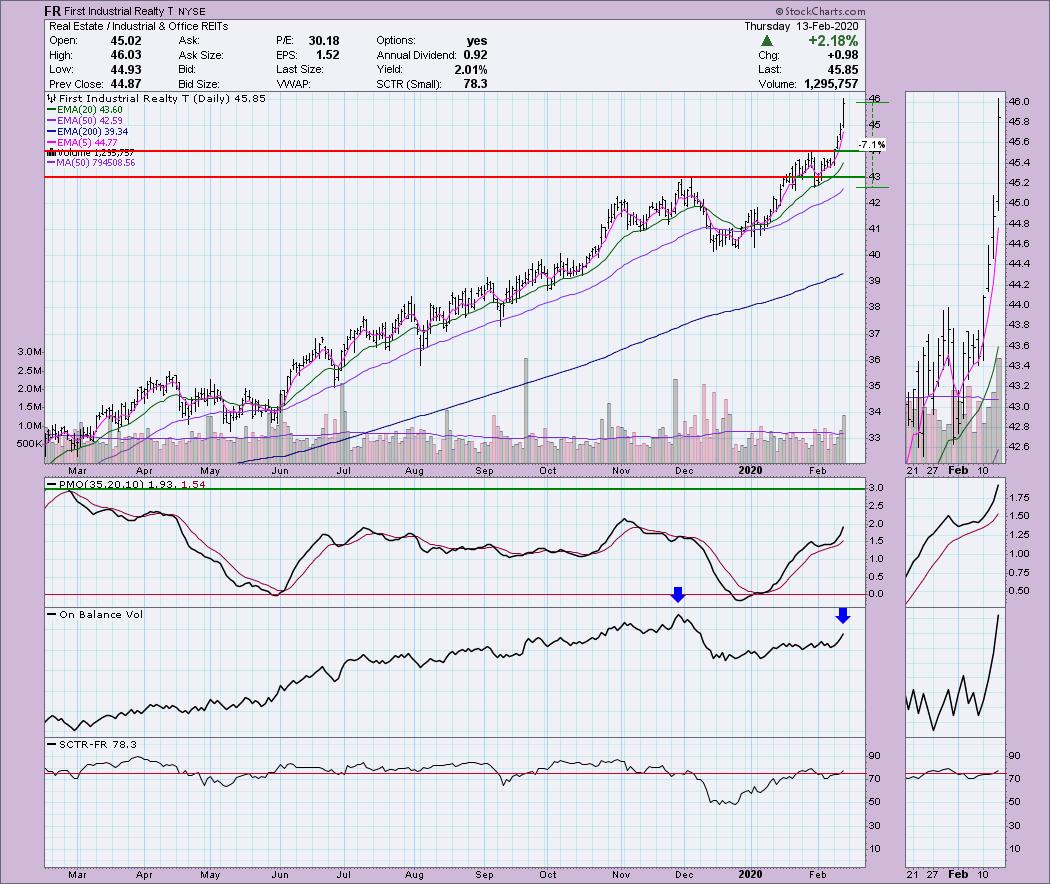
First Industrial Realty (FR) - Earnings: 4/22/2020 (AMC)
REITS have been making a stir as of late and FR is no different. I've seen REITS on my scans daily. The rally, especially given today, is short-term parabolic and there is a negative divergence with the OBV currently. We saw a price breakout, but not confirmation from the OBV as it is still pretty far away before overcoming its top in December. Looking at the volume bars in the thumbnail, we can see that accumulation is definitely taking place currently, so I can forgive the OBV, especially since it hasn't actually topped yet.
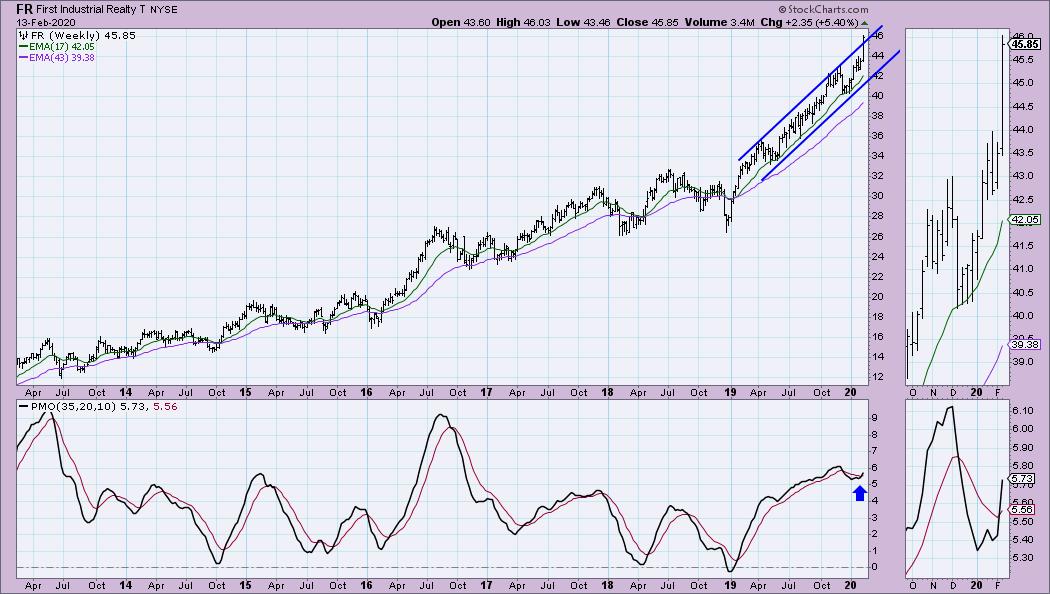
The weekly PMO looks great with a new BUY signal on tap for this week (the crossover BUY signal doesn't count until after Friday's close). It's been in a nice rising trend, not parabolic. It is now making an upside break from the rising trend channel. I just wonder how long it can maintain its rally if it gets too steep. Overall I like this stock.
International Business Machines (IBM) - Earnings: 4/14/2020 (AMC)
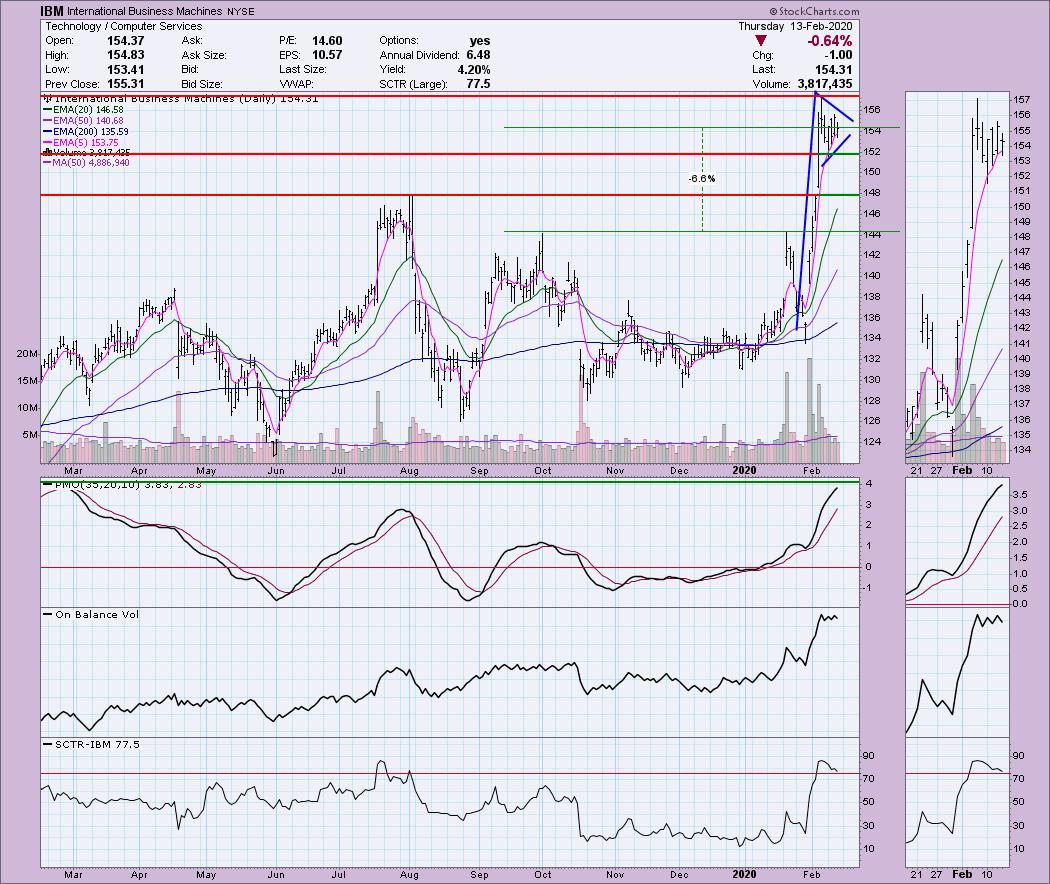
I hadn't looked at the IBM chart in awhile so when it was requested, I was very interested. The vertical rally in January forms a flagpole and we can see the pennant attached is a symmetrical triangle in the short term. The expectation is an upside breakout and move the height of the flagpole. I'm not so sure we will see that just yet given that IBM is very overbought right now. The PMO is at the top of the range and needs to work out of those overbought conditions. The good news is that a pause (more flag/pennant development) and even a small pullback may do the trick. The PMO is already decelerating.
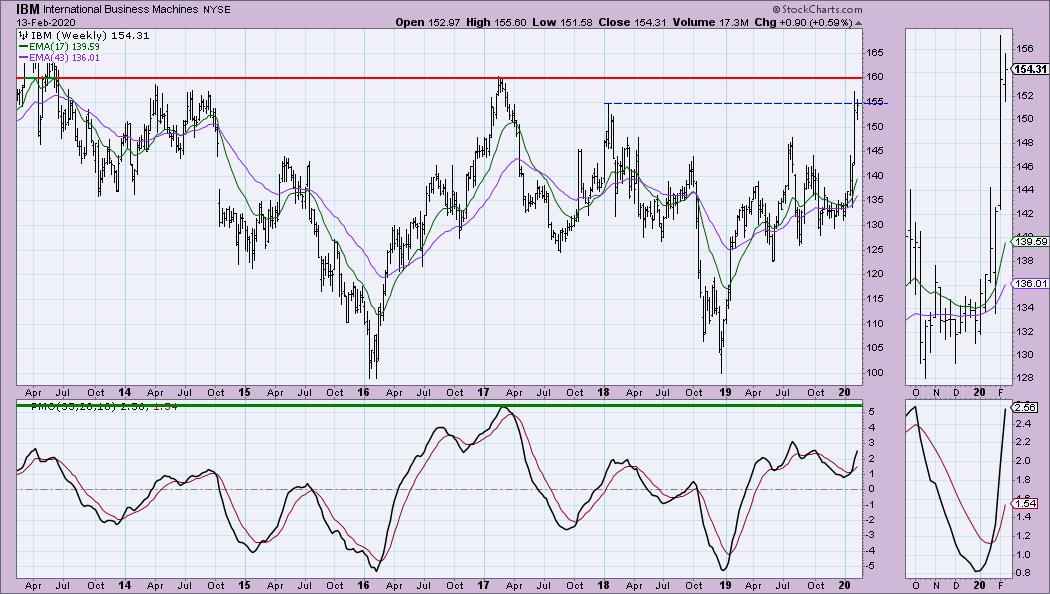
The weekly PMO looks great and is only moderately overbought. The big issue here is the proximity of overhead resistance. Stocks (investors) have muscle memory if you will; we all remember the dollar levels we buy and depending on how long the investment window, when those levels are hit, it many times triggers action. In this case, $160 is a level to watch. If it can breakout above that, IBM will become even more interesting! If you own it, I'd keep it and watch resistance.
Illinois Tool Works Inc (ITW) - Earnings: 4/30/2020 (BMO)
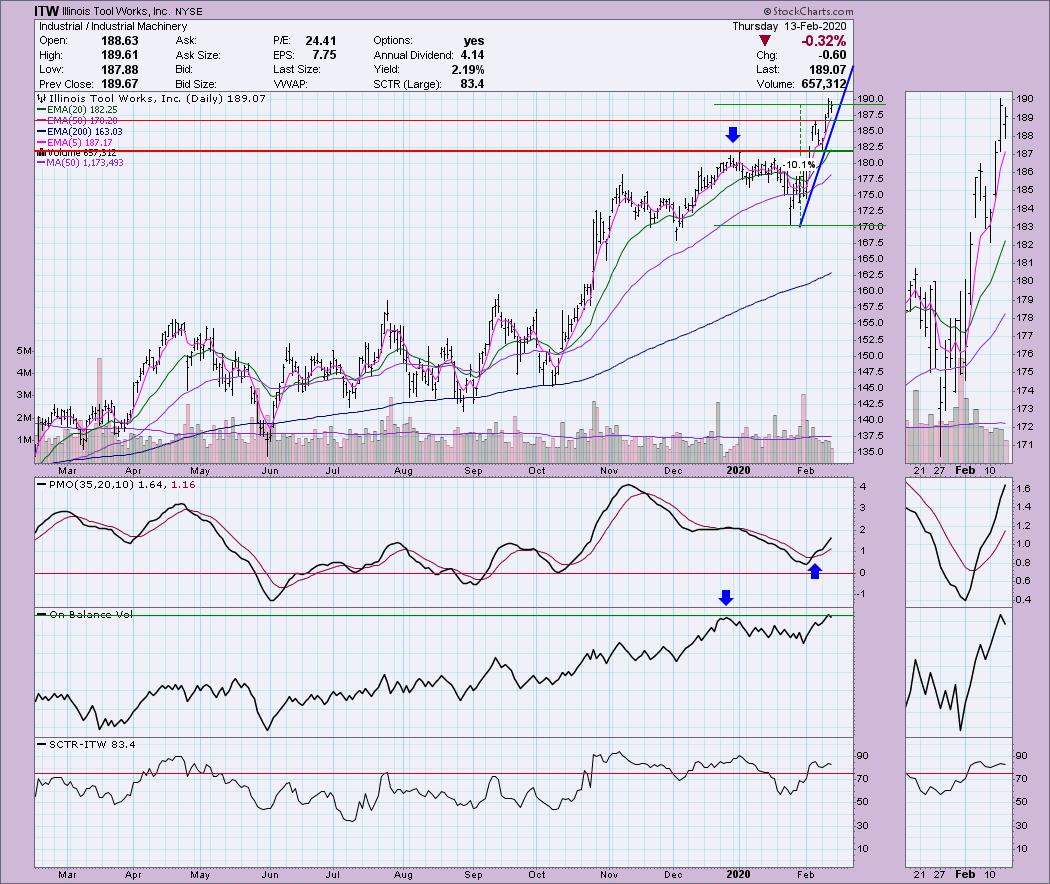
Here we have another near vertical rally. This speaks to the strength of the stock, but it also is very hard to maintain. Always keep that in mind when entering a position. That said, the chart is positive overall. The PMO has initiated a BUY signal. I'd like to see an OBV breakout with this price breakout, but overall it is rising. I'd probably set a tighter stop than 10%, but that is the next major support level. The SCTR has been relatively strong all year.
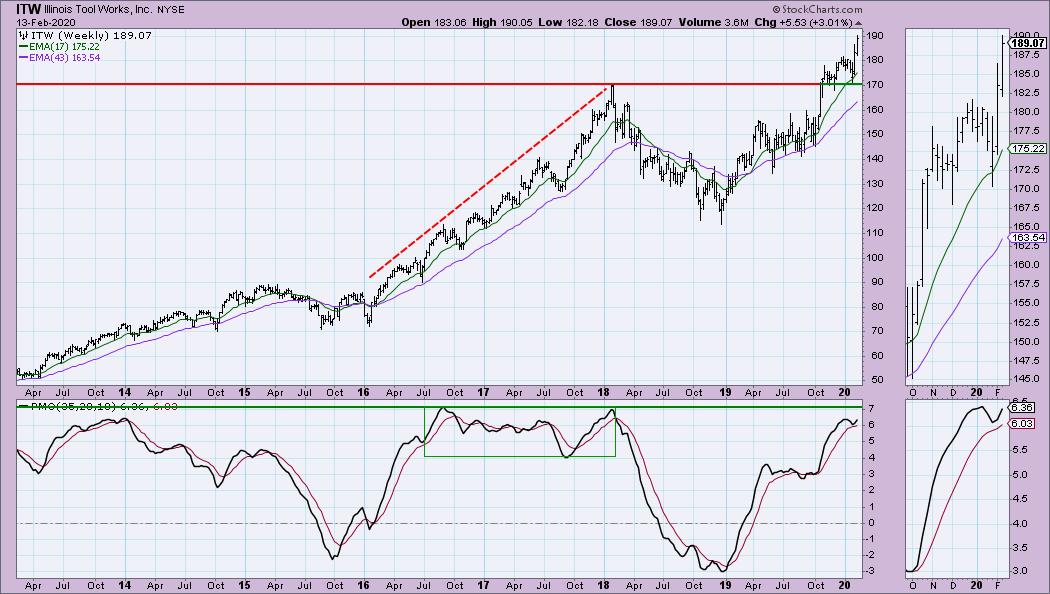
The weekly PMO is overbought but rising. One thing to keep in mind and this chart is a great example, overbought conditions can persist in a bull market. ITW is in a bull market configuration, look at the PMO back in 2016/2017. Price moved swiftly higher and the PMO stayed overbought from mid-2016 to the beginning of 2018. I still think this has upside potential.
Current Market Outlook:
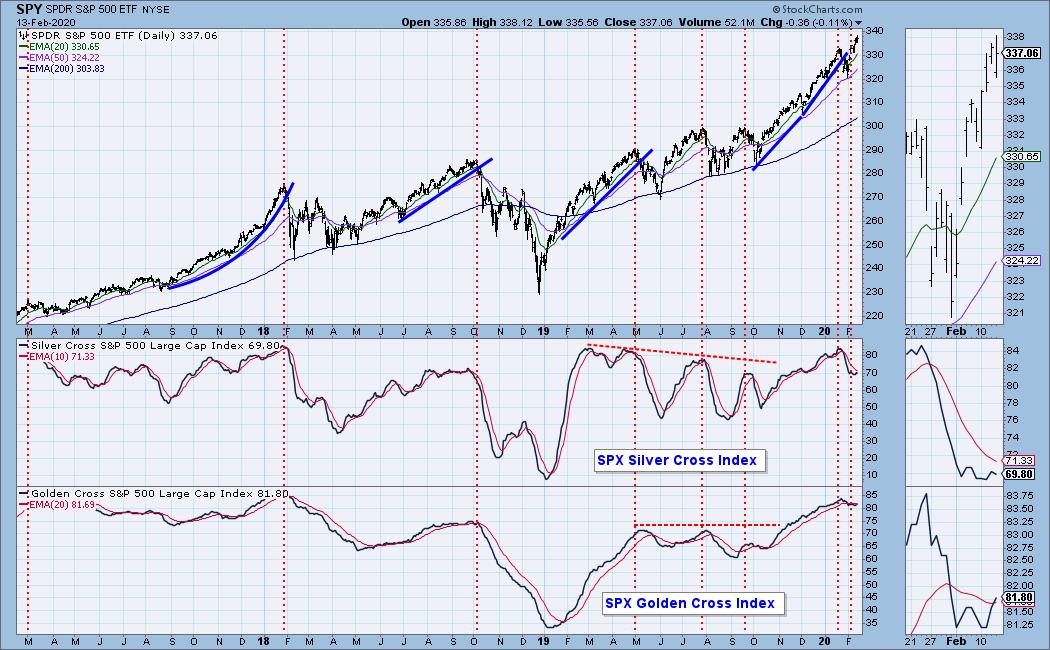
Market Environment: It is important to consider the odds for success. The Silver Cross Index measures the percentage of stocks on IT Trend Model BUY signals (20-EMA > 50-EMA), while the Golden Cross Index measures the percentage of stocks on LT Trend Model BUY signals (50-EMA > 200-EMA). Don't forget that as a "Diamonds" member, you have access to our GCI/SCI curated ChartList on DecisionPoint.com. You'll find it under "Members Only" links on the left side on the Blogs and Links Page. Here are the current percentages on the Silver and Golden Cross Indexes:
Diamond Index:
- Diamond Scan Results: 28
- Diamond Dog Scan Results: 4
- Diamond Bull/Bear Ratio: 7.00
For a more comprehensive review of current market conditions as well as analysis of Dollar, Gold, Oil and Bonds, subscribe to the DecisionPoint Alert! For a LIMITED TIME you can get a coupon code that will give you a discount for bundling your Diamonds subscription with the DecisionPoint Alert! Contact support@decisionpoint.com for more details.
Full Disclosure: I do not own any of the stocks above. I'm currently 20% in cash.

Erin Swenlin will be presenting at the The MoneyShow Las Vegas on May 11-13, 2020! You'll have an opportunity to meet Erin and discuss the latest DecisionPoint news and Diamond Scans. The conference is free to attend or view online!
Watch the latest episode of DecisionPoint with Carl & Erin Swenlin LIVE on Mondays 5:00p EST or on the StockCharts TV YouTube channel here!
Technical Analysis is a windsock, not a crystal ball.
Happy Charting!
- Erin
erinh@stockcharts.com
NOTE: The stocks reported herein are from mechanical trading model scans that are based upon moving average relationships, momentum and volume. DecisionPoint analysis is then applied to get five selections from the scans. The selections given should prompt readers to do a chart review using their own analysis process. This letter is not a call for a specific action to buy, sell or short any of the stocks provided. There are NO sure things or guaranteed returns on the daily selection of "diamonds in the rough."
Helpful DecisionPoint Links:
DecisionPoint Shared ChartList and DecisionPoint Chart Gallery
Price Momentum Oscillator (PMO)
Swenlin Trading Oscillators (STO-B and STO-V)
For more links, go to DecisionPoint.com!