
Quite an array of stocks and ETFs to show you today! The coronavirus is still a big concern, but I noticed a lot of China ETFs and companies in my Bottom Fishing Scan today. One Chinese company has a very low priced stock so for the risk takers out there, it could be interesting. I also noticed that there are "V" Bottom chart patterns on a plethora of charts in my scan results. I wrote these patterns in yesterday's Diamonds Report. They are bullish reversal patterns. A reminder that I have added percentages that can help you determine your stop level. I typically set mine just below major support levels or EMAs so the percentages vary.
Abercrombie & Fitch Co (ANF) - Earnings: 3/4/2020 (BMO)
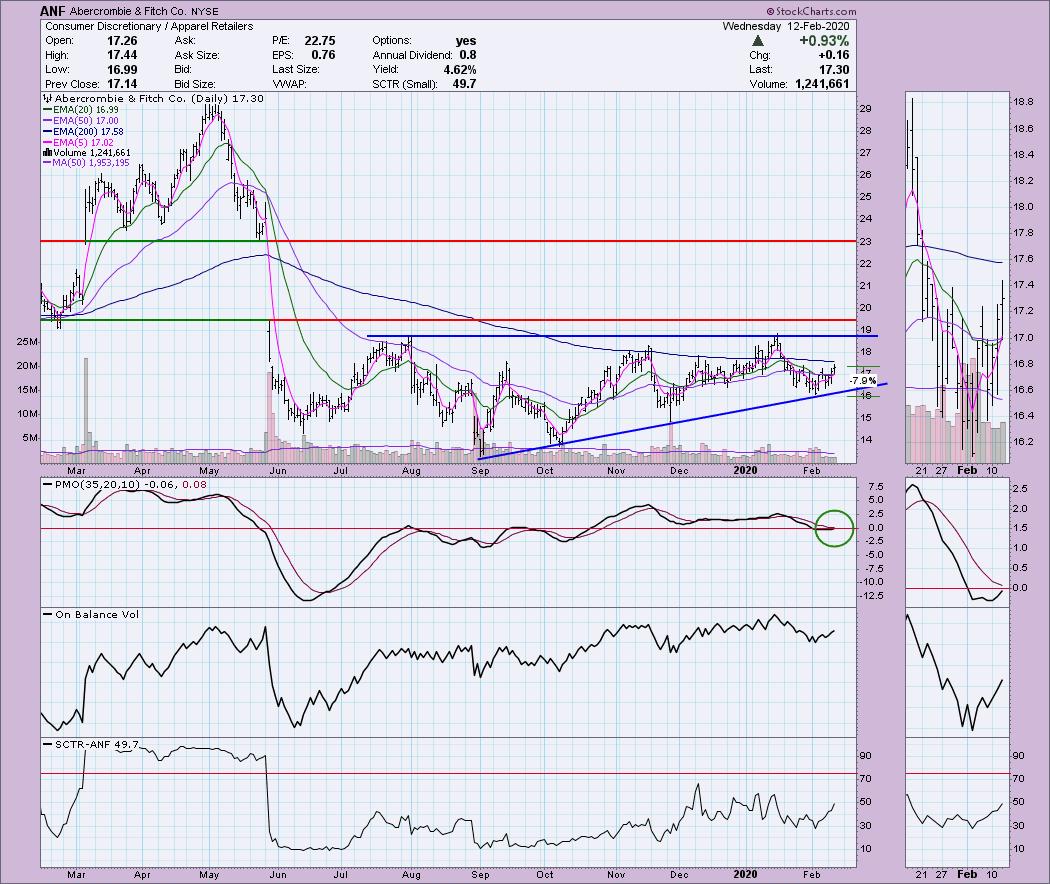
This one came in on one of my bottoms fishing scans. I like the Consumer Discretionary sector right now so I was immediately interested in seeing this chart. I believe there is an ascending triangle formation here. These patterns are bullish and the expected move is a breakout above resistance and a target that is determined by the height of the back of the pattern. Interestingly, that would mean price would close the gap from last May. The PMO turned up just below the zero line and is preparing for a BUY signal.
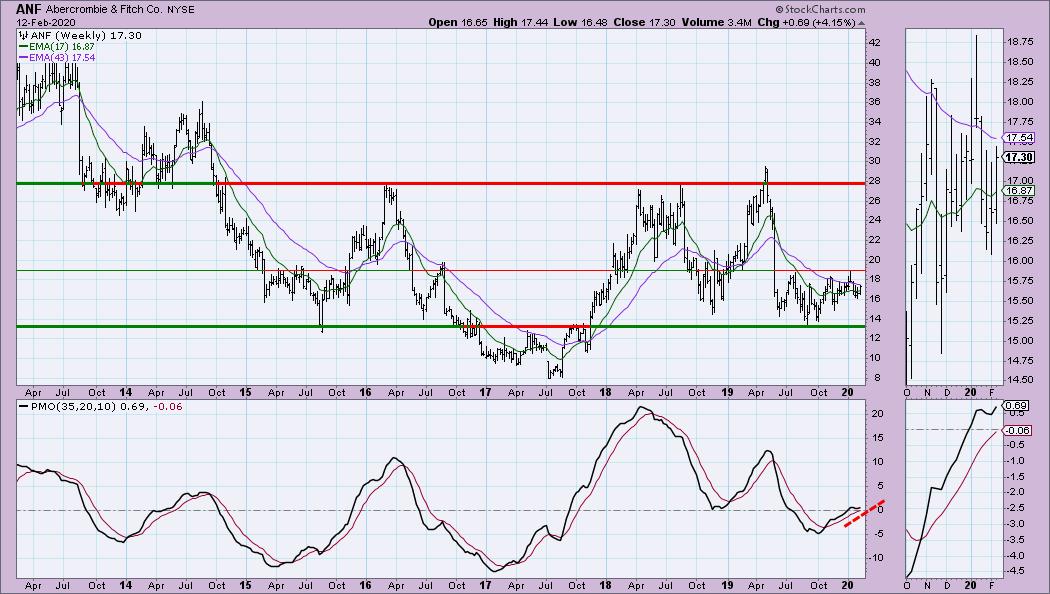
I was pleasantly surprised to see a positive weekly chart on a bottom fishing scan result. The PMO is encouraging as it has just turned back up and reached positive territory. It isn't overbought at all.
Welcome to DecisionPoint Daily Diamonds, wherein I highlight five "diamonds in the rough." These are selected from the results of my DecisionPoint scans, which search for stocks that could benefit from the trend and condition of the market. Remember, these are not recommendations to buy or sell, but are the most interesting of the stocks that surfaced in my scans. My objective is to save you the work of the initial, tedious culling process, but you need to apply your own analysis to see if these stocks pique your interest as well. There are no guaranteed winners here!
iShares China Large-Cap ETF (FXI) - Earnings: N/A
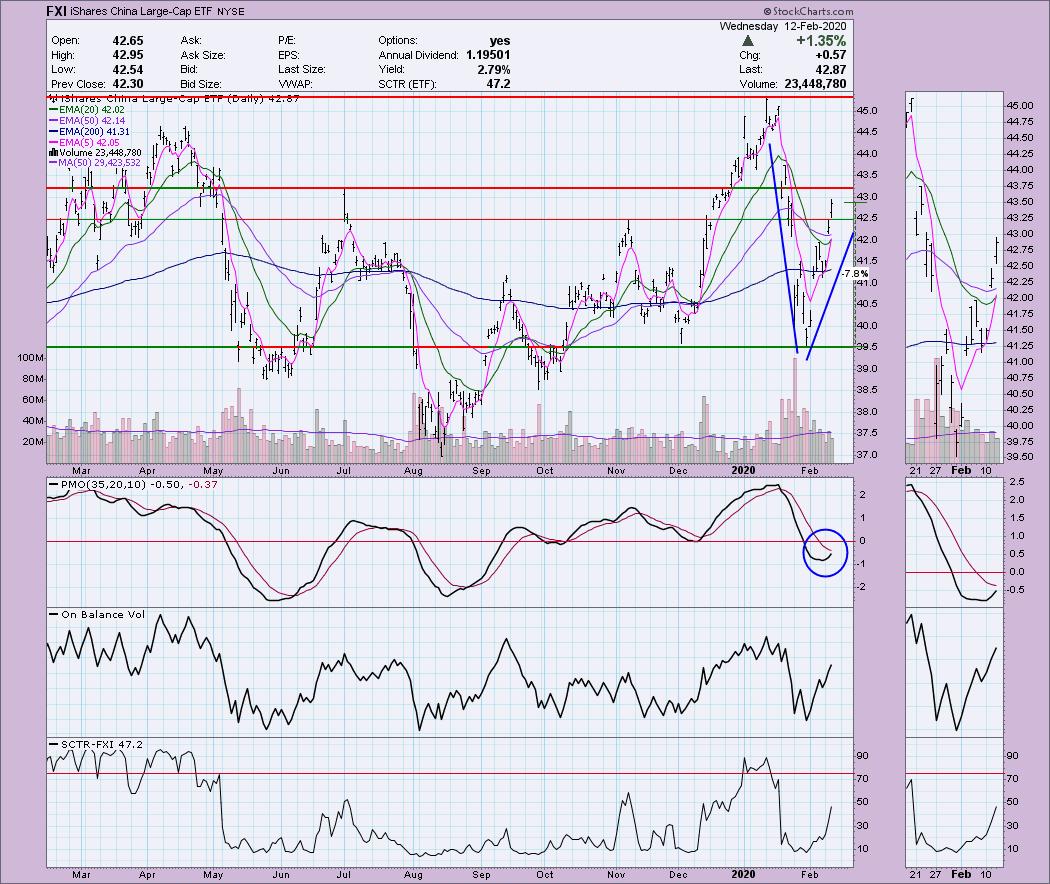
Here is the first "V" bottom. The basic idea behind these patterns is that when you get a retracement of about 38% of the first side of the "V", you should expect price to meet the most recent cardinal top and continue higher. The PMO has turned up in oversold territory and is headed for a BUY signal. The OBV is confirming the move. The SCTR is rising very nicely.
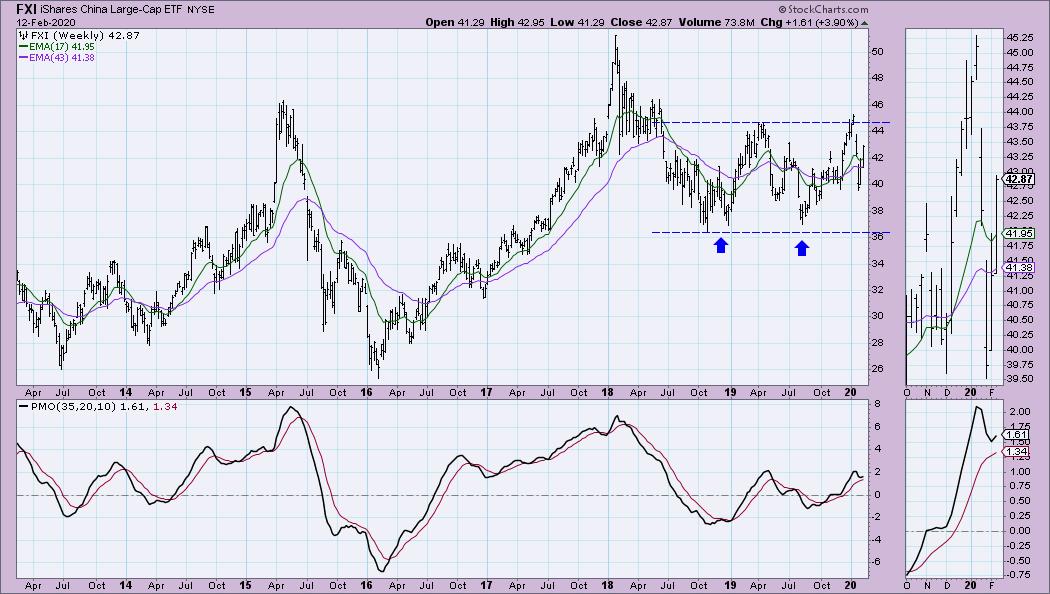
The weekly PMO has ticked up and we can see price is back above the 17-week EMA. I suppose you could make a case for a bullish double-bottom here, but I don't really like the failure to confirm that began the "V". Upside target is around $46.
Don't forget, on Thursdays I look at reader-requested symbols, so shoot me an email at erin@decisionpoint.com. I read every email I receive and try to answer them all!
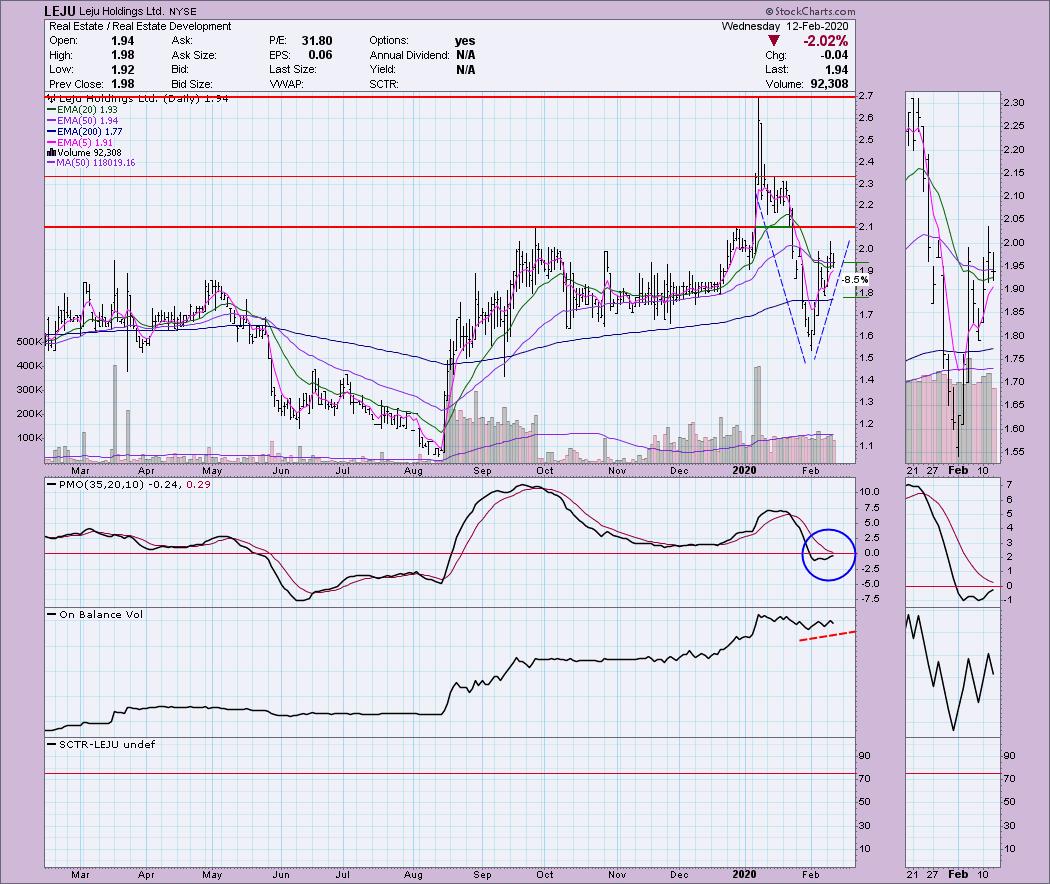
Leju Holdings Ltd (LEJU) - Earnings: 3/16/2020 (BMO)
Another "V" bottom for you. Before I get into the analysis of this chart, please note that while it isn't a "penny" stock, it is very low-priced and that carries risk right out of the gate, so position size wisely! If your risk profile is more conservative, you can skip to the next 'diamond'. With a stock like this, you have to set a fairly low stop just to prevent volatility from stopping you out too soon. The expectation of this "V" should bring price up to $2.70 but I suspect you'll have to endure some nerve-wracking volatility on the way up.
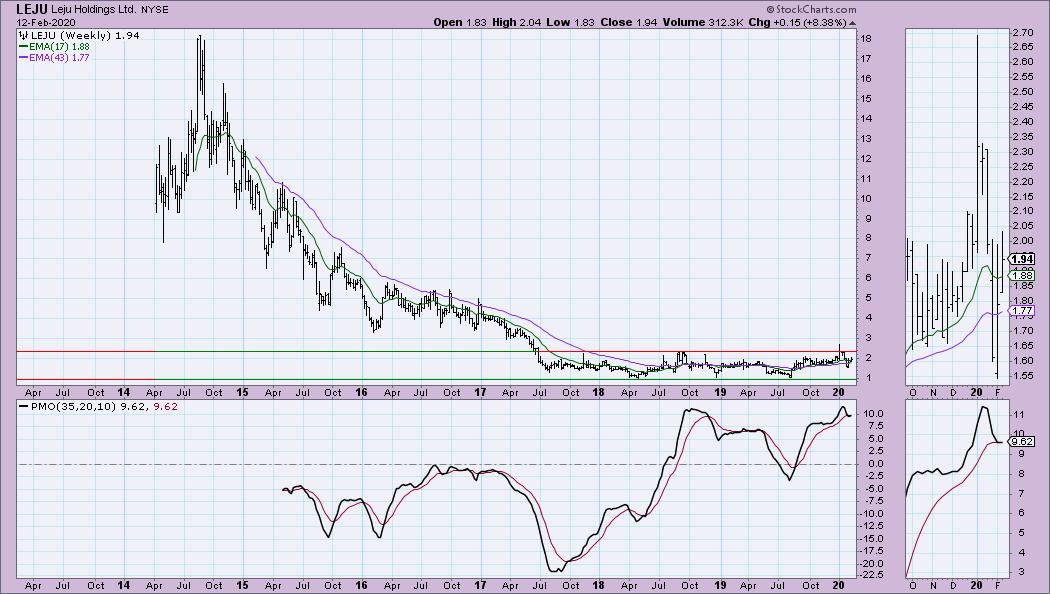
The weekly PMO hasn't quite triggered a SELL signal yet, so it may be avoided. LEJU is in a basing pattern. The best time to pick up stocks like this is when they breakout from the base. In the meantime with this one being priced so low, it has a well-defined trading range that could be useful.
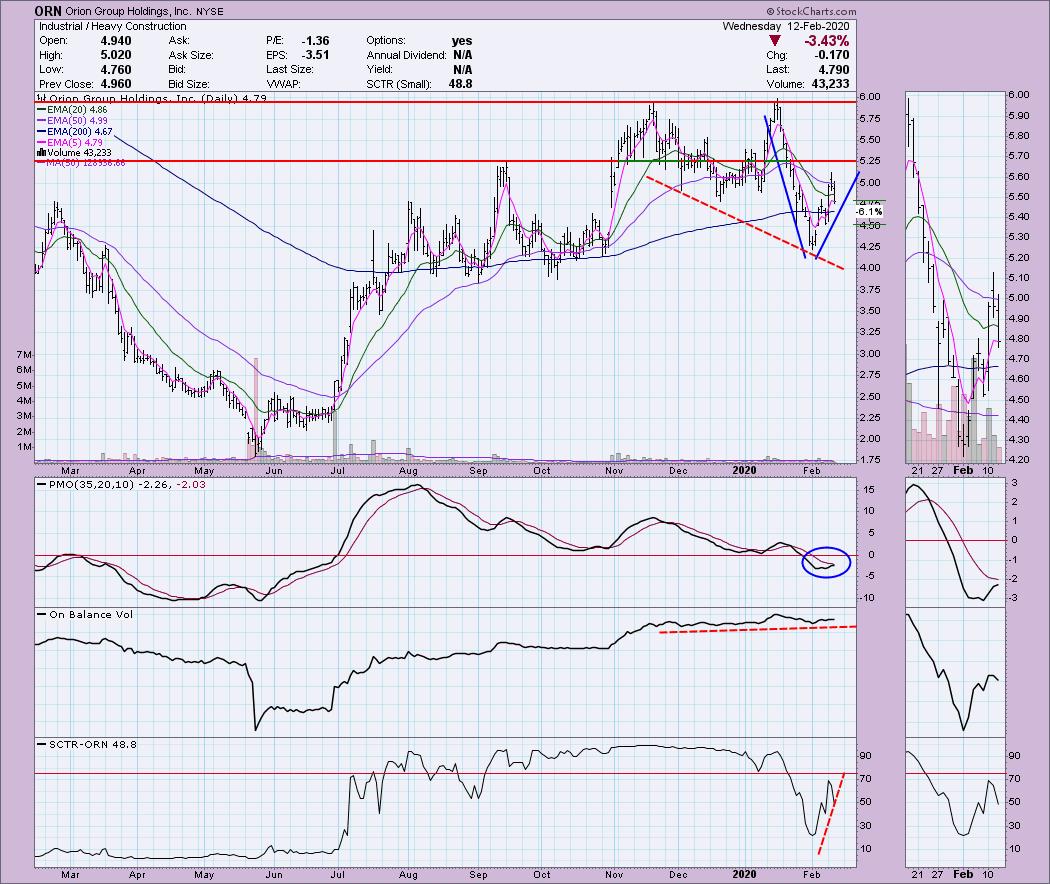
Orion Group Holdings Inc (ORN) - Earnings: 3/16/2020 (AMC)
This one had a deep pullback today, but didn't break below the steep rising trendline that forms the "V". The PMO is rising toward a BUY signal. In addition to a very positive chart pattern, the positive divergence with the OBV is impressive. The SCTR is making quite a comeback right now too.
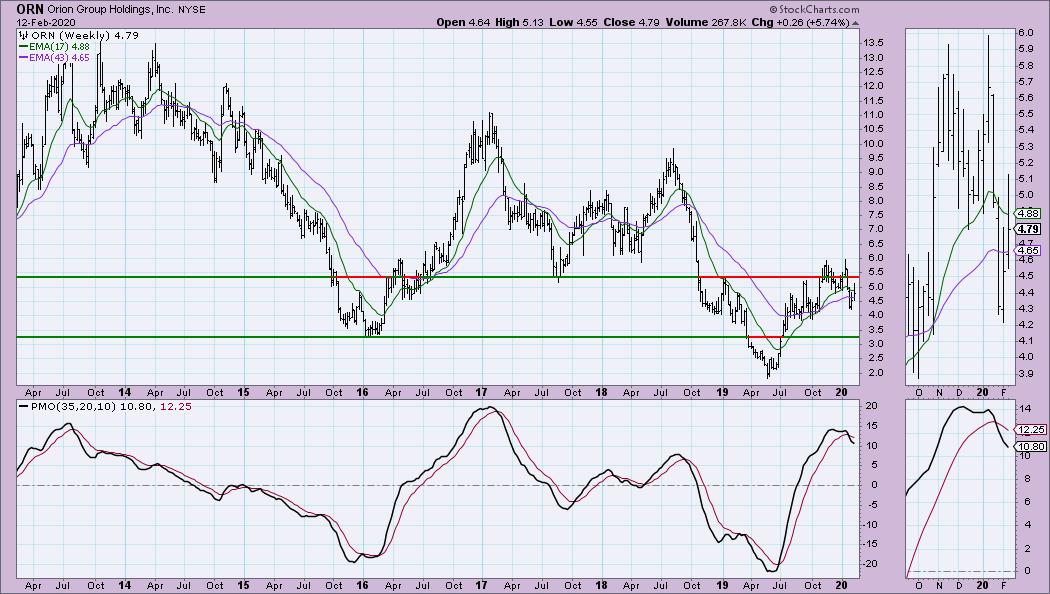
Not the best weekly chart. This is also a low-priced stock and should be position sized well. It is nearing resistance at the 2017 low and prior tops in 2019 so it may have limited IT potential.
Weingarten Realty Investors (WRI) - Earnings: 2/25/2020 (AMC)
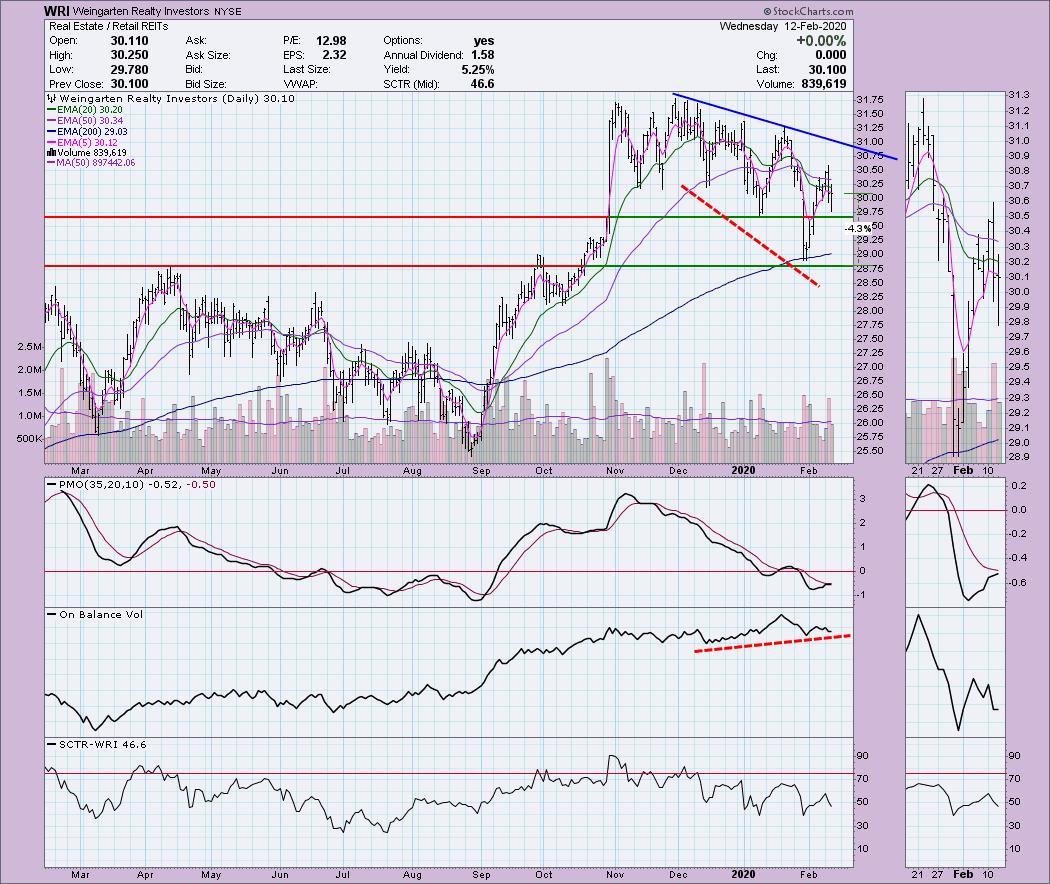
Overall WRI is in a declining trend. What really appealed to me was the nice positive divergence with the OBV. The SCTR is alright. The PMO is in oversold territory and appears ready to give us a BUY signal. However, I do note that the last PMO BUY signal was late and actually signaled a decline, and not an easy one. At least we can set a fairly tight stop here for protection.
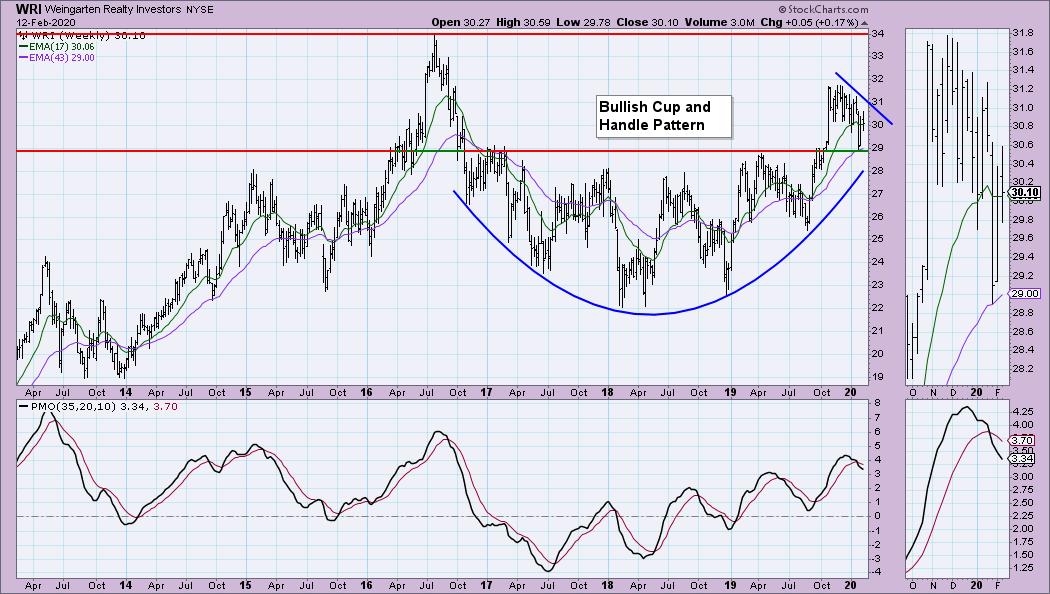
The weekly chart has a very large cup and handle bullish chart pattern. We can see the importance of holding the $29 support level. I wouldn't want to have anything to do with it if it can't hold that level.
Current Market Outlook:
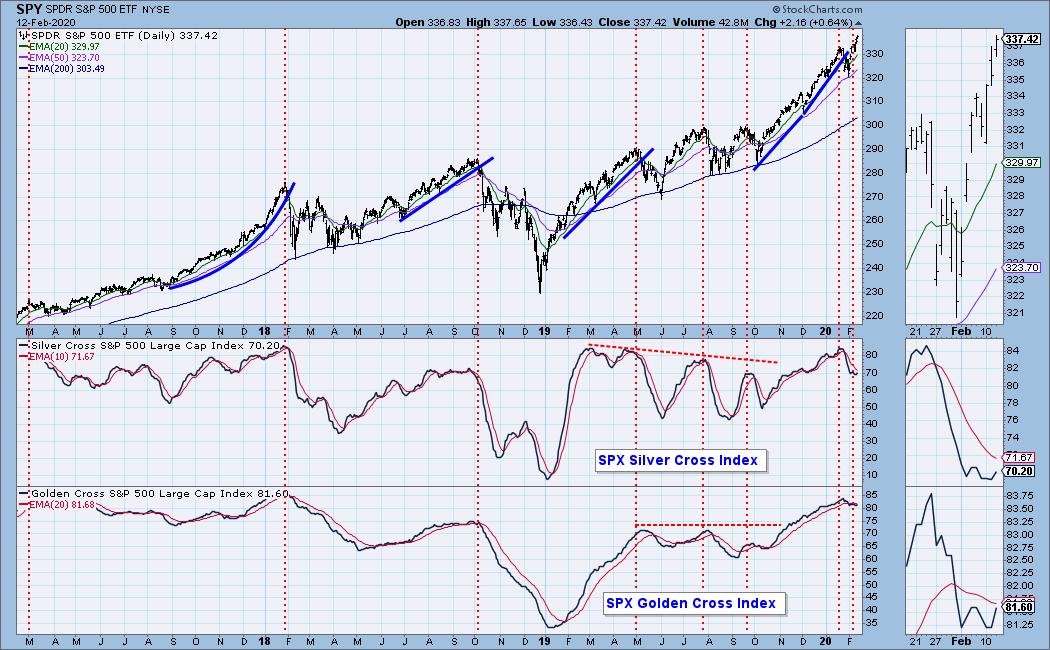
Market Environment: It is important to consider the odds for success. The Silver Cross Index measures the percentage of stocks on IT Trend Model BUY signals (20-EMA > 50-EMA), while the Golden Cross Index measures the percentage of stocks on LT Trend Model BUY signals (50-EMA > 200-EMA). Don't forget that as a "Diamonds" member, you have access to our GCI/SCI curated ChartList on DecisionPoint.com. You'll find it under "Members Only" links on the left side on the Blogs and Links Page. Here are the current percentages on the Silver and Golden Cross Indexes:
Diamond Index:
- Diamond Scan Results: 28
- Diamond Dog Scan Results: 5
- Diamond Bull/Bear Ratio: 5.60
For a more comprehensive review of current market conditions as well as analysis of Dollar, Gold, Oil and Bonds, subscribe to the DecisionPoint Alert! For a LIMITED TIME you can get a coupon code that will give you a discount for bundling your Diamonds subscription with the DecisionPoint Alert! Contact support@decisionpoint.com for more details.
Full Disclosure: I do not own any of the stocks above. I'm currently 20% in cash.

Erin Swenlin will be presenting at the The MoneyShow Las Vegas on May 11-13, 2020! You'll have an opportunity to meet Erin and discuss the latest DecisionPoint news and Diamond Scans. The conference is free to attend or view online!
Watch the latest episode of DecisionPoint with Carl & Erin Swenlin LIVE on Mondays 5:00p EST or on the StockCharts TV YouTube channel here!
Technical Analysis is a windsock, not a crystal ball.
Happy Charting!
- Erin
erinh@stockcharts.com
NOTE: The stocks reported herein are from mechanical trading model scans that are based upon moving average relationships, momentum and volume. DecisionPoint analysis is then applied to get five selections from the scans. The selections given should prompt readers to do a chart review using their own analysis process. This letter is not a call for a specific action to buy, sell or short any of the stocks provided. There are NO sure things or guaranteed returns on the daily selection of "diamonds in the rough."
Helpful DecisionPoint Links:
DecisionPoint Shared ChartList and DecisionPoint Chart Gallery
Price Momentum Oscillator (PMO)
Swenlin Trading Oscillators (STO-B and STO-V)
For more links, go to DecisionPoint.com!