
On today's DecisionPoint Show, I ran Carl's Scan to give everyone a look at what beat down stocks were hitting the radar. Carl's Scan finds stocks that are near lows after declining for some time but are now showing signs of turning it all around. While I was glancing at some of the charts, I decided they need to be discussed in today's report.
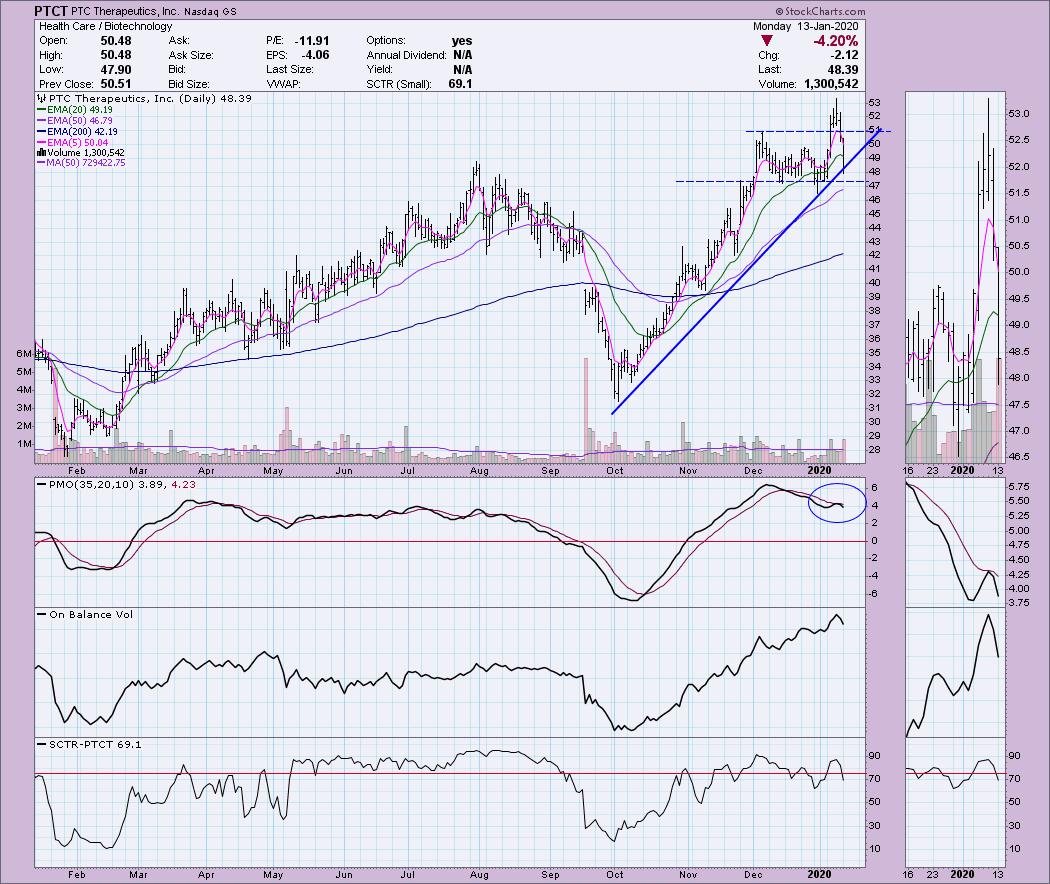
Before I get started though, I wanted to revisit the stock that I told everyone on Thursday I was planning to buy, PTCT. Friday's action took PTCT down below support at the early December high. I decided to take the plunge with a stop at $47.50. Well, speaking of "plunges"... today was terrible, but my stop wasn't activated. I'm planning on selling it tomorrow if it doesn't right the ship. The loss of short-term support wasn't really an issue for me, but losing the rising trend is a signal to dump it.
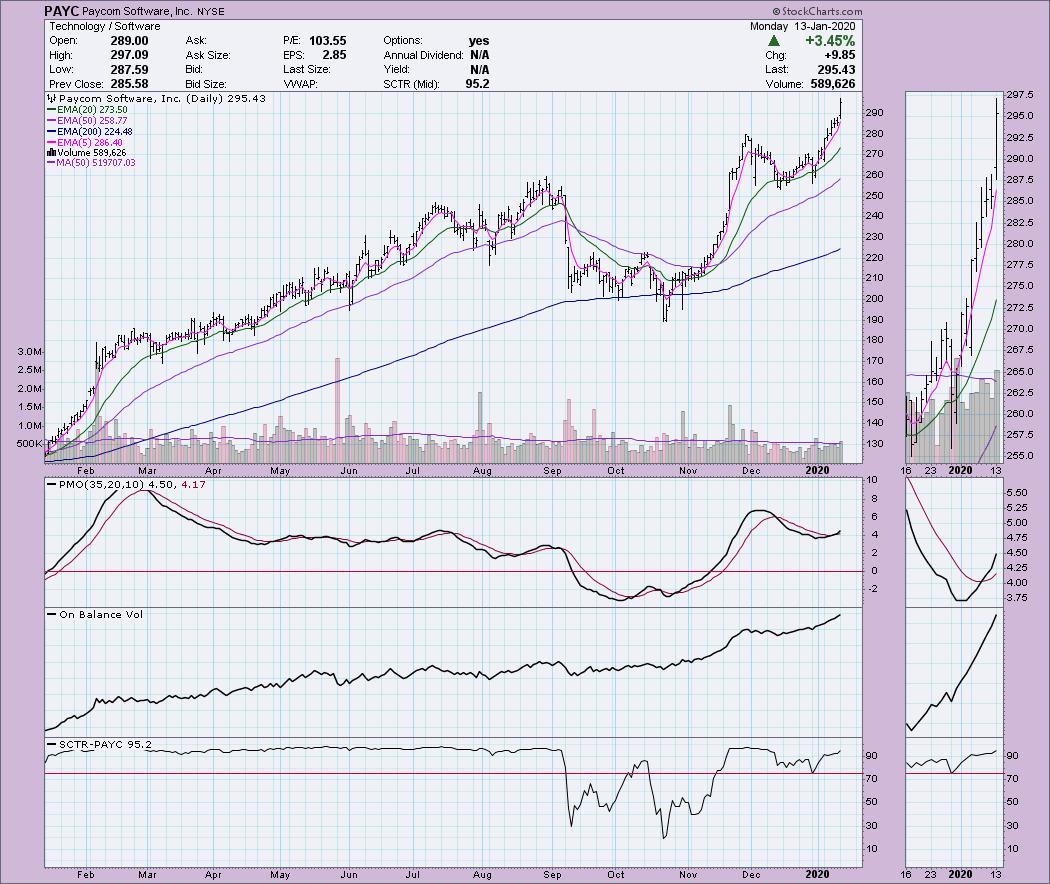
PAYC I talked about twice last week. I bought that one on Friday morning and it is doing what it is supposed to.
I've moved the Market Summary information to the bottom of the Diamonds articles for your review. I won't be commenting much there as I take care of that in the DP Alert daily report I do Mon - Friday. Subscribe to the DecisionPoint Alert!
Don't forget, on Thursdays I look at reader-requested symbols, so shoot me an email at erin@decisionpoint.com. I read every email I receive and try to answer them all!
Welcome to DecisionPoint Daily Diamonds, wherein I highlight five "diamonds in the rough." These are selected from the results of my DecisionPoint scans, which search for stocks that could benefit from the trend and condition of the market. Remember, these are not recommendations to buy or sell, but are the most interesting of the stocks that surfaced in my scans. My objective is to save you the work of the initial, tedious culling process, but you need to apply your own analysis to see if these stocks pique your interest as well. There are no guaranteed winners here!
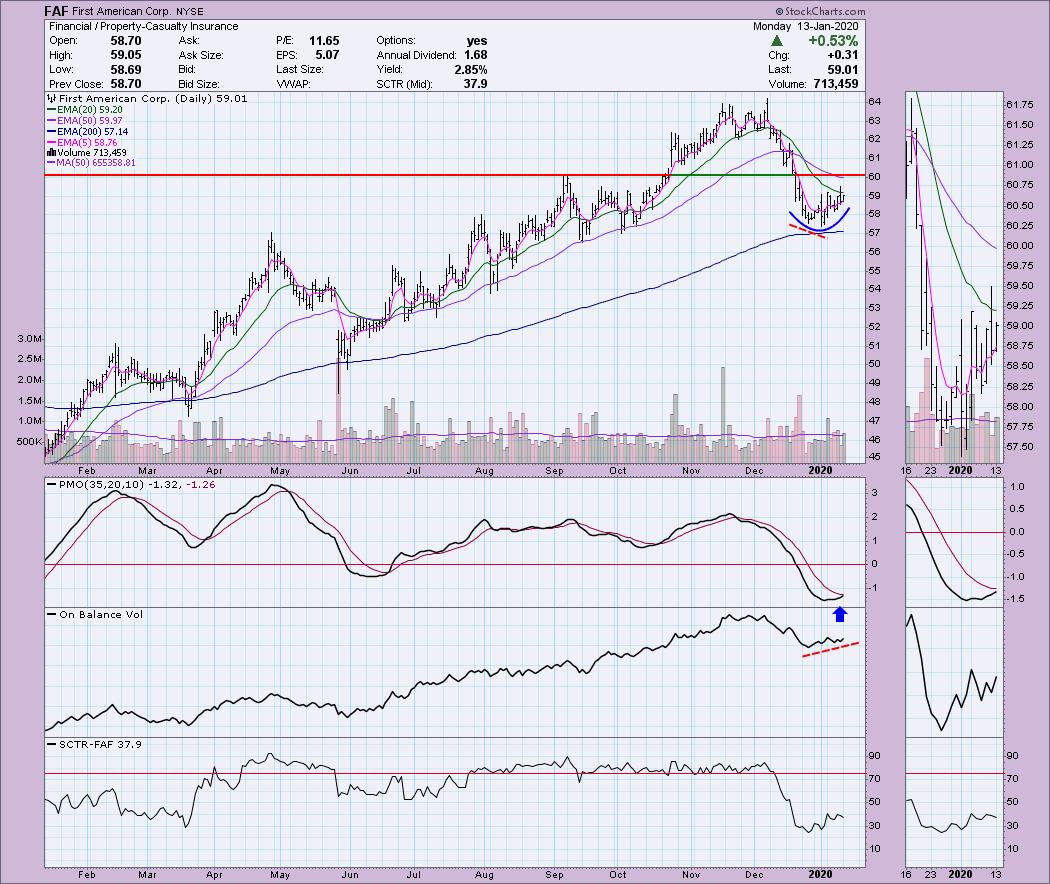
First American Corp (FAF) - Earnings: 2/13/2020
FAF has a rounded bottom and a PMO that is about ready to trigger a BUY signal. Price hasn't yet managed a move above the 20-EMA so that could form short-term resistance. The OBV shows rising bottoms while price bottoms had been moving lower. That's a positive divergence and many times heralds in rallies.
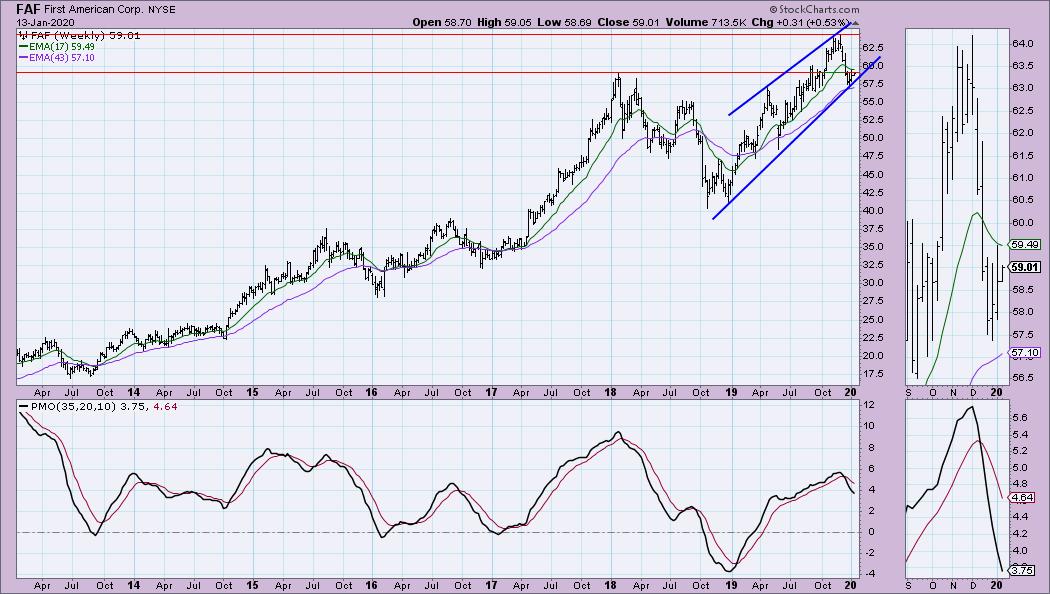
The weekly chart looks like most beaten down stocks. A declining PMO on a SELL signal and previous support broken. Unfortunately this one has a steep rising wedge. In the short-term I'm looking for it to move toward a test at the top of the wedge before it breaks down. However, if this rising trend doesn't hold on the weekly chart, I might consider a different diamond in the rough.
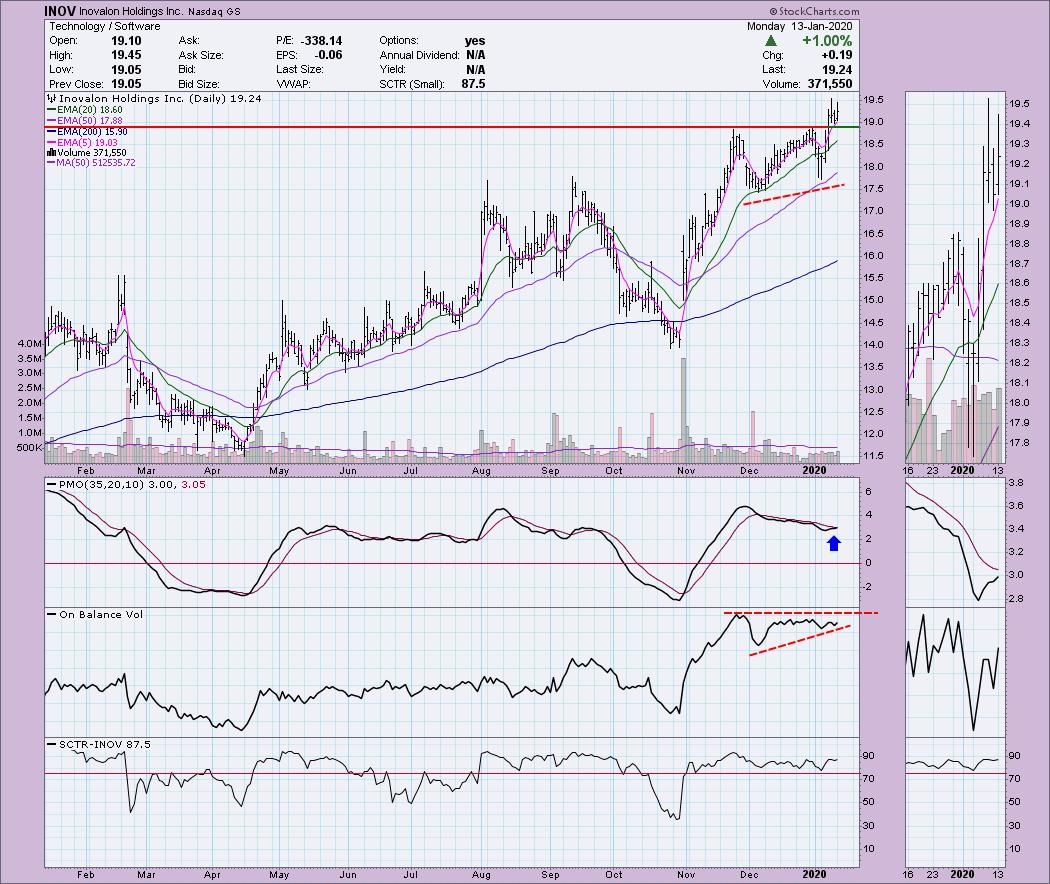
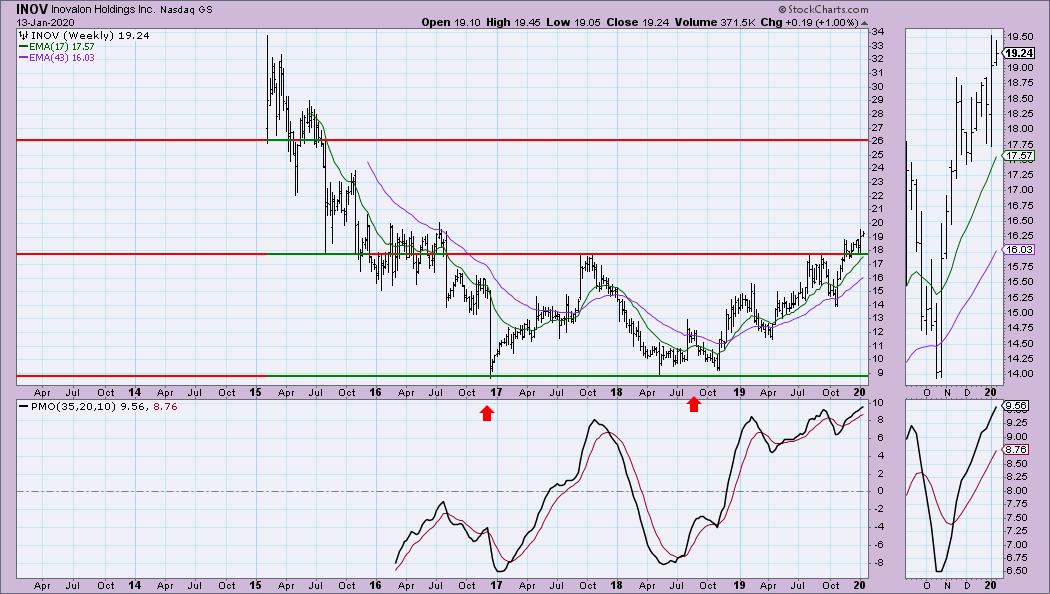
Inovalon Holdings Inc (INOV) - Earnings: 2/18 - 2/24/2020
Software is on a major run to the upside. I suggest you take a look at the industry group chart and you'll see the parabolic formation ready to break down. I'm keeping that as a backdrop when I invest in this area. Price broke out and is holding support at $19. The PMO appears ready to generate a BUY signal. The OBV is a mixed bag. There is a confirmation as both OBV and price bottoms are rising. I'm not happy about the reverse divergence that is currently in play. The OBV should break to new highs when price does and that hasn't occurred. I didn't annotate it, but there is a bullish ascending triangle formation (rising bottoms and horizontal resistance) that activated when price broke out.
The weekly chart is positive. For a longer-term investment, you can see a double-bottom pattern that has executed. The expectation of these patterns is a move to the upside that is the height of the pattern.
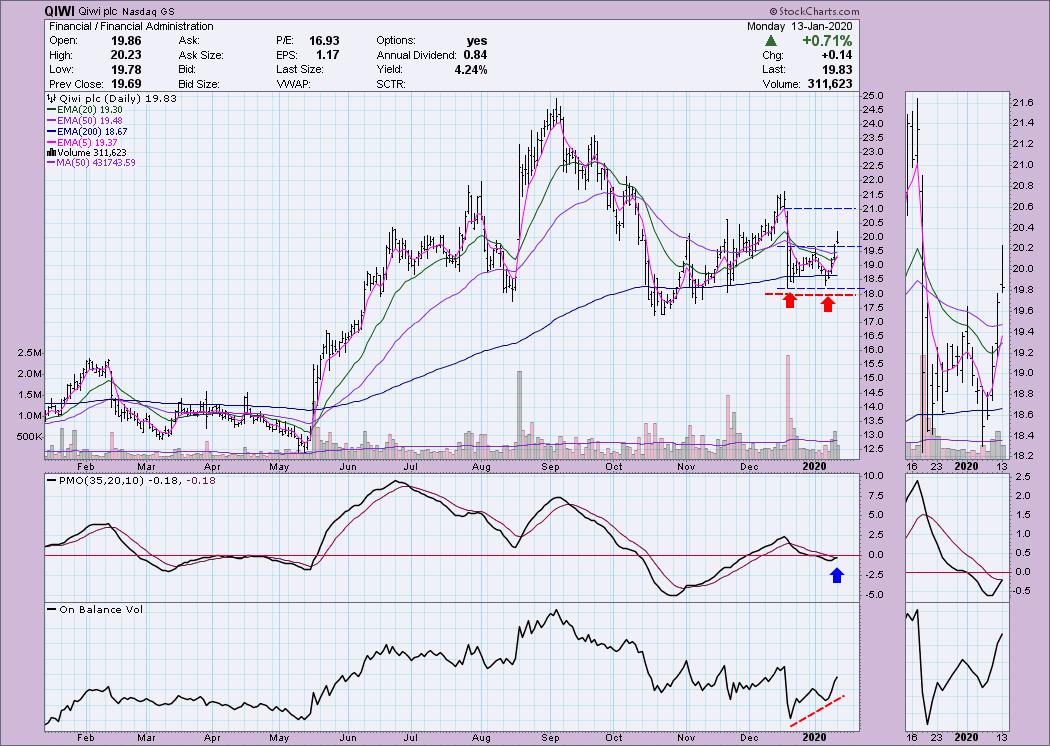
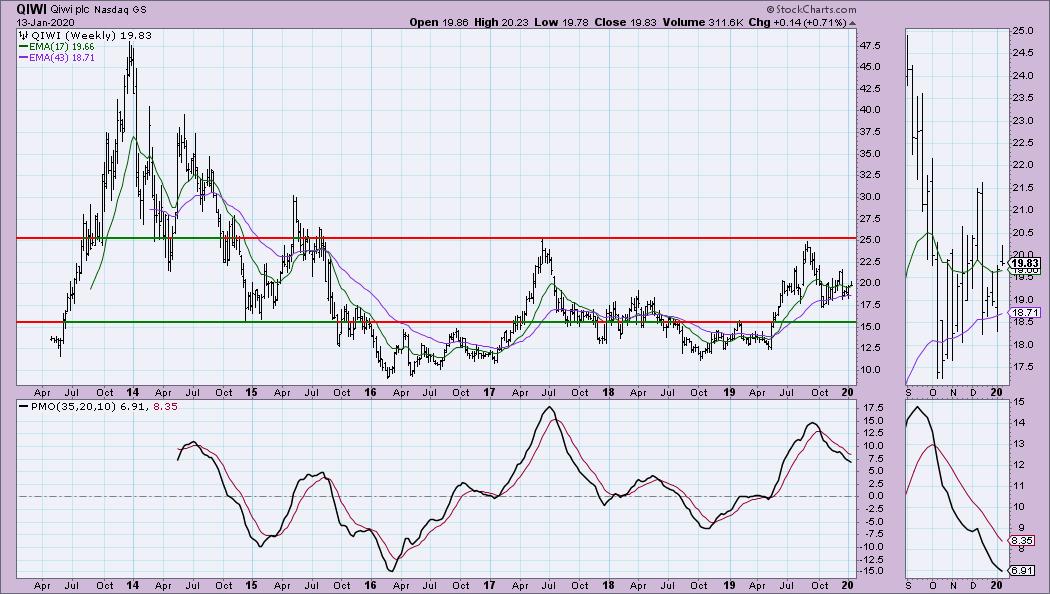
Qiwi plc (QIWI) - Earnings: 3/26 - 3/30/2020
A short-term double-bottom executed with today's breakout. The upside target based on the pattern is just below resistance at the December top. The PMO almost triggered a BUY signal today. The OBV has a positive divergence with price lows.
Not an impressive weekly chart. I see a double-bottom using the 2016 and 2018 lows, but you can see it failed at the confirmation line (2017 top) and moved back down. Price is now hanging on to support at the 43-week EMA. The PMO is in decline. Probably a better idea for a short-term investment.
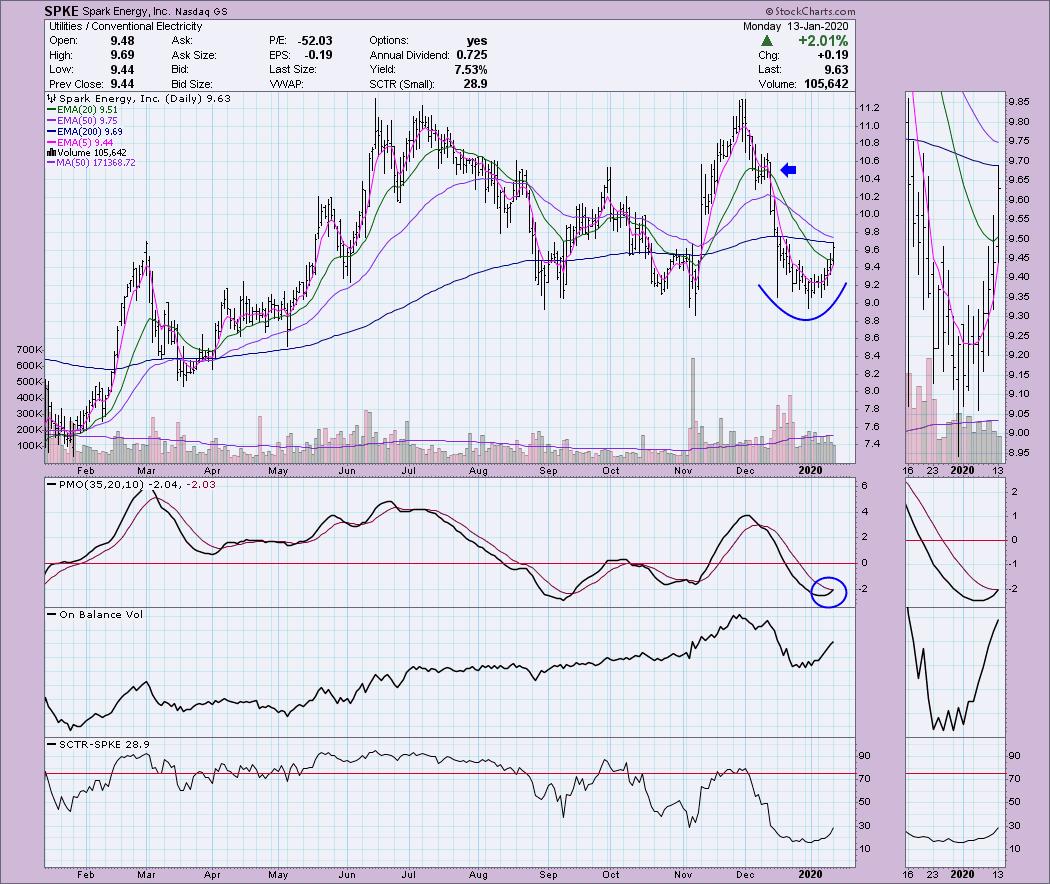
Spark Energy Inc (SPKE) - Earnings: 11/29/2019
Nice cup forming on SPKE and price closed above the 20-EMA for the first time since the initial decline began after price topped at the December high. The PMO is rising and should trigger a BUY signal tomorrow. The OBV is confirming the rally and the SCTR is beginning to perk up.
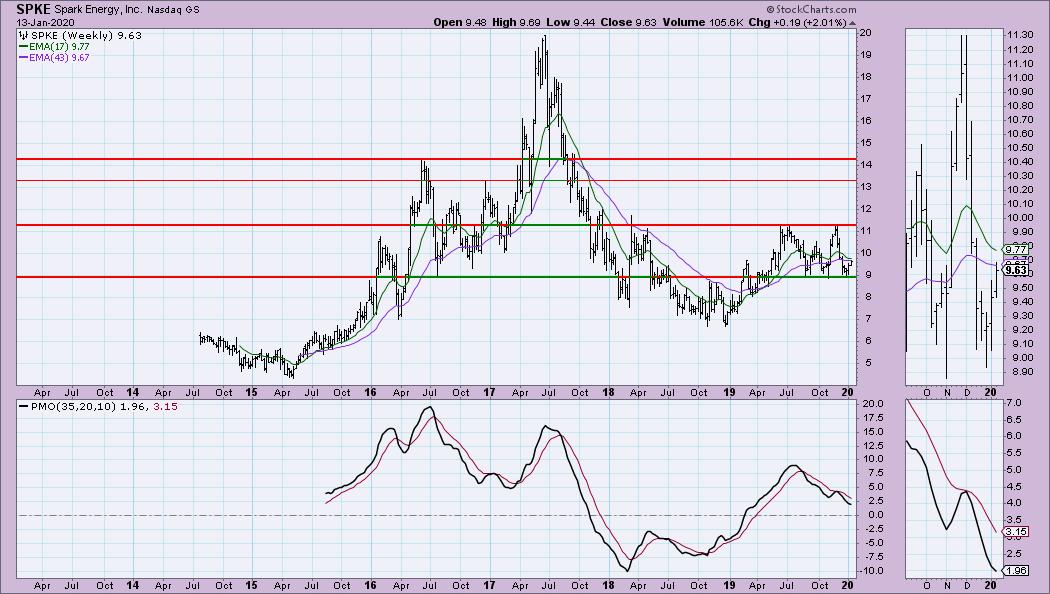
2019 price formed a trading range. Price is near the bottom. The weekly PMO is falling, but I see a bit of deceleration. I like this as a short or intermediate-term investment since price is near the bottom of the range on the weekly chart. A stop set just below $9 makes sense.
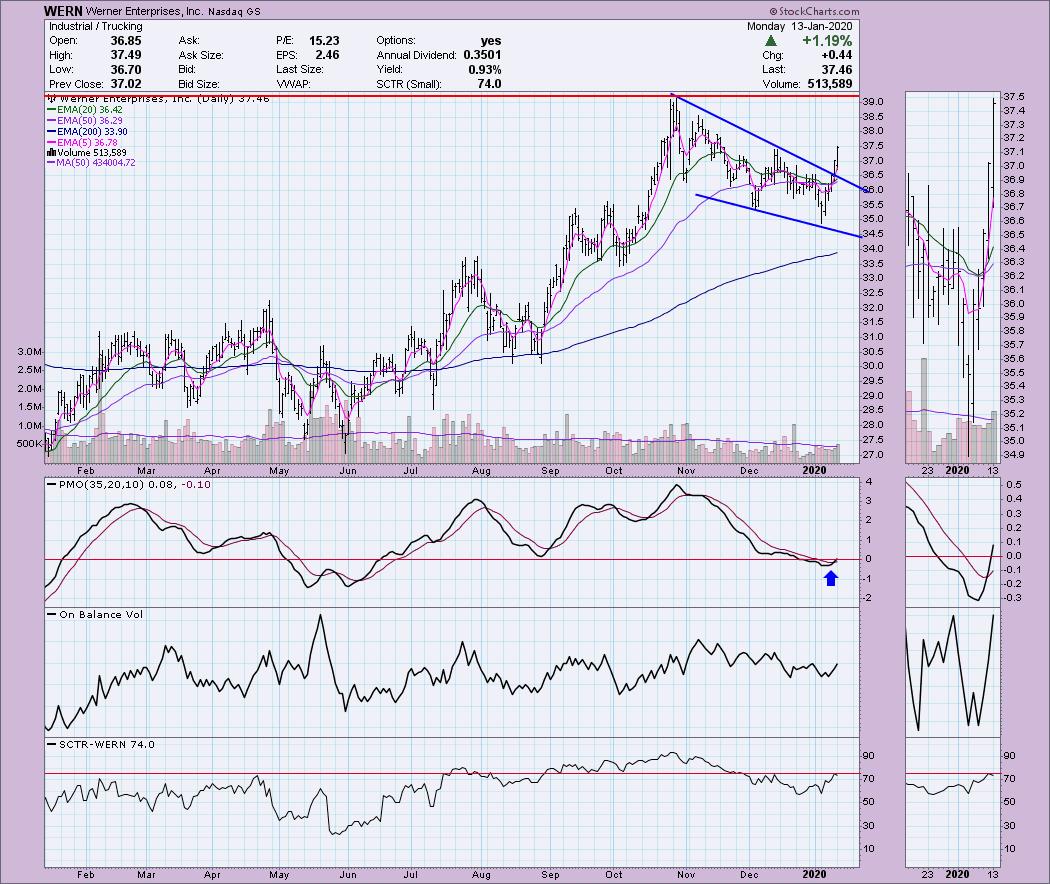
Werner Enterprises Inc (WERN) - Earnings: 2/5/2020
Really nice execution of the declining wedge pattern. The upside target is the October top. The PMO triggered a BUY signal today. The OBV shows rising bottoms and that gave us a positive divergence just prior to this current rally and breakout. The SCTR is just about inside the "hot zone" above 75.
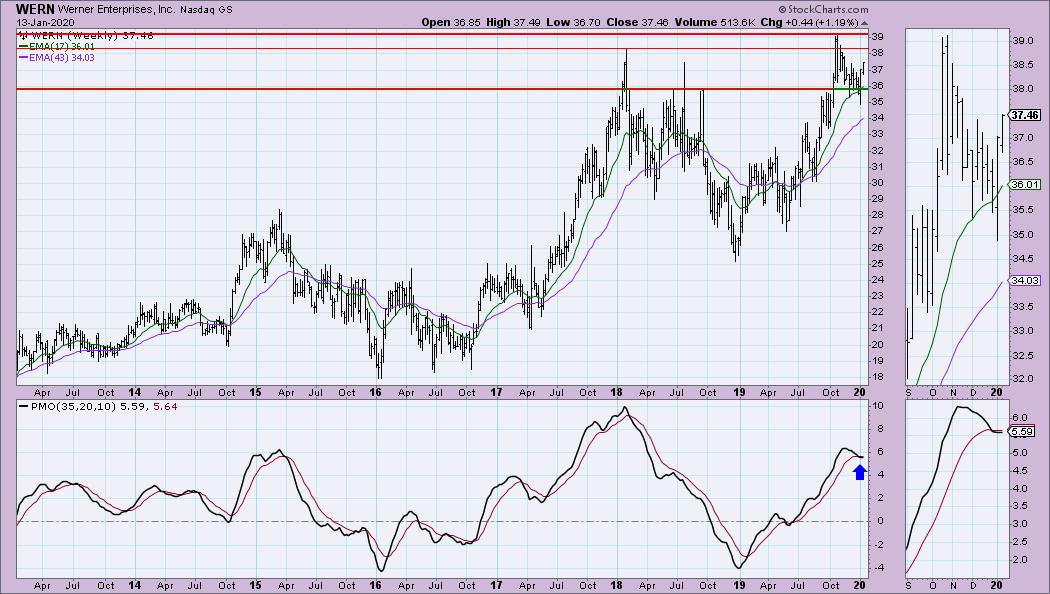
The PMO had just triggered a SELL signal but is already whipsawing back into a BUY signal. The PMO is somewhat overbought, but there is plenty of room for it to move higher with a rally. Overhead resistance is fairly close, but I'm expecting a breakout.
Current Market Outlook:
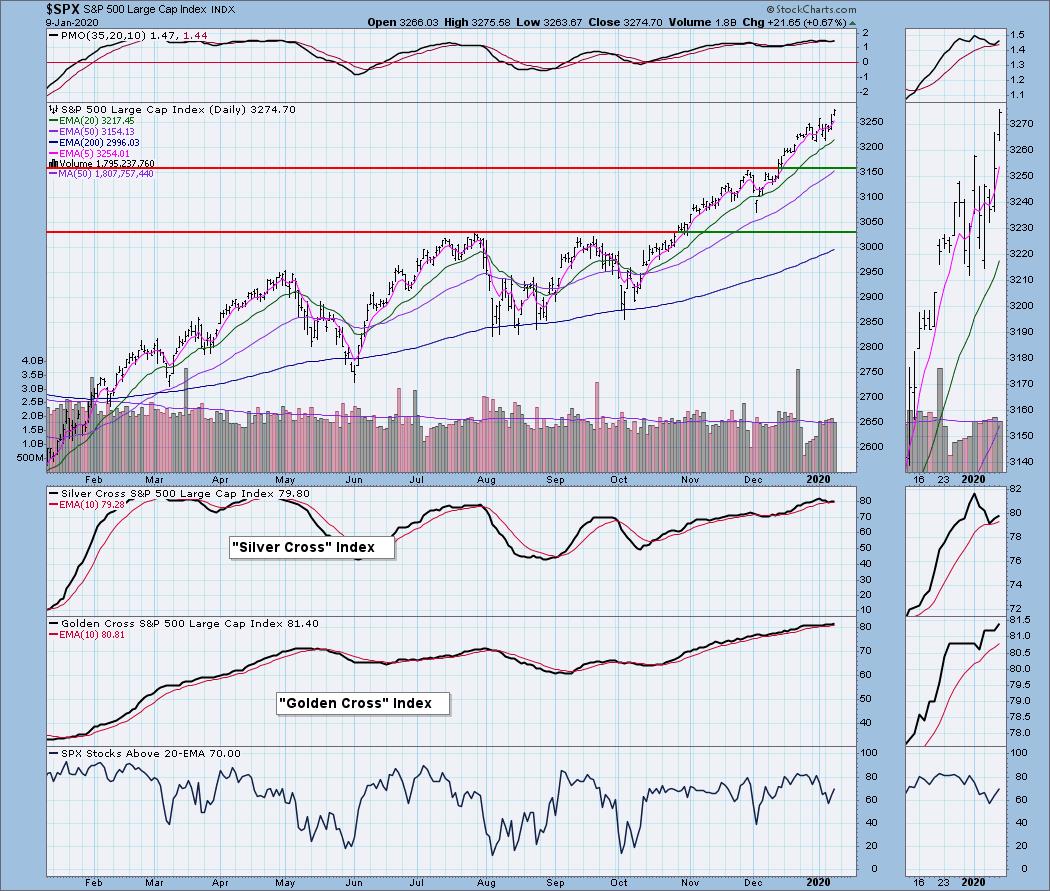
Market Environment: It is important to consider the odds for success. The Silver Cross Index measures the percentage of stocks on IT Trend Model BUY signals (20-EMA > 50-EMA), while the Golden Cross Index measures the percentage of stocks on LT Trend Model BUY signals (50-EMA > 200-EMA). Don't forget that as a "Diamonds" member, you have access to our GCI/SCI curated ChartList on DecisionPoint.com. You'll find it under "Members Only" links on the left side. Here are the current percentages on the Silver and Golden Cross Indexes:
Diamond Index:
- Diamond Scan Results: 12
- Diamond Dog Scan Results: 14
- Diamond Bull/Bear Ratio: .86
Full Disclosure: I will be selling PTCT tomorrow unless it is able to show me it will hold the rising trend and the PMO begins to turn back up. I do not own any of the stocks presented today. I'm currently 35% in cash.

Erin Swenlin will be presenting at the The MoneyShow Las Vegas on May 11-13, 2020! You'll have an opportunity to meet Erin and discuss the latest DecisionPoint news and Diamond Scans. The conference is free to attend or view online!
Watch the latest episode of DecisionPoint with Carl & Erin Swenlin LIVE on Mondays 5:00p EST or on the StockCharts TV YouTube channel here!
Technical Analysis is a windsock, not a crystal ball.
Happy Charting!
- Erin
erinh@stockcharts.com
NOTE: The stocks reported herein are from mechanical trading model scans that are based upon moving average relationships, momentum and volume. DecisionPoint analysis is then applied to get five selections from the scans. The selections given should prompt readers to do a chart review using their own analysis process. This letter is not a call for a specific action to buy, sell or short any of the stocks provided. There are NO sure things or guaranteed returns on the daily selection of "diamonds in the rough."
Helpful DecisionPoint Links:
DecisionPoint Shared ChartList and DecisionPoint Chart Gallery
Price Momentum Oscillator (PMO)
Swenlin Trading Oscillators (STO-B and STO-V)
**Don't miss DecisionPoint Commentary! Add your email below to be notified of new updates"**f