
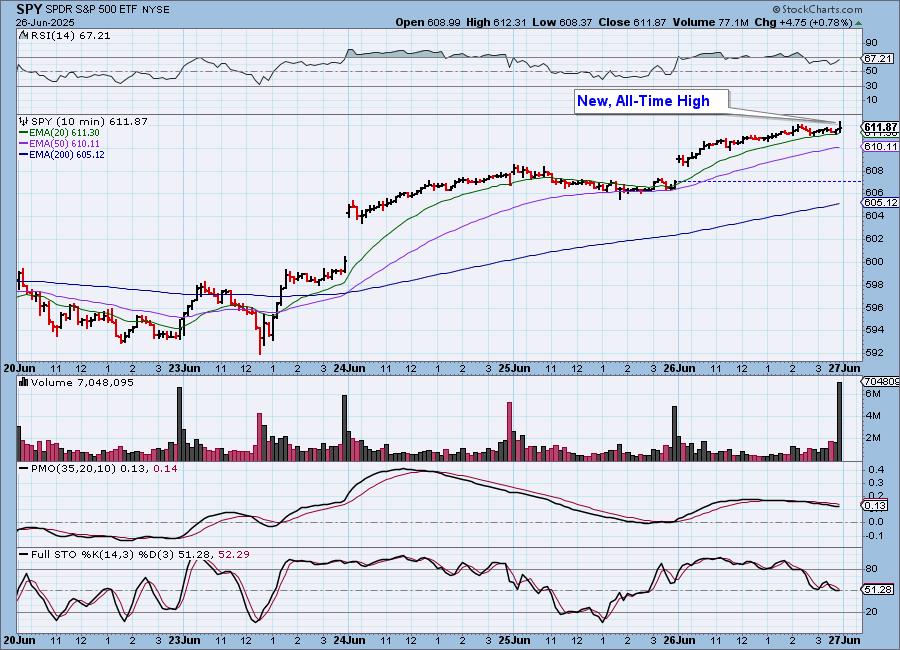
The SPY made new, all-time highs today, but the S&P 500 did not. Since the S&P 500 is not adjusted for distributions, we will believe SPY, which is adjusted. The market looked toppy yesterday, but today it managed another rally with price rising throughout the day after the initial gap up. The 10-minute PMO has sunk and is technically on a Crossover SELL Signal. Stochastics don't look very healthy, but they stayed in positive territory. Indicators suggest we could see some decline.
The DecisionPoint Alert Weekly Wrap presents an end-of-week assessment of the trend and condition of the Stock Market, the U.S. Dollar, Gold, Crude Oil, and Bonds. The DecisionPoint Alert daily report (Monday through Thursday) is abbreviated and gives updates on the Weekly Wrap assessments.
MARKET/INDUSTRY GROUP/SECTOR INDEXES
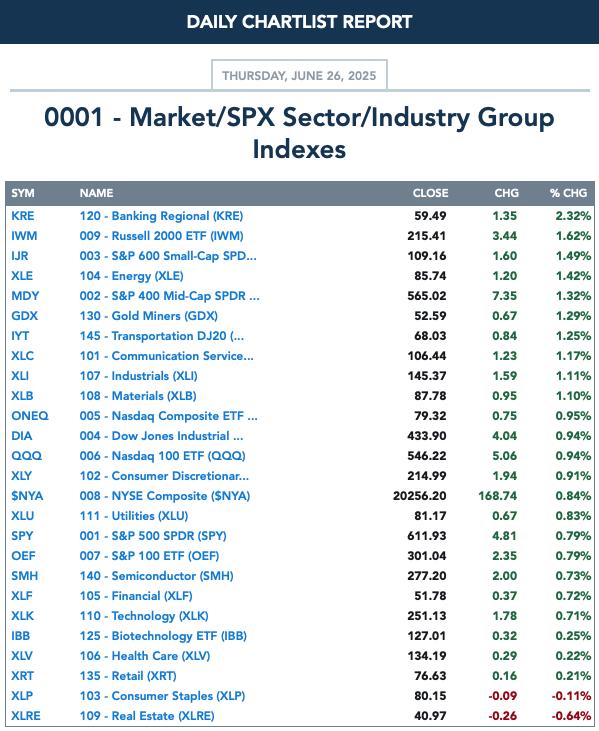
CLICK HERE for Carl's annotated Market Index, Sector, and Industry Group charts.
THE MARKET (S&P 500)
IT Trend Model: NEUTRAL as of 3/4/2025
LT Trend Model: SELL as of 4/16/2025
SPY 10-minute Chart:
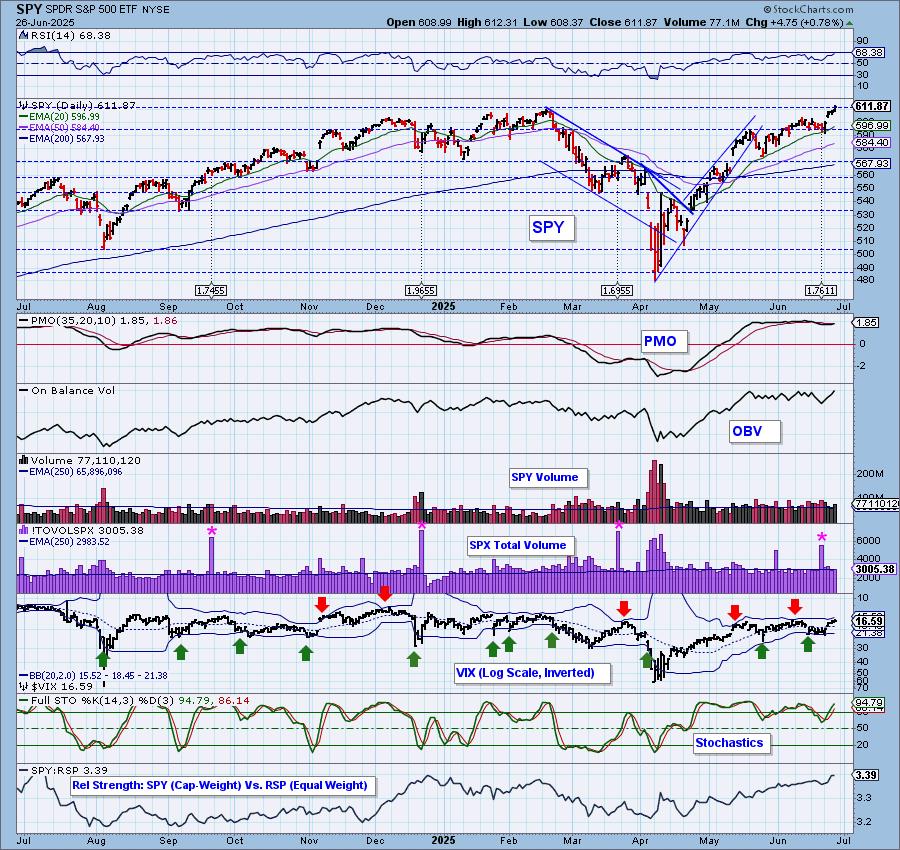
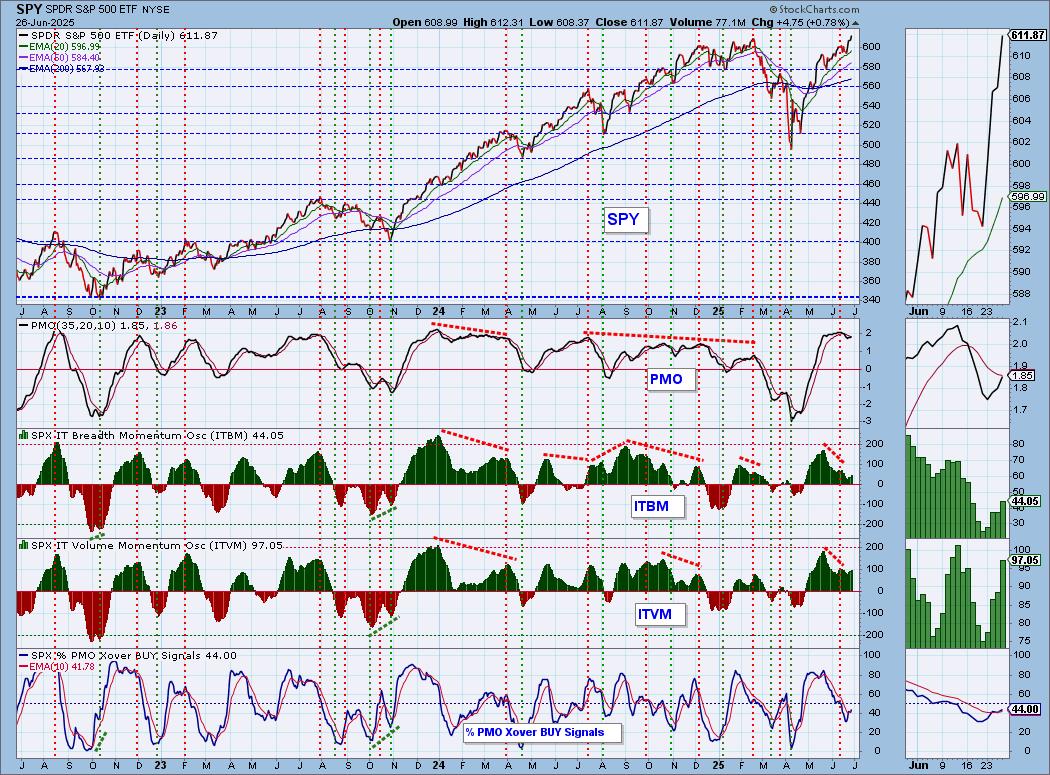
SPY Daily Chart: Price was consolidating and looked ready to turn over, but instead we have seen a nice rally to all-time highs. The PMO is still technically on a Crossover SELL Signal, but ultimately it is flat above the zero line and that still implies pure strength.
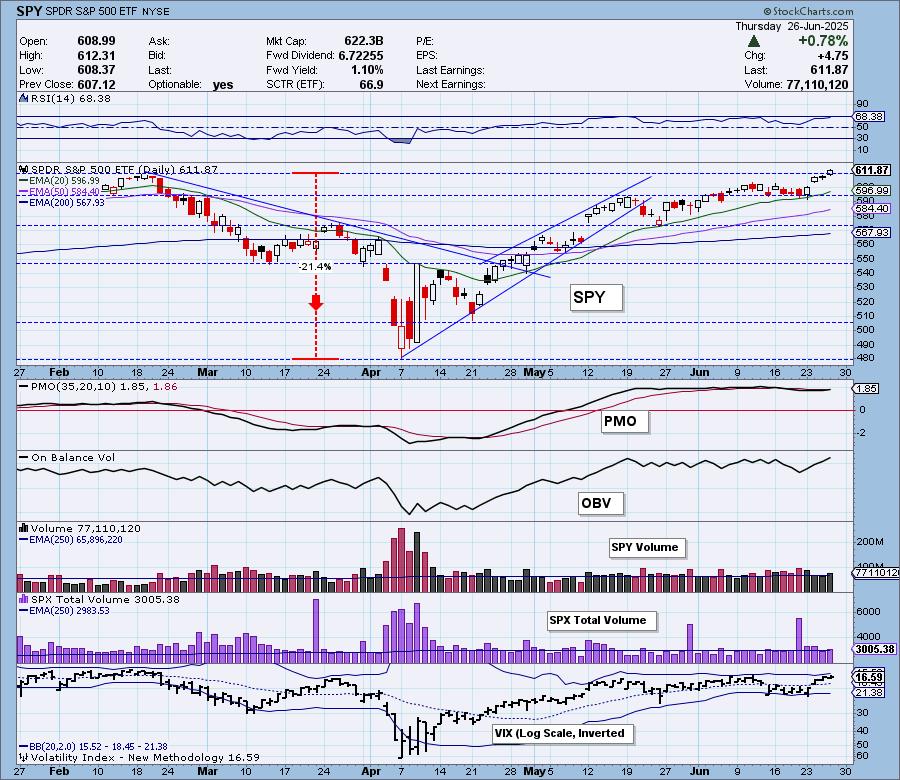
The VIX did not puncture the upper Bollinger Band on the inverted scale, but it is getting close. Those punctures generally lead to downside. Stochastics look very healthy holding above 80 and rising. Clearly the mega-caps have led the charge out of the April low given the rising relative strength line to equal-weight RSP.
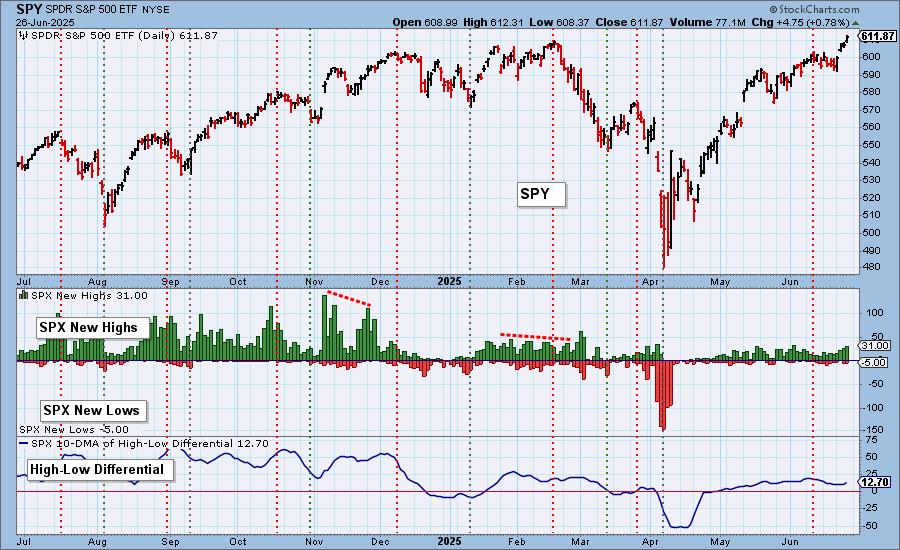
S&P 500 New 52-Week Highs/Lows: New Highs continue to expand, but we still see a few New Lows. Good news is that the High-Low Differential has turned back up.
Climax* Analysis: There were three climax readings on the four relevant indicators today, so we have another upside exhaustion climax. Total Volume was on average so there wasn't strong conviction behind today's rally.
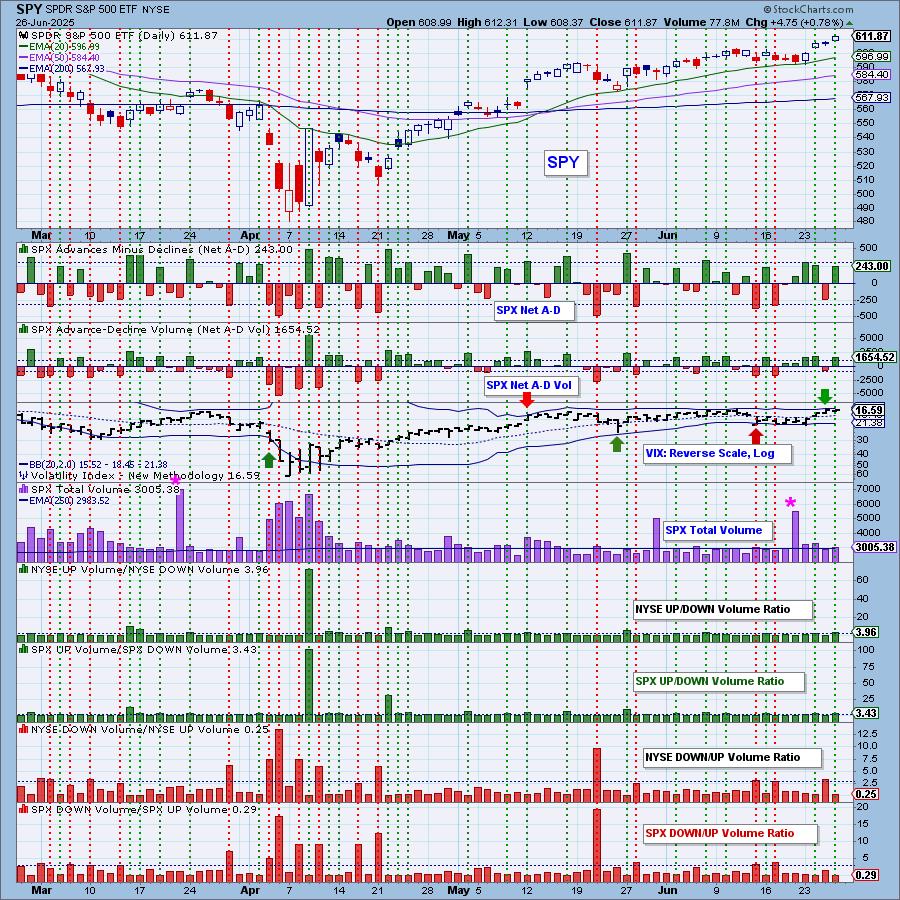
*A climax is a one-day event when market action generates very high readings in, primarily, breadth and volume indicators. We also include the VIX, watching for it to penetrate outside the Bollinger Band envelope. The vertical dotted lines mark climax days -- red for downside climaxes, and green for upside. Climaxes are at their core exhaustion events; however, at price pivots they may be initiating a change of trend.
Short-Term Market Indicators: The short-term market trend is UP and the condition is OVERBOUGHT.
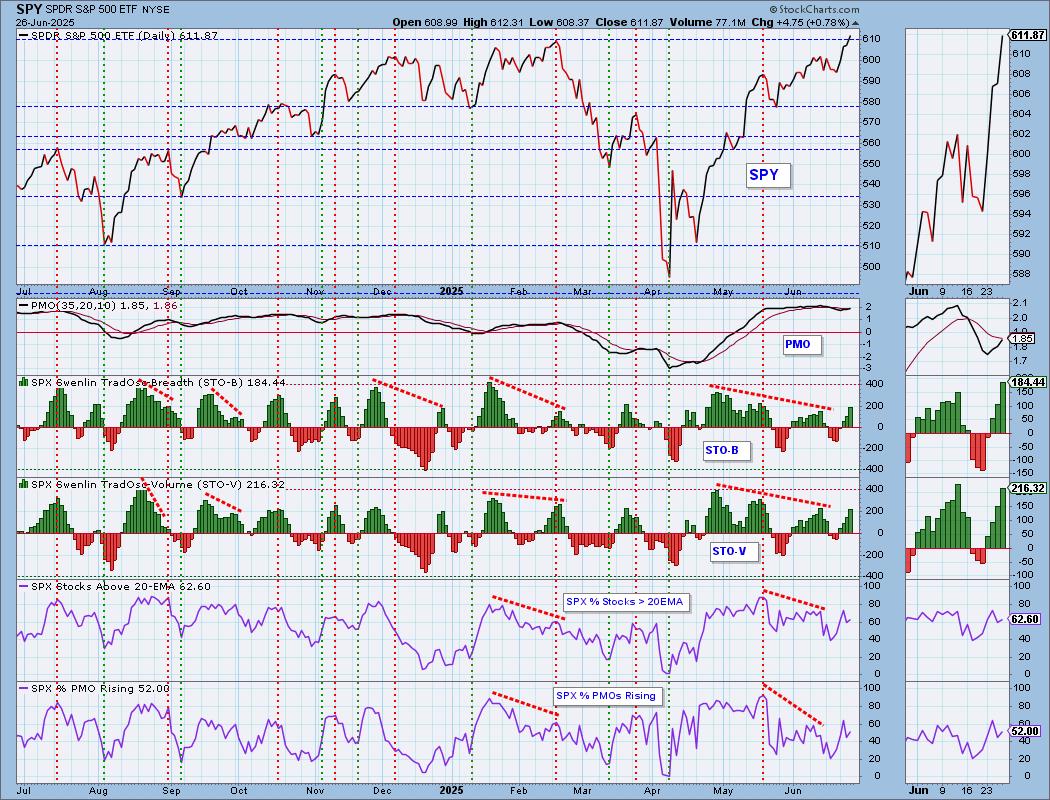
We are now listing the Swenlin Trading Oscillators (STOs) as overbought. They popped significantly higher today, but this has put them in overbought territory. We still think there are negative divergences on both. Participation was slightly higher and we did see more rising PMOs. %PMOs Rising is back above our bullish 50% threshold.
Intermediate-Term Market Indicators: The intermediate-term market trend is UP and the condition is NEUTRAL.
Both the ITBM and ITVM were higher on the day. The ITBM had held steady yesterday so it was good to see it rising again. We saw slightly more PMO BUY Signals, but the indicators is still reading below our bullish 50% threshold despite the market being at all-time highs.
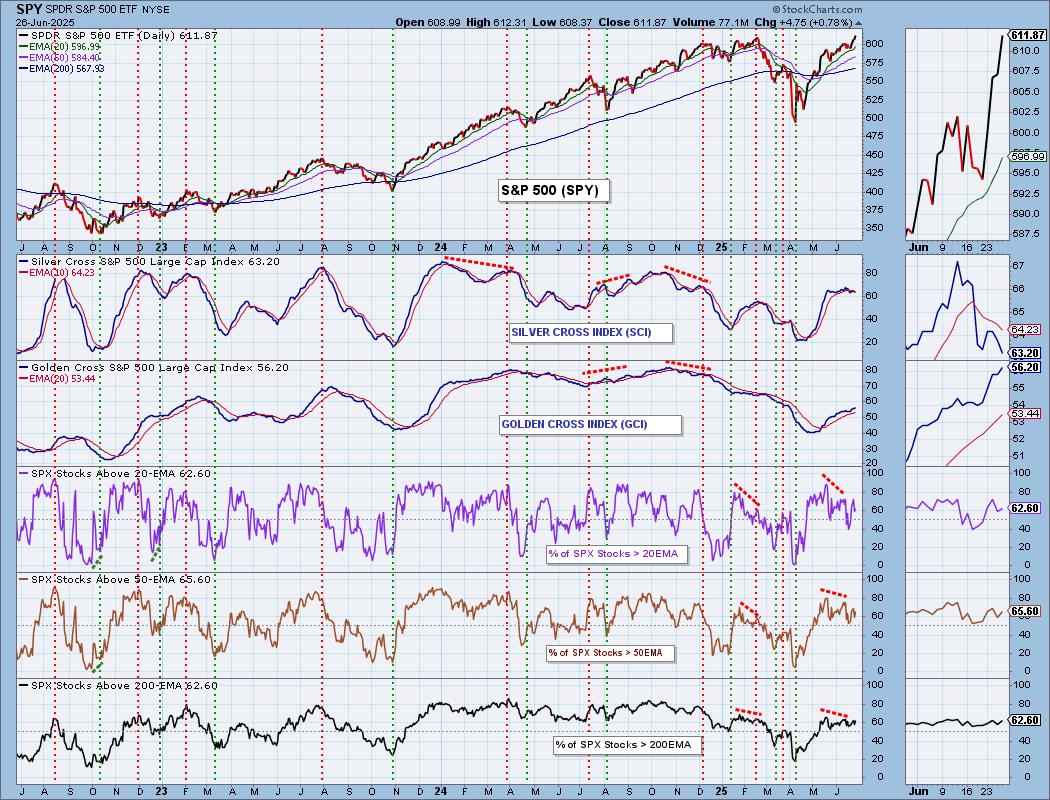
PARTICIPATION CHART (S&P 500): The following chart objectively shows the depth and trend of participation for the SPX in two time frames.
- Intermediate-Term - the Silver Cross Index (SCI) shows the percentage of SPX stocks on IT Trend Model BUY signals (20-EMA > 50-EMA). The opposite of the Silver Cross is a "Dark Cross" -- those stocks are, at the very least, in a correction.
- Long-Term - the Golden Cross Index (GCI) shows the percentage of SPX stocks on LT Trend Model BUY signals (50-EMA > 200-EMA). The opposite of a Golden Cross is the "Death Cross" -- those stocks are in a bear market.
The market bias is BEARISH in the intermediate term.
The market bias is BULLISH in the long term.
Participation indicators still sport negative divergences. We are at all-time highs, but much of the market isn't participating. The Silver Cross Index still looks bearish on its decline after topping below the signal line. It is below the signal line so the IT Bias is BEARISH. The Golden Cross Index is back to rising and could continue to given we have more stocks above their 50/200-day EMAs versus Golden Crosses. It is still reading very low considering we have hit all-time highs. The Golden Cross Index is above its signal line so the LT Bias is BULLISH.
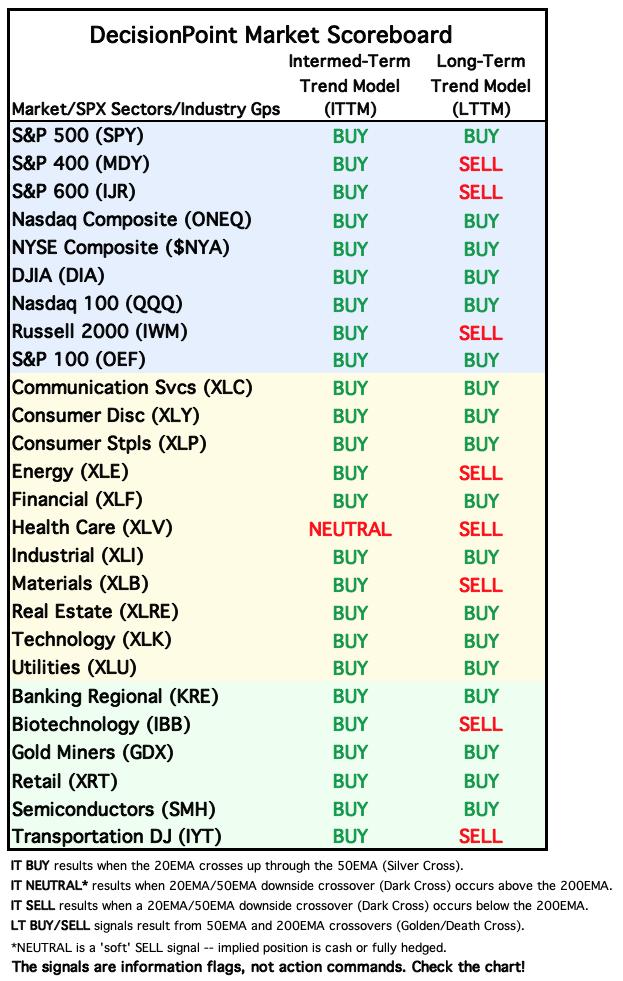
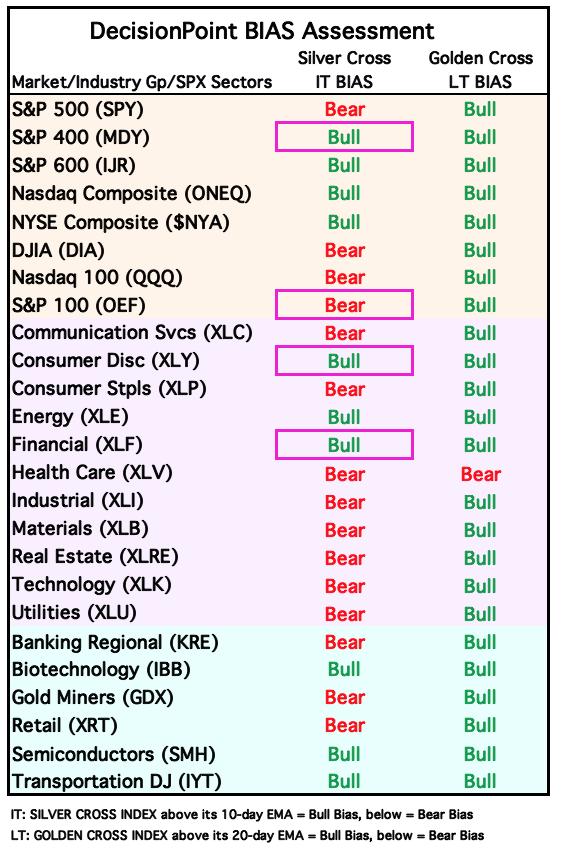
BIAS Assessment: The following table expresses the current BIAS of various price indexes based upon the relationship of the Silver Cross Index to its 10-day EMA (intermediate-term), and of the Golden Cross Index to its 20-day EMA (long-term). When the Index is above the EMA it is bullish, and it is bearish when the Index is below the EMA. The BIAS does not imply that any particular action should be taken. It is information to be used in the decision process.
The items with highlighted borders indicate that the BIAS changed today.
*****************************************************************************************************
CONCLUSION: The SPY hit all-time highs today, but it puts in stark contrast participation readings. Participation is reading below 66%. We should have better participation at this point. This sets up negative divergences. There was an upside exhaustion climax today that does warn of lower prices. We also have negative divergences on our STOs and ITBM/ITVM. Price doesn't seem interested in dropping, but we've noticed that once all-time highs are hit, we usually see a decline out of them. At this point we can set our stops and let the market take us out. If it is going to continue to inch higher, you're covered. Primary indicators are rising after all.
Erin is 50% long, 0% short. (This is intended as information, not a recommendation.)
*****************************************************************************************************
CALENDAR

BITCOIN
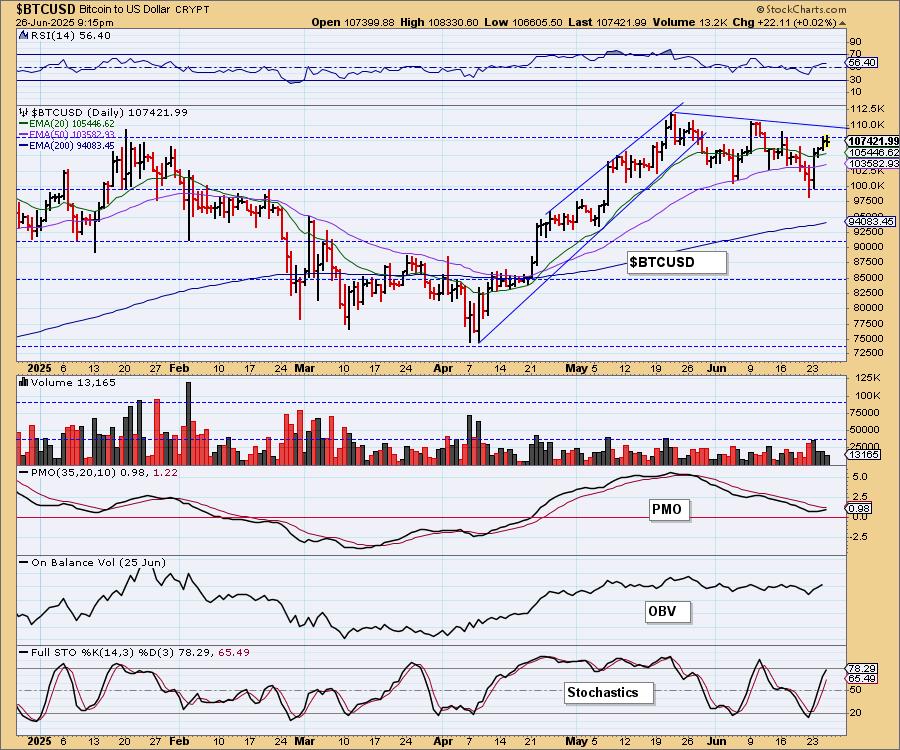
Bitcoin is working its way back up to the declining tops trendline. We expect it to break out there given the rising PMO and Stochastics. This has set up another bull flag formation that does tell us to expect a breakout.
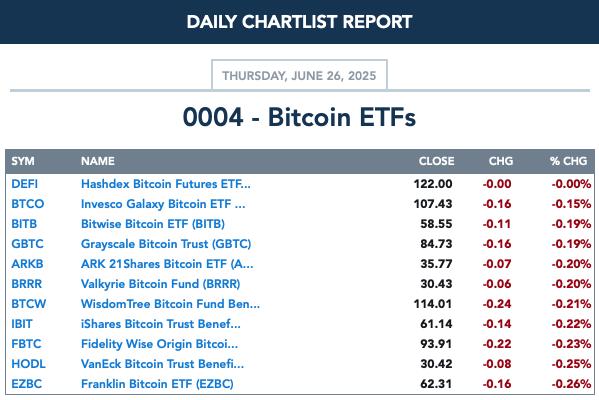
BITCOIN ETFs
INTEREST RATES
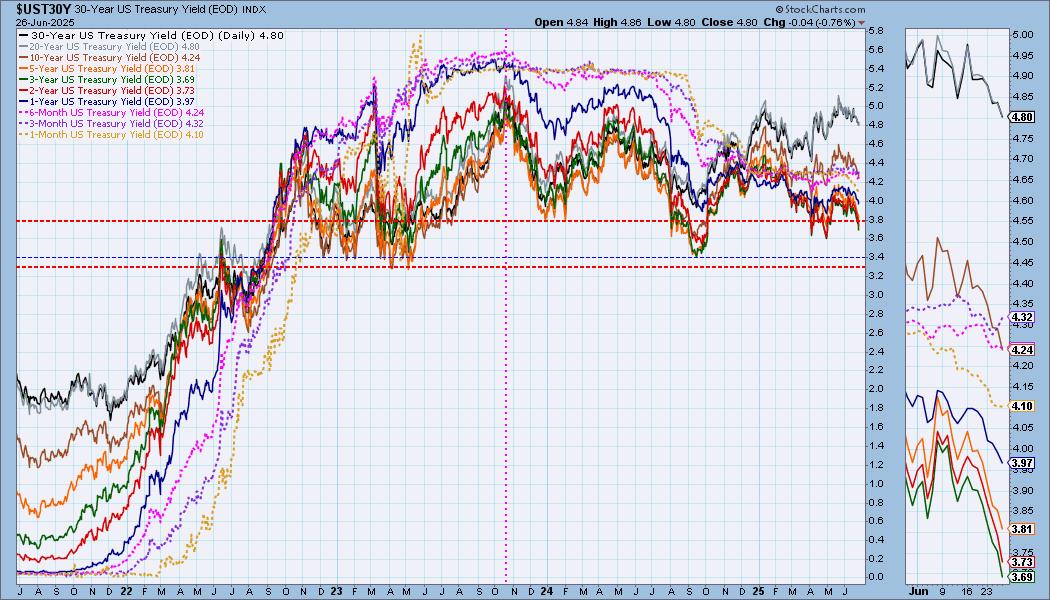
Yields tumbled lower today. They are overdue for a reversal, but these declining trends are holding strong. We're on the lookout for an upside reversal, but for now they look quite bearish.
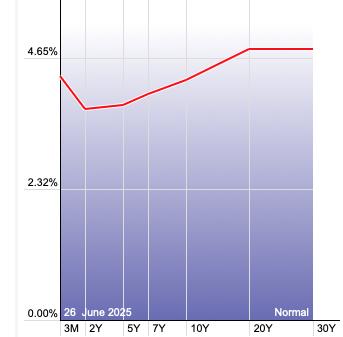
The Yield Curve Chart from StockCharts.com shows us the inversions taking place. The red line should move higher from left to right. Inversions are occurring where it moves downward.
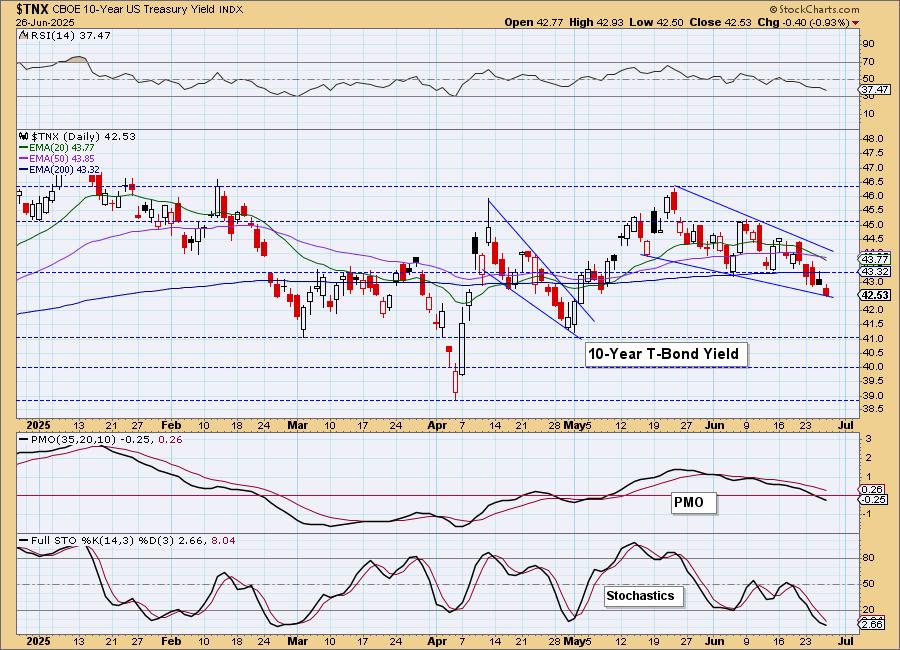
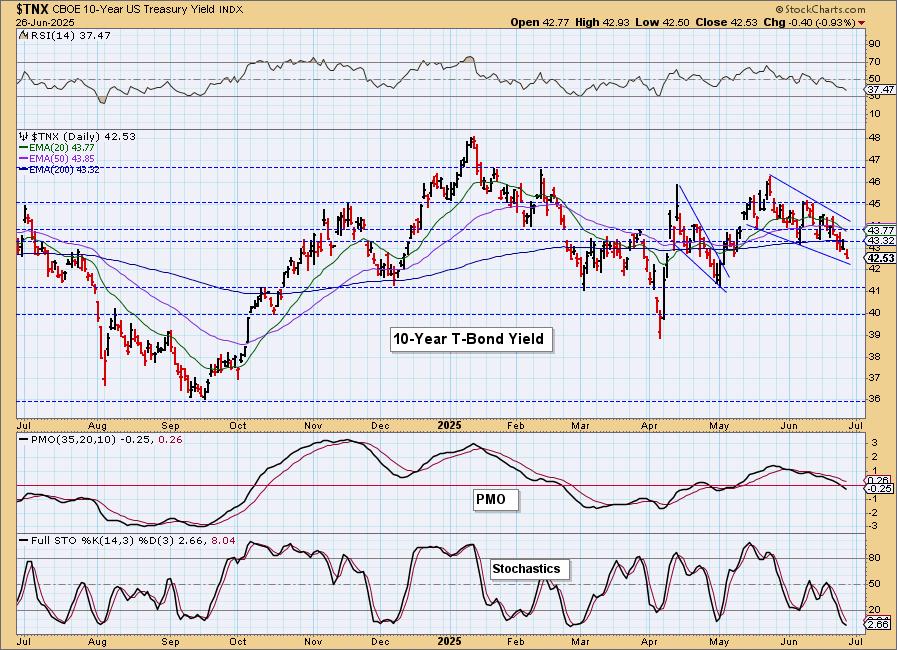
10-YEAR T-BOND YIELD
$TNX has just touched the bottom of the bullish falling wedge. It is time for it to rebound, otherwise a drop out of the pattern would be especially bearish. The PMO has fallen below the zero line and Stochastics are holding below 20 so we wouldn't be surprised if it moves lower from here.
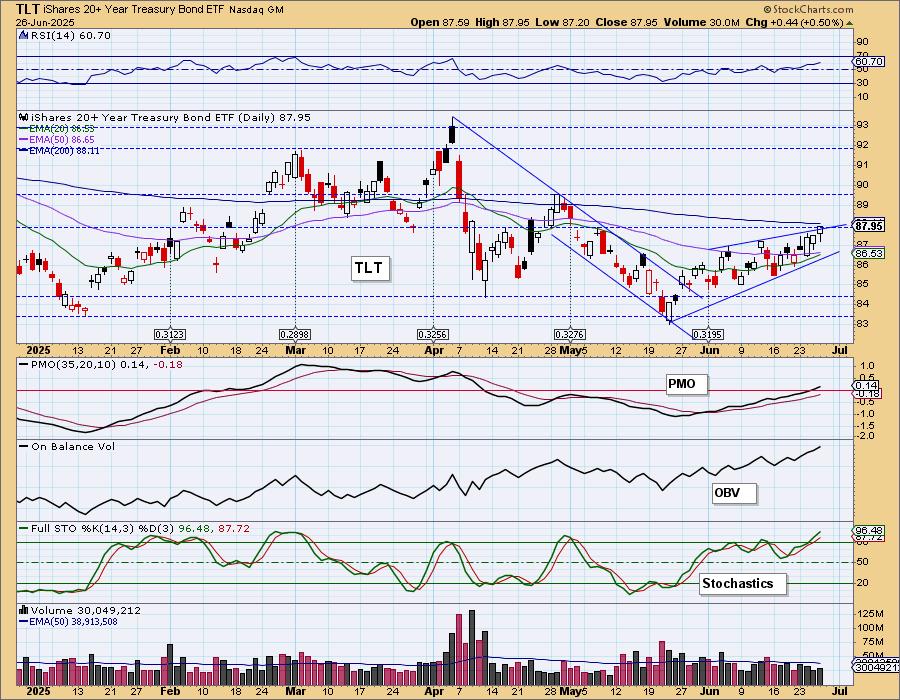
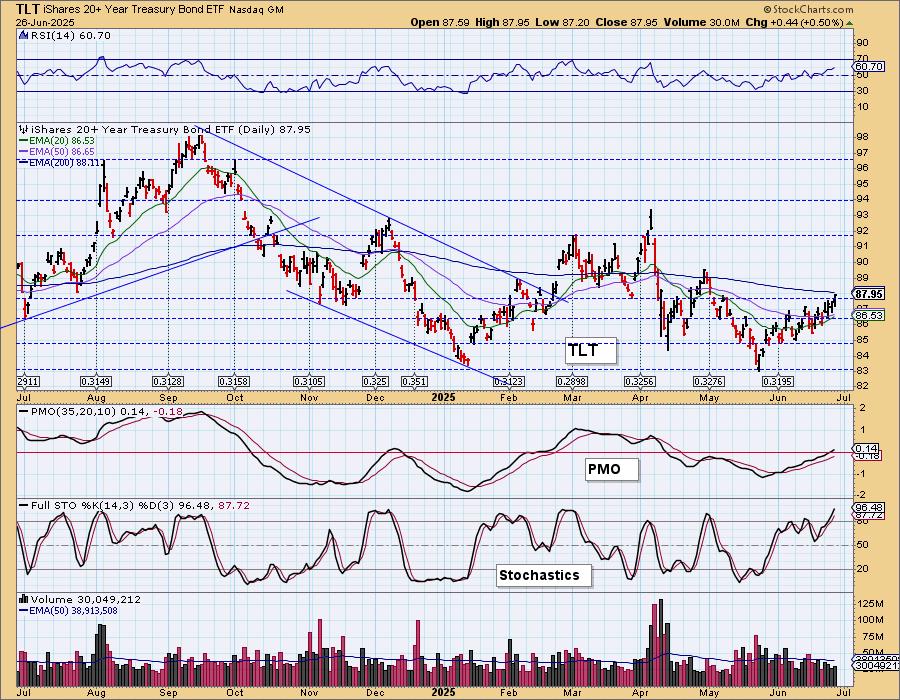
BONDS (TLT)
IT Trend Model: SELL as of 4/14/2025
LT Trend Model: SELL as of 12/13/2024
TLT Daily Chart: TLT broke out above the bearish rising wedge which is especially bullish. We do note that the 200-day EMA is upon us and could prove to be sturdy overhead resistance. However, the PMO has just moved above the zero line signaling strength and Stochastics are rising above 80 which implies internal strength. We would look for more upside.
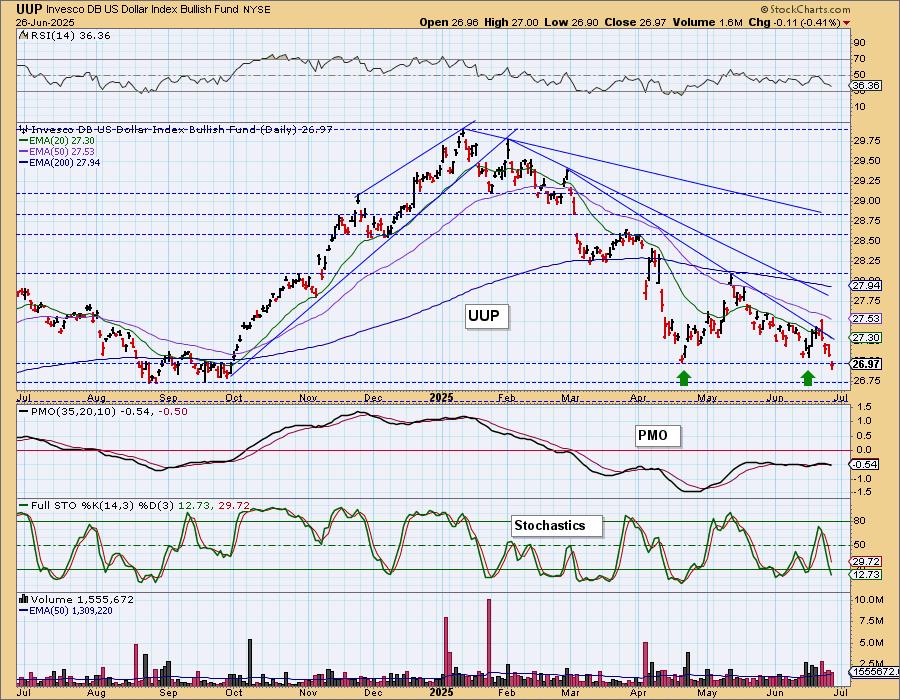
DOLLAR (UUP)
IT Trend Model: NEUTRAL as of 3/5/2025
LT Trend Model: SELL as of 4/25/2025
UUP Daily Chart: The Dollar broke down below support today. It looked good last week, but it has fallen apart this week leaving quite bearish. The PMO is on a Crossover SELL Signal and Stochastics are below 20 implying weakness. We would look for it to move lower.
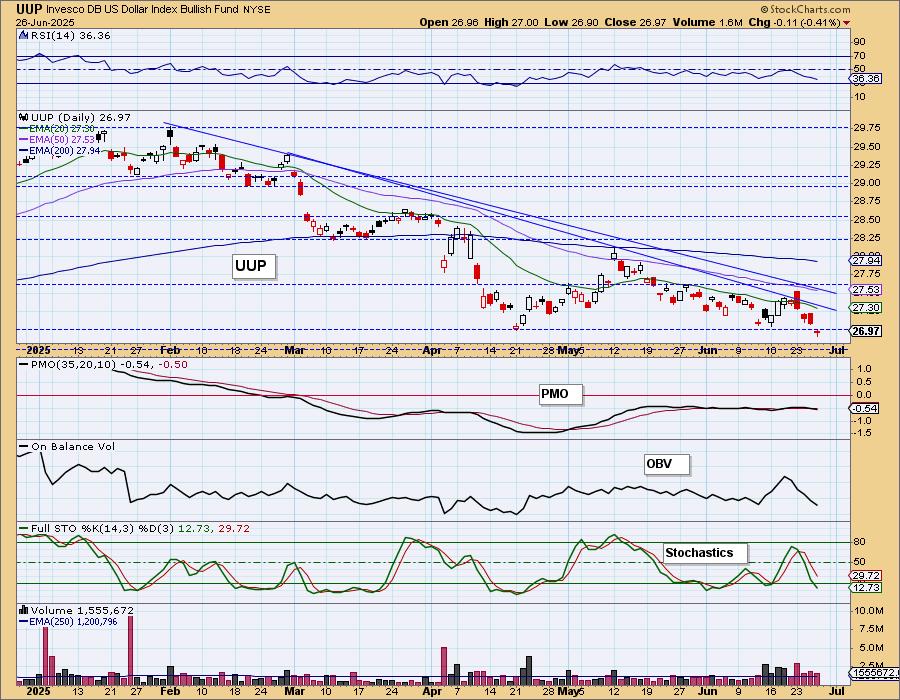
The bullish double bottom pattern has officially busted with the drop below the two bottoms. There is strong support arriving at 26.75, but given the indicators, we aren't so sure it will recover there.
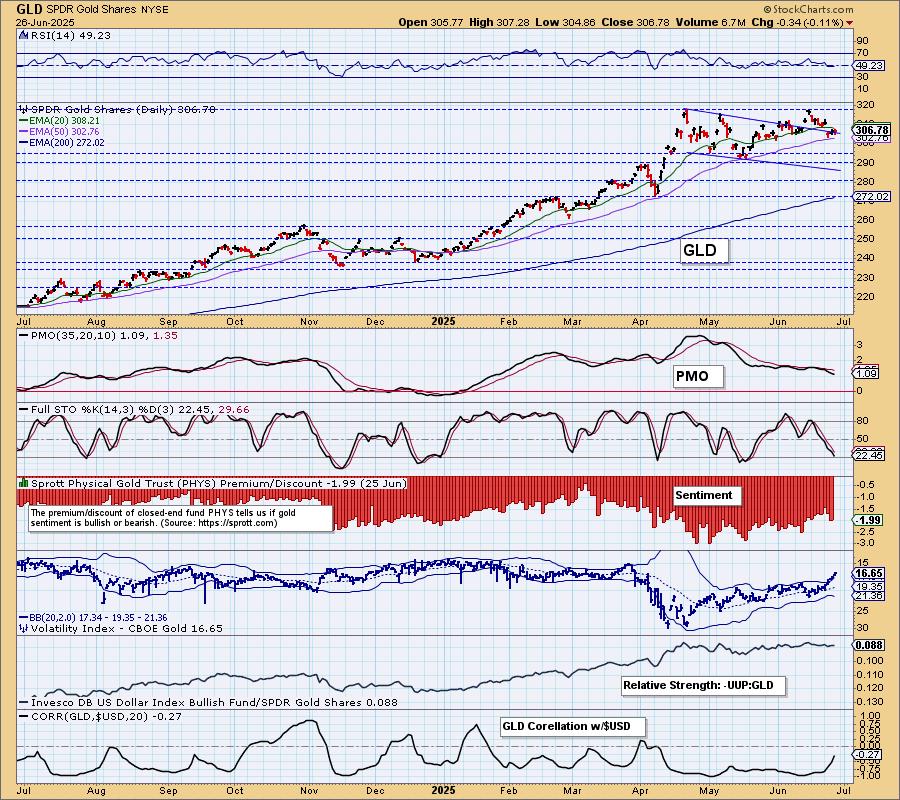
GOLD
IT Trend Model: BUY as of 1/10/2025
LT Trend Model: BUY as of 10/20/2023
GLD Daily Chart: Gold did not rally even though the Dollar fell. This tells us there were additional sellers. With the Dollar looking bearish again, we have to start thinking bullishly about Gold. It is holding above the 50-day EMA as support. The indicators are far from favorable though. We also see that $GVZ has punctured the upper Bollinger Band on the inverted scale and that too could imply more downside. We could see some consolidation as Gold decides how to handle the bearish Dollar.
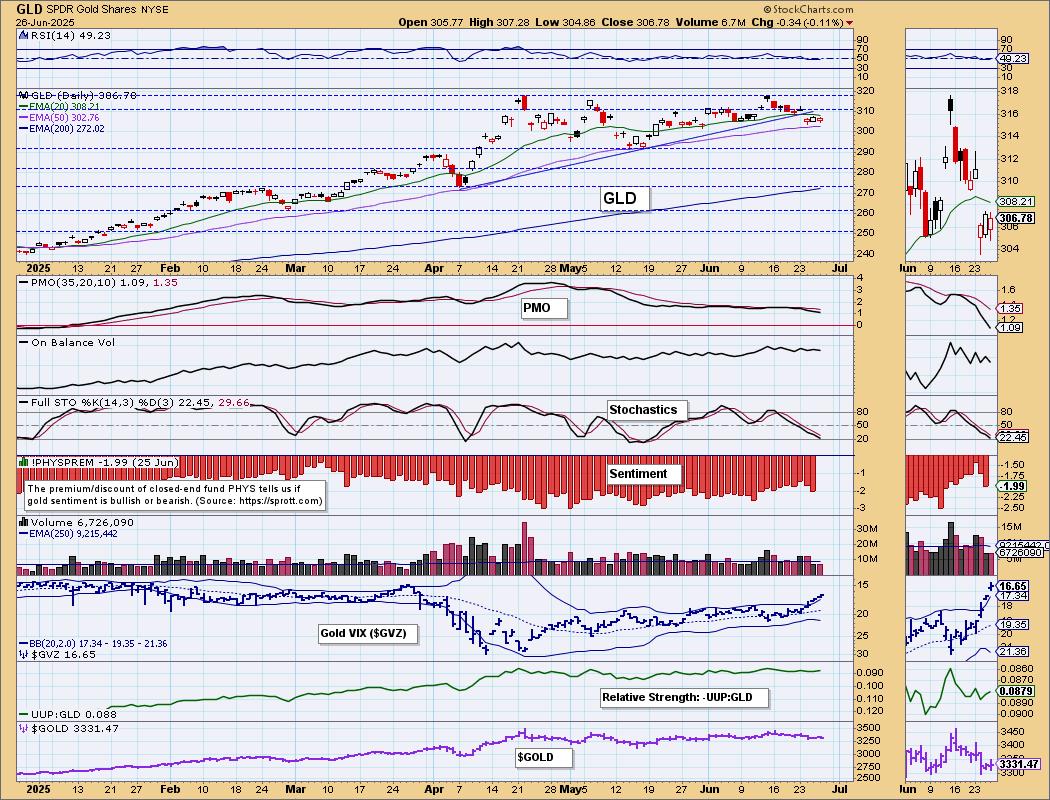
Price is dropping back into a declining trend channel which isn't good, but we'll be watching support at the 50-day EMA to give us guidance.
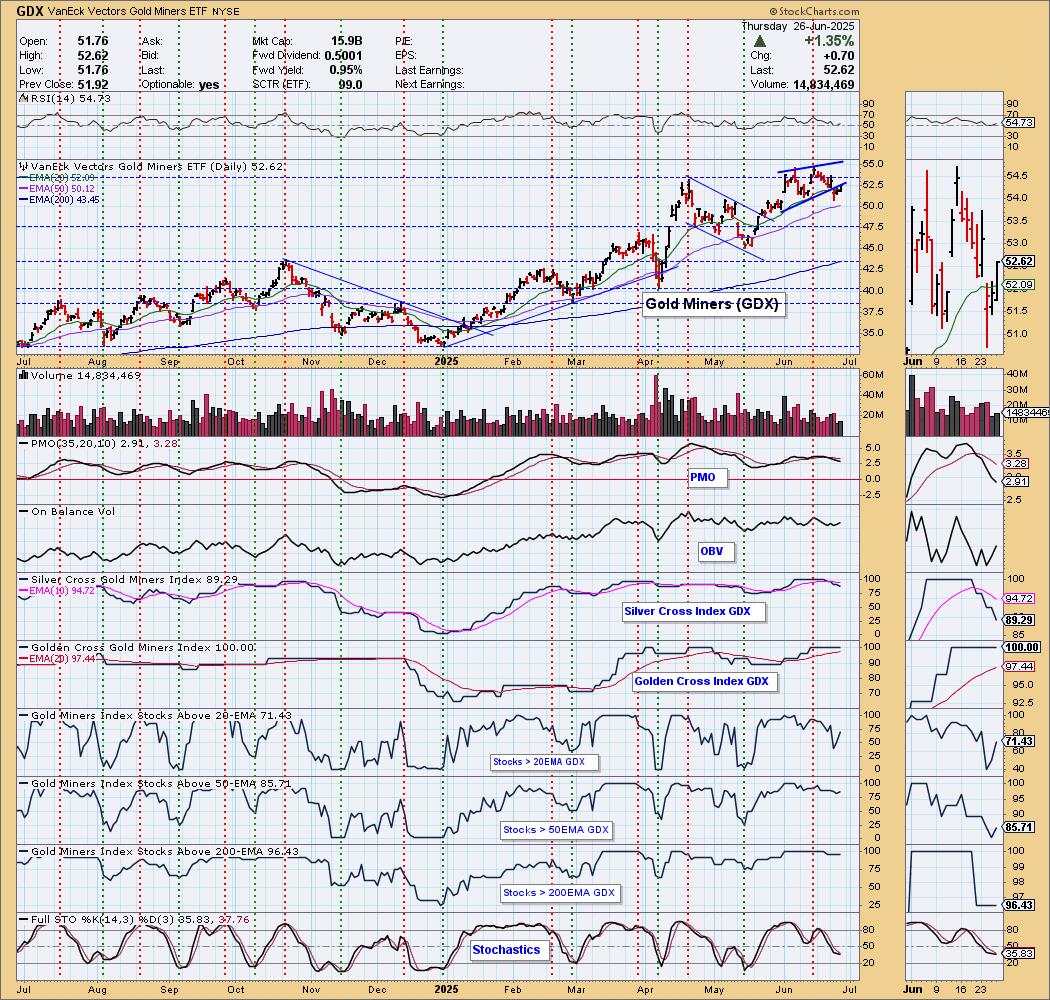
GOLD MINERS (GDX) Daily Chart: Gold Miners rallied in spite of the decline in Gold. This is very bullish. It appears we're going to get a nice bounce off the 50-day EMA. With the Dollar looking weak, GDX has some opportunity here. The PMO and Stochastics still look bearish but we did see some slight improvement to participation. There could be more upside ahead here.
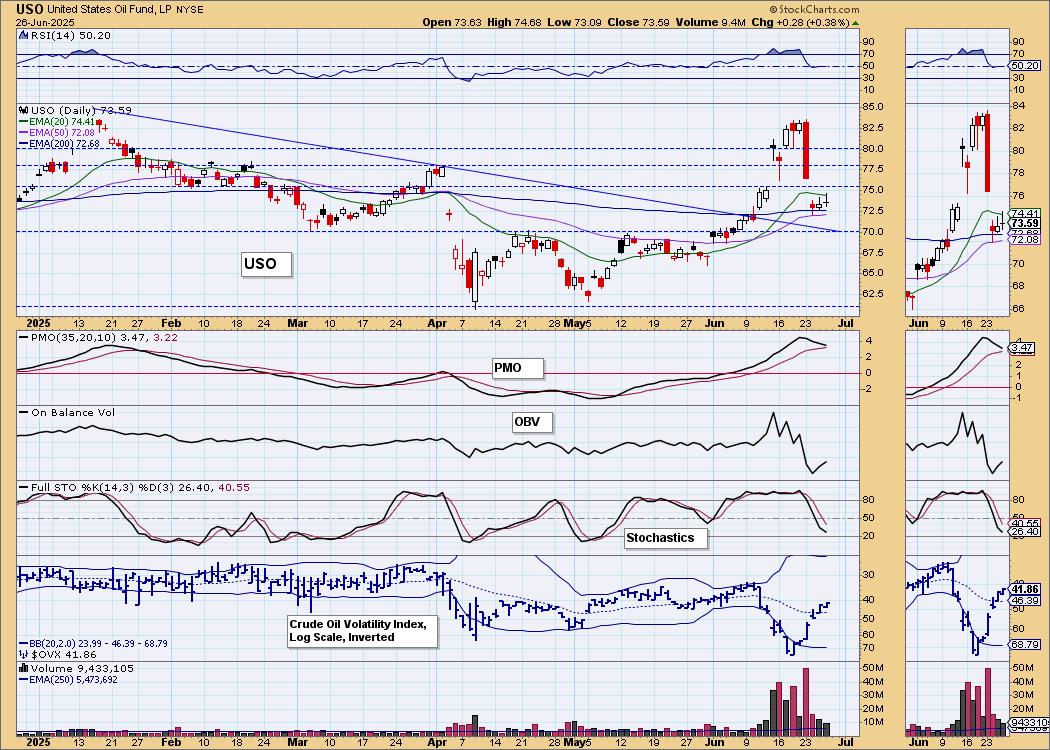
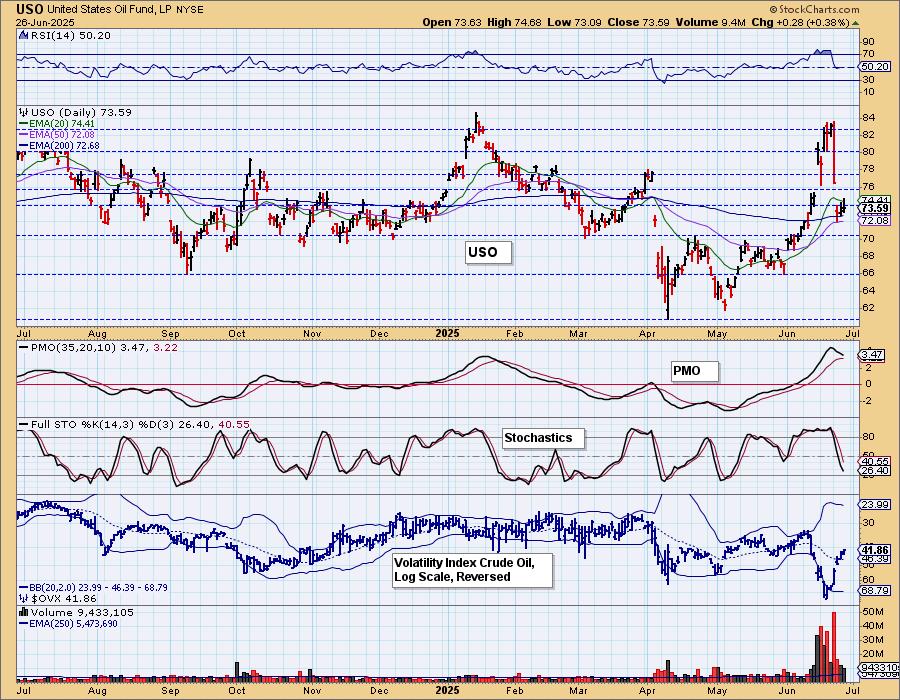
CRUDE OIL (USO)
IT Trend Model: BUY as of 6/11/2025
LT Trend Model: SELL as of 3/18/2025
USO Daily Chart: Crude managed a rally again today, but it was rather unimpressive. Price is holding above the 50-day EMA, but the bearish PMO and Stochastics tell us there is still downside pressure from the big decline. The rising trend out of the May low is still holding. The administration is pushing for more domestic production and that could push prices lower over time. Overall we are bearish on Crude right now.
Good Luck & Good Trading!
Erin Swenlin and Carl Swenlin
Technical Analysis is a windsock, not a crystal ball. --Carl Swenlin
(c) Copyright 2025 DecisionPoint.com
Disclaimer: This blog is for educational purposes only and should not be construed as financial advice. The ideas and strategies should never be used without first assessing your own personal and financial situation, or without consulting a financial professional. Any opinions expressed herein are solely those of the author, and do not in any way represent the views or opinions of any other person or entity.
DecisionPoint is not a registered investment advisor. Investment and trading decisions are solely your responsibility. DecisionPoint newsletters, blogs or website materials should NOT be interpreted as a recommendation or solicitation to buy or sell any security or to take any specific action.
NOTE: The signal status reported herein is based upon mechanical trading model signals, specifically, the DecisionPoint Trend Model. They define the implied bias of the price index based upon moving average relationships, but they do not necessarily call for a specific action. They are information flags that should prompt chart review. Further, they do not call for continuous buying or selling during the life of the signal. For example, a BUY signal will probably (but not necessarily) return the best results if action is taken soon after the signal is generated. Additional opportunities for buying may be found as price zigzags higher, but the trader must look for optimum entry points. Conversely, exit points to preserve gains (or minimize losses) may be evident before the model mechanically closes the signal.
Helpful DecisionPoint Links:
DecisionPoint Alert Chart List
DecisionPoint Golden Cross/Silver Cross Index Chart List
DecisionPoint Sector Chart List
Price Momentum Oscillator (PMO)