
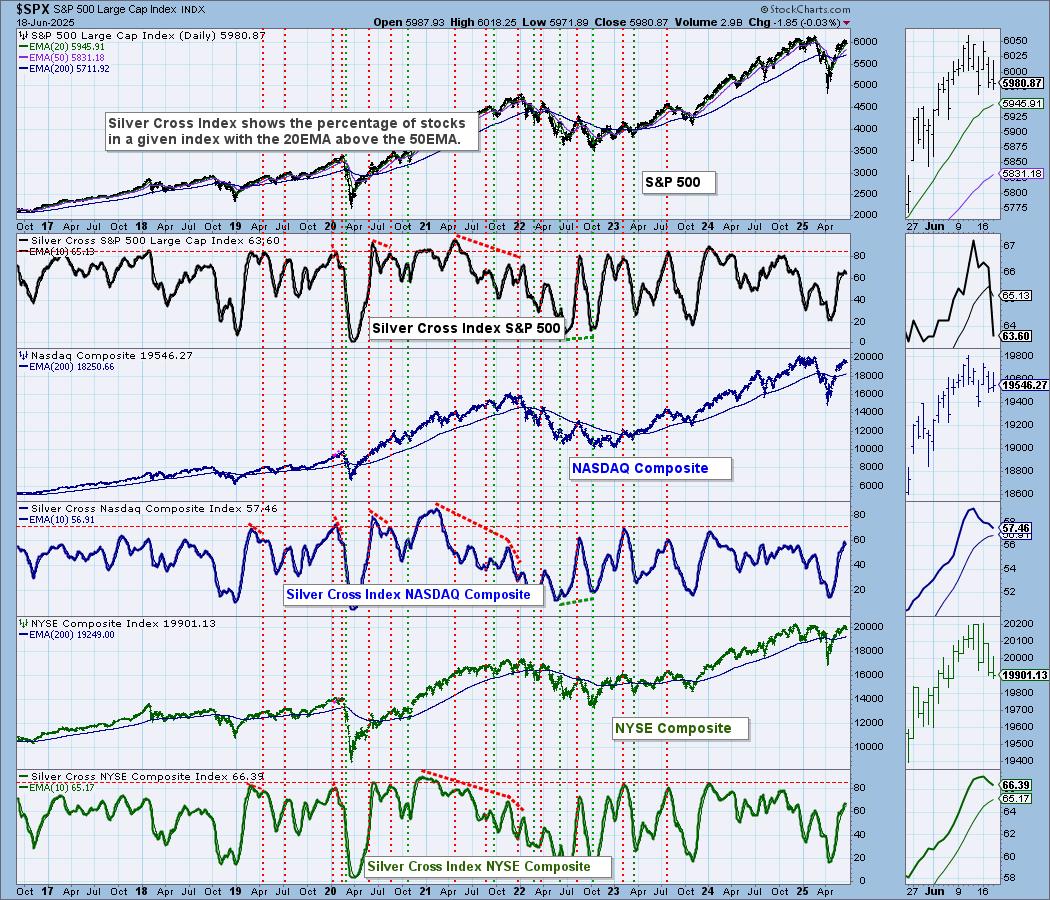
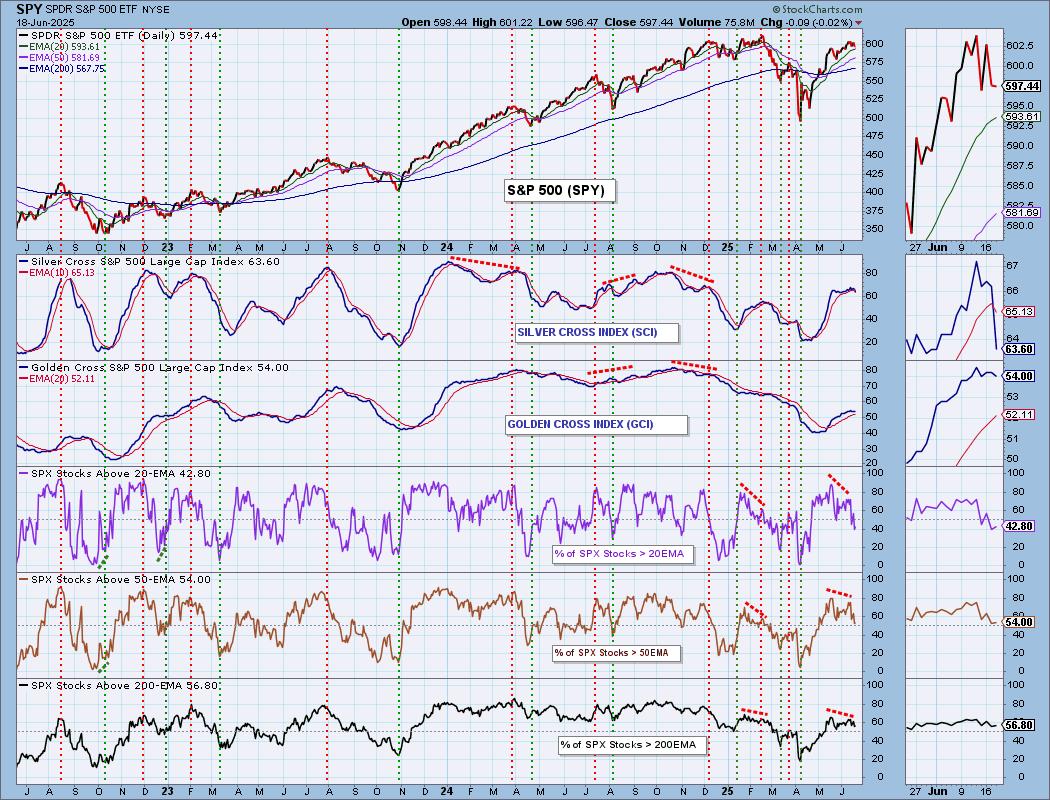
Today the Silver Cross Index (SCI) for the SP500 ($SPX) dropped beneath its signal line in a perilous drop. The SCI measures how many stocks have a 20-day EMA above the 50-day EMA. We're not seeing a similar "Bearish Shift" on the Nasdaq or NYSE, but in both cases the SCI is dropping. Readings are still above our bullish 50% threshold, but this doesn't look over.
The DecisionPoint Alert Weekly Wrap presents an end-of-week assessment of the trend and condition of the Stock Market, the U.S. Dollar, Gold, Crude Oil, and Bonds. The DecisionPoint Alert daily report (Monday through Thursday) is abbreviated and gives updates on the Weekly Wrap assessments.
MARKET/INDUSTRY GROUP/SECTOR INDEXES

CLICK HERE for Carl's annotated Market Index, Sector, and Industry Group charts.
THE MARKET (S&P 500)
IT Trend Model: NEUTRAL as of 3/4/2025
LT Trend Model: SELL as of 4/16/2025
SPY 10-Minute Chart: The market continued dropping in a declining trend out of the top from Monday. Trading got really choppy after the Fed announcement that rates would remain the same. Rate cuts are still figured in for this year.

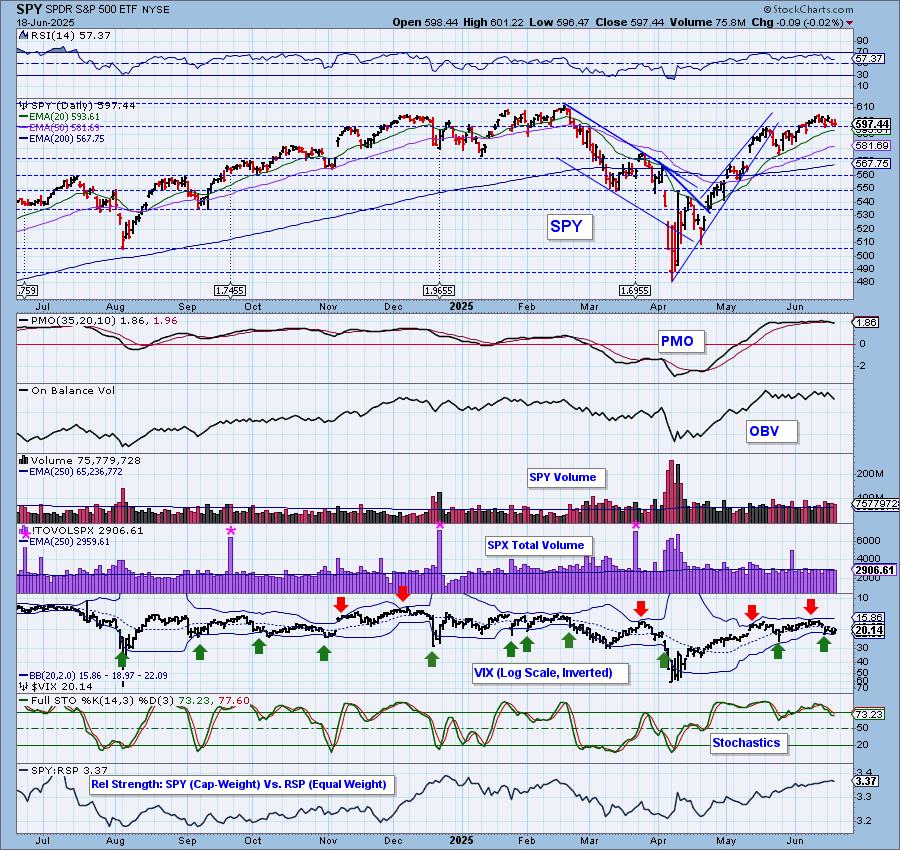
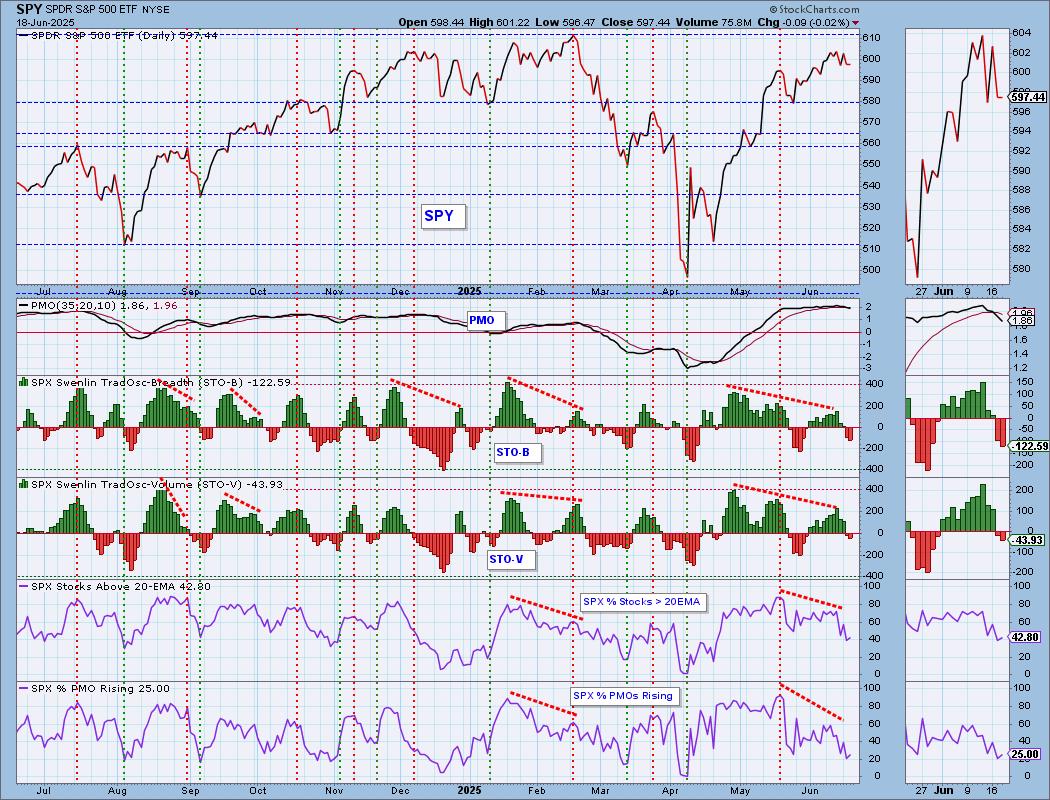
SPY Daily Chart: Price is clearly topping. The rising trend out of the late May low has been compromised, but price is still holding above support for now. The PMO continues to drop on its recent Crossover SELL Signal.
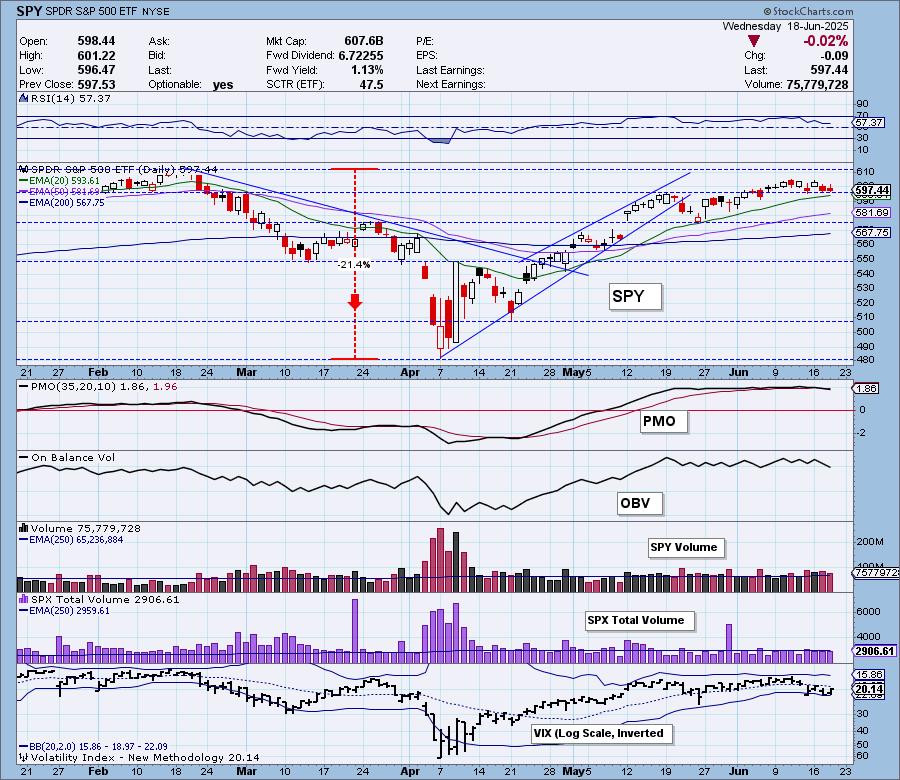
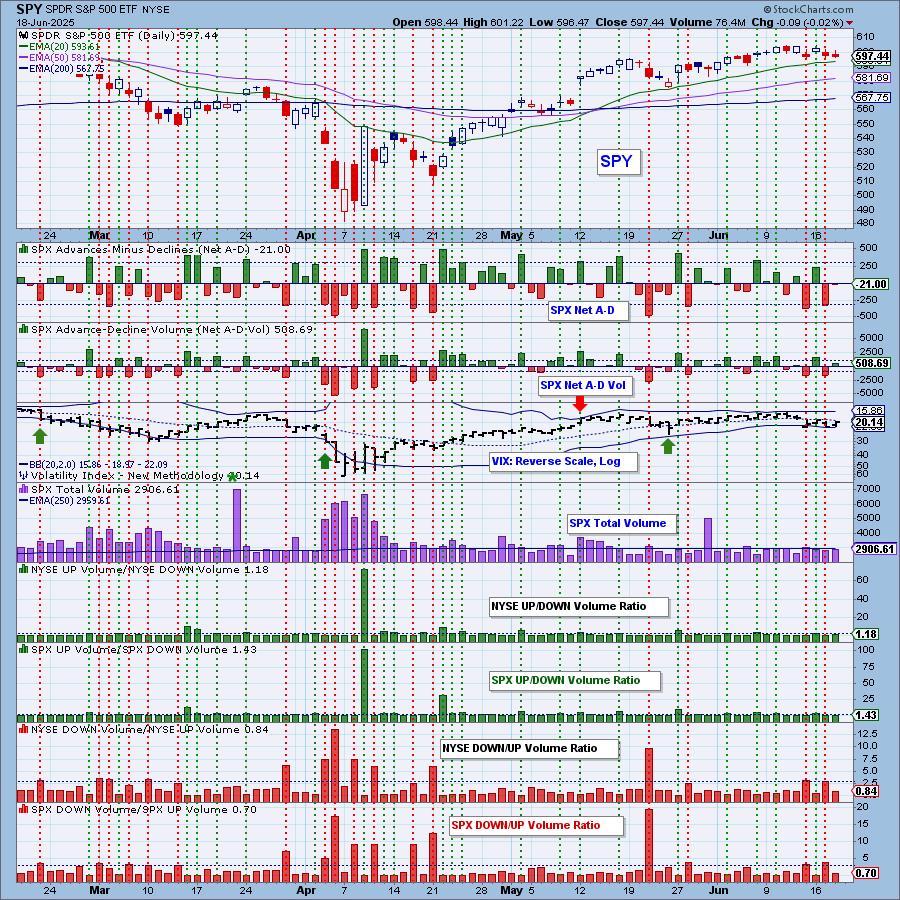
The VIX is holding below its moving average on the inverted scale and Stochastics have dropped below 80 displaying some internal weakness. Mega-caps are definitely leading the way right now given the rising relative strength line to equal-weight RSP. It is probably a good idea to watch the Magnificent Seven stocks more closely.
S&P 500 New 52-Week Highs/Lows: New Highs did rise, but this is an intraday reading and price was in positive territory the majority of the day. We have to wonder if those New Highs stuck. New Lows did not expand which is somewhat bullish. The High-Low Differential is still a problem as it continues to drop toward the zero line.
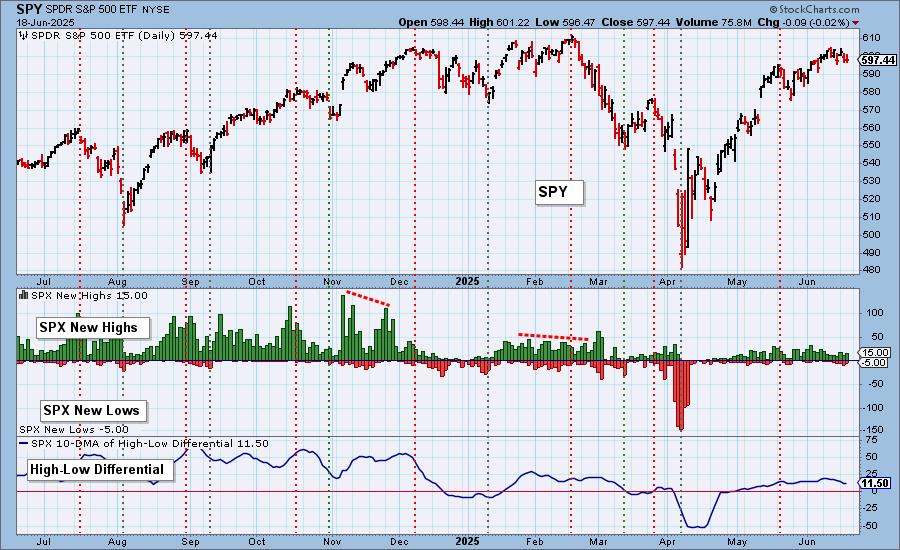
Climax* Analysis: There were no climax readings today.
*A climax is a one-day event when market action generates very high readings in, primarily, breadth and volume indicators. We also include the VIX, watching for it to penetrate outside the Bollinger Band envelope. The vertical dotted lines mark climax days -- red for downside climaxes, and green for upside. Climaxes are at their core exhaustion events; however, at price pivots they may be initiating a change of trend.
Short-Term Market Indicators: The short-term market trend is UP and the condition is NEUTRAL.
Swenlin Trading Oscillators (STOs) continue to make their way lower. The STO-B is starting to look oversold, but it can certainly move much lower from here. Both hold negative divergences with price. Also holding negative divergences are %Stocks > 20EMA and %PMOs Rising. Readings are below our 50% bullish threshold. Only one quarter of the index have rising momentum.
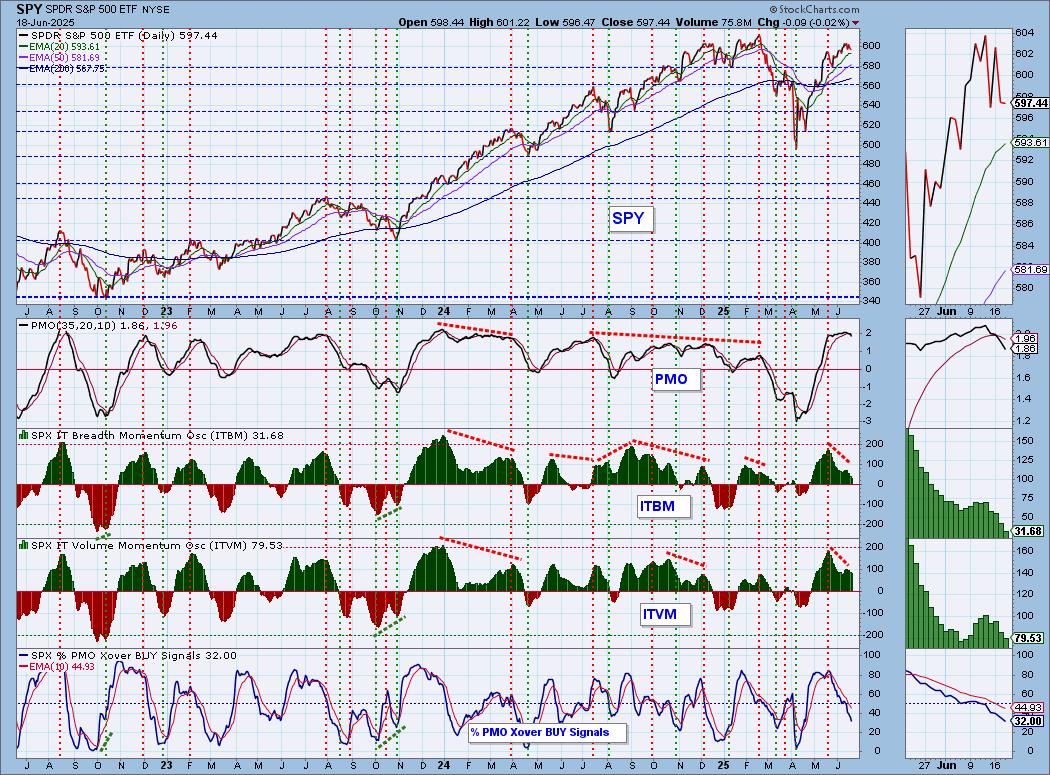
Intermediate-Term Market Indicators: The intermediate-term market trend is UP and the condition is NEUTRAL.
The ITBM and ITVM are nearing negative territory on their decline. PMO BUY Signals continue to diminish. The indicator shows a negative divergence, as do the ITBM and ITVM. %PMO Xover BUY Signals is not oversold so things could get worse.
PARTICIPATION CHART (S&P 500): The following chart objectively shows the depth and trend of participation for the SPX in two time frames.
- Intermediate-Term - the Silver Cross Index (SCI) shows the percentage of SPX stocks on IT Trend Model BUY signals (20-EMA > 50-EMA). The opposite of the Silver Cross is a "Dark Cross" -- those stocks are, at the very least, in a correction.
- Long-Term - the Golden Cross Index (GCI) shows the percentage of SPX stocks on LT Trend Model BUY signals (50-EMA > 200-EMA). The opposite of a Golden Cross is the "Death Cross" -- those stocks are in a bear market.
The market bias is BEARISH in the intermediate term.
The market bias is BULLISH in the long term.
All of our participation readings are dropping and hold declining trends which set up negative divergences across the board. As noted in the opening, the Silver Cross Index dropped below its signal line for a "Bearish Shift". This has moved the IT Bias to BEARISH. It was a seriously deep drop today and that definitely does not bode well. The Golden Cross Index is still holding above its signal line so the LT Bias remains BULLISH.
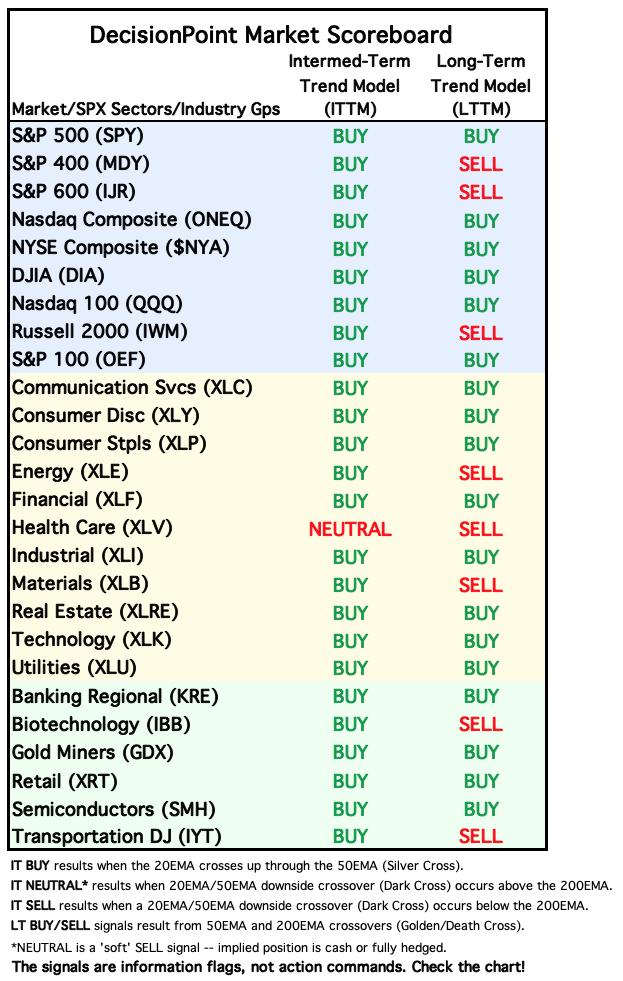
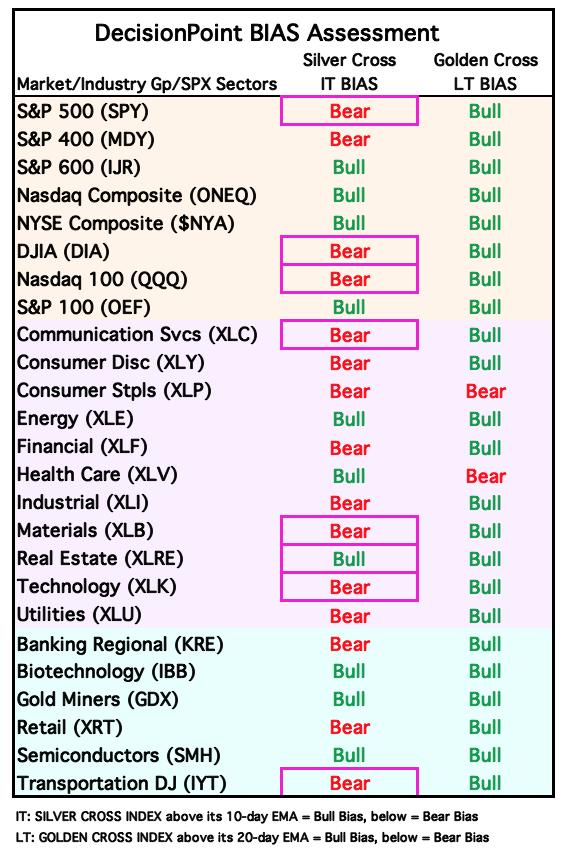
BIAS Assessment: The following table expresses the current BIAS of various price indexes based upon the relationship of the Silver Cross Index to its 10-day EMA (intermediate-term), and of the Golden Cross Index to its 20-day EMA (long-term). When the Index is above the EMA it is bullish, and it is bearish when the Index is below the EMA. The BIAS does not imply that any particular action should be taken. It is information to be used in the decision process.
The items with highlighted borders indicate that the BIAS changed today.
*****************************************************************************************************
CONCLUSION: The Bias Table is turning red as more members move to bearish biases. The SPY had its own Bearish Shift on the Silver Cross Index adding to the red. Key indicators are not only declining, most hold negative divergences with price. The market looks very toppy and is displaying weakness with its double top in the very short term. We expect the market to make its way lower beneath current support. Stops should be set for protection.
Erin is 60% long, 0% short. (This is intended as information, not a recommendation.)
*****************************************************************************************************
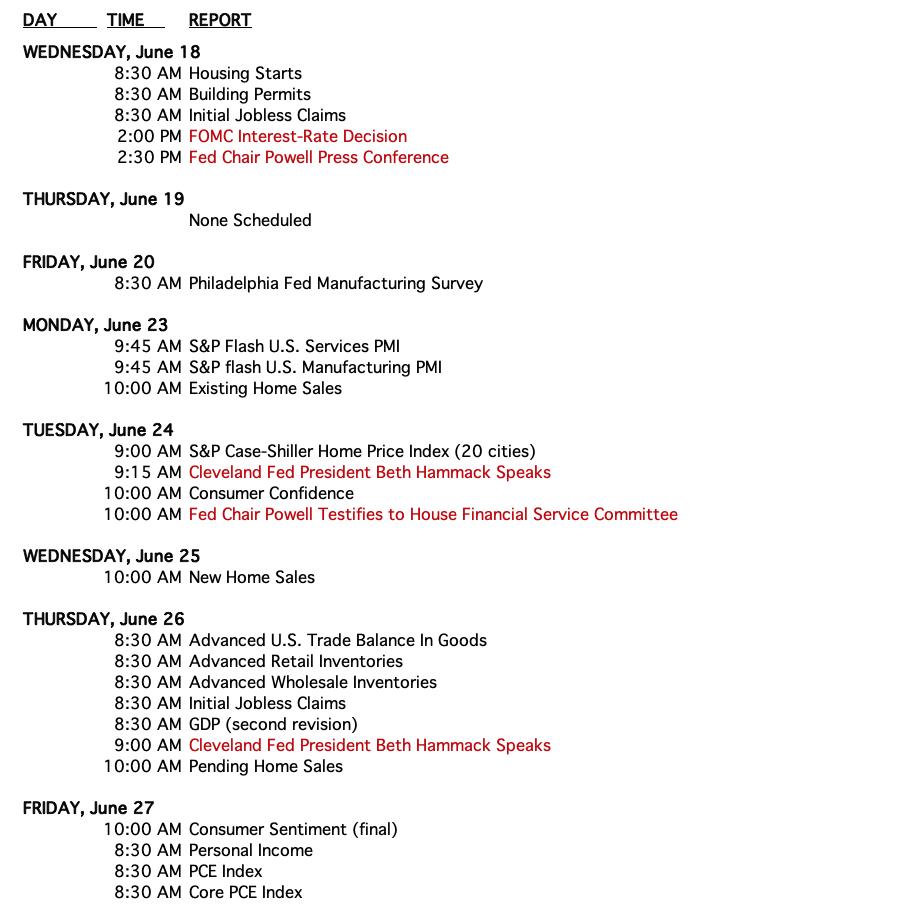
CALENDAR
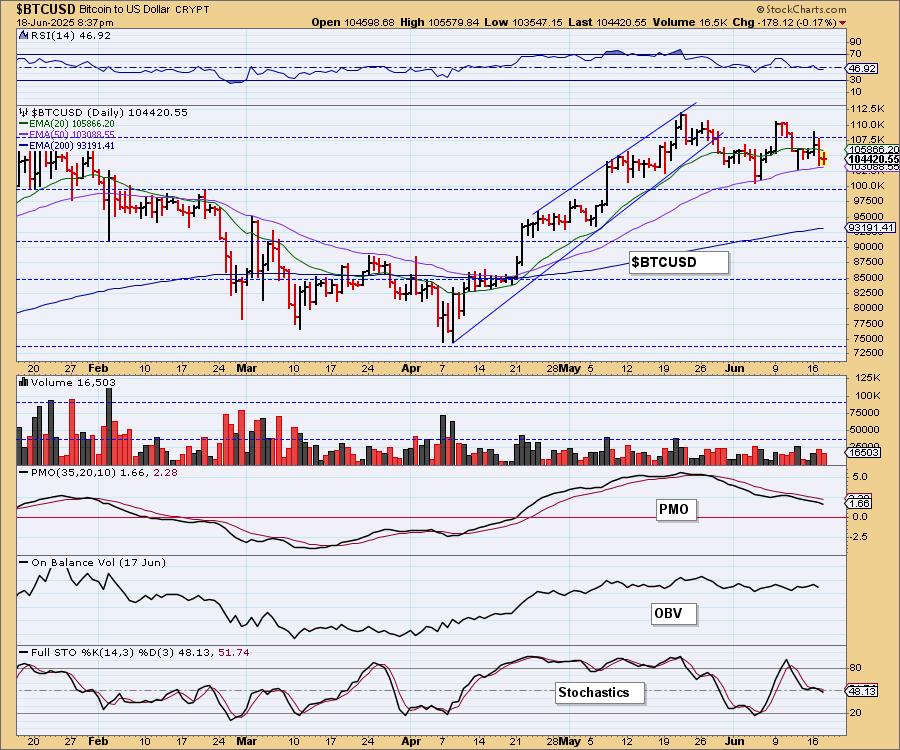
BITCOIN
Bitcoin is consolidating and lengthening the flag on the flag pole. Indicators suggest that price will test support at this month's low. Stochastics look particularly bearish as they have dropped into negative territory.
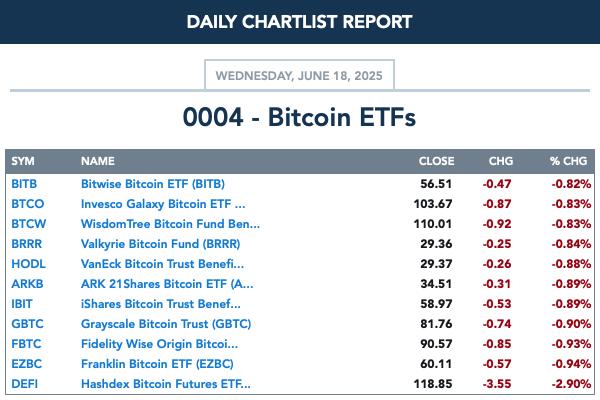
BITCOIN ETFs
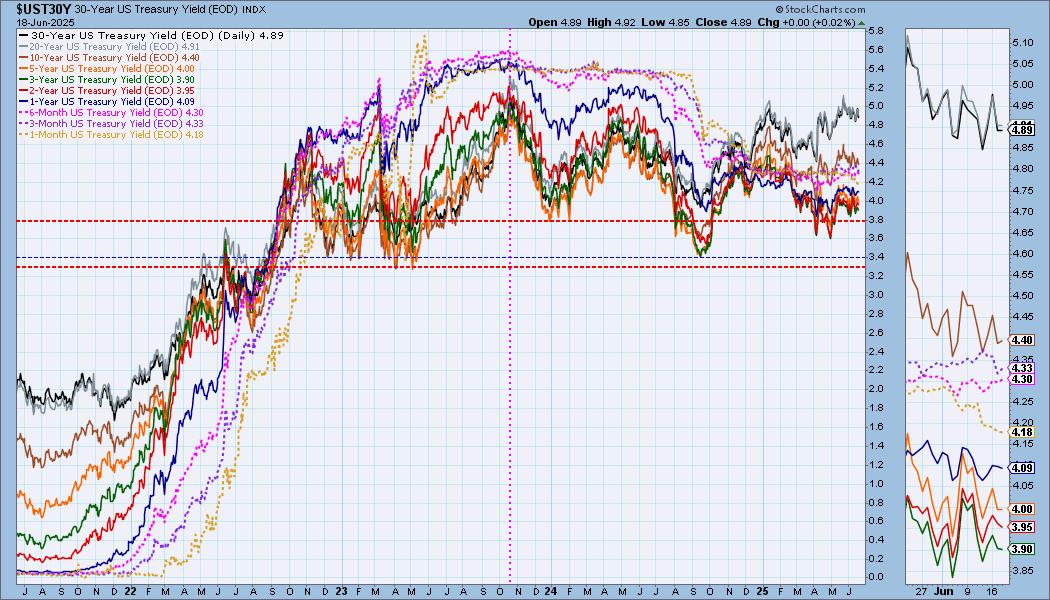
INTEREST RATES
Yields were mixed today as we did see a few rise while the majority fell. We're currently bullish on yields.
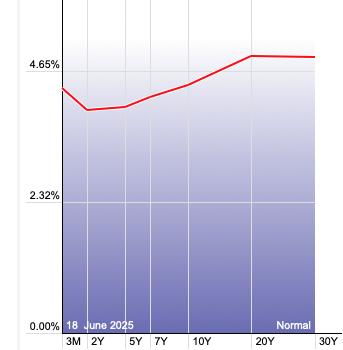
The Yield Curve Chart from StockCharts.com shows us the inversions taking place. The red line should move higher from left to right. Inversions are occurring where it moves downward.
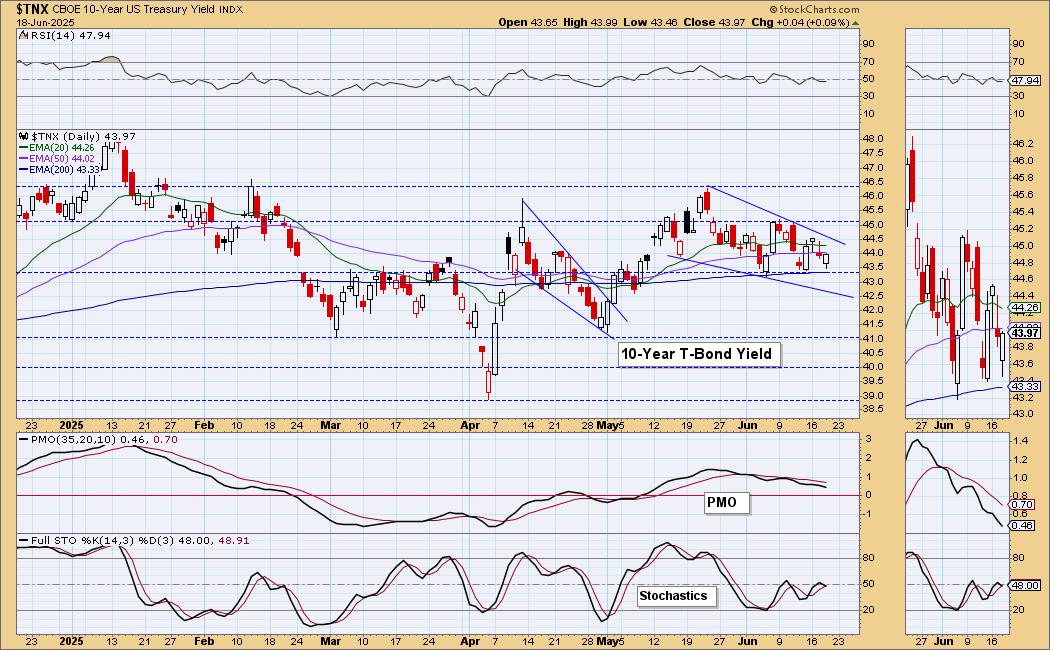
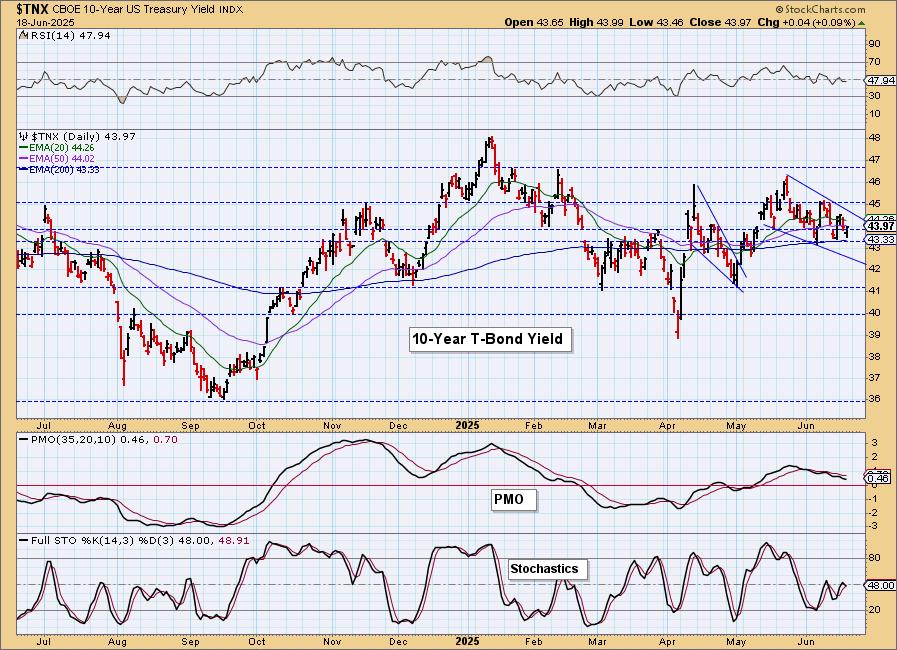
10-YEAR T-BOND YIELD
We are monitoring a bullish falling wedge on $TNX that does imply we'll get a breakout. It may not happen just yet as the PMO is still falling and Stochastics have topped. It may need to test the bottom of the pattern before we get a breakout.
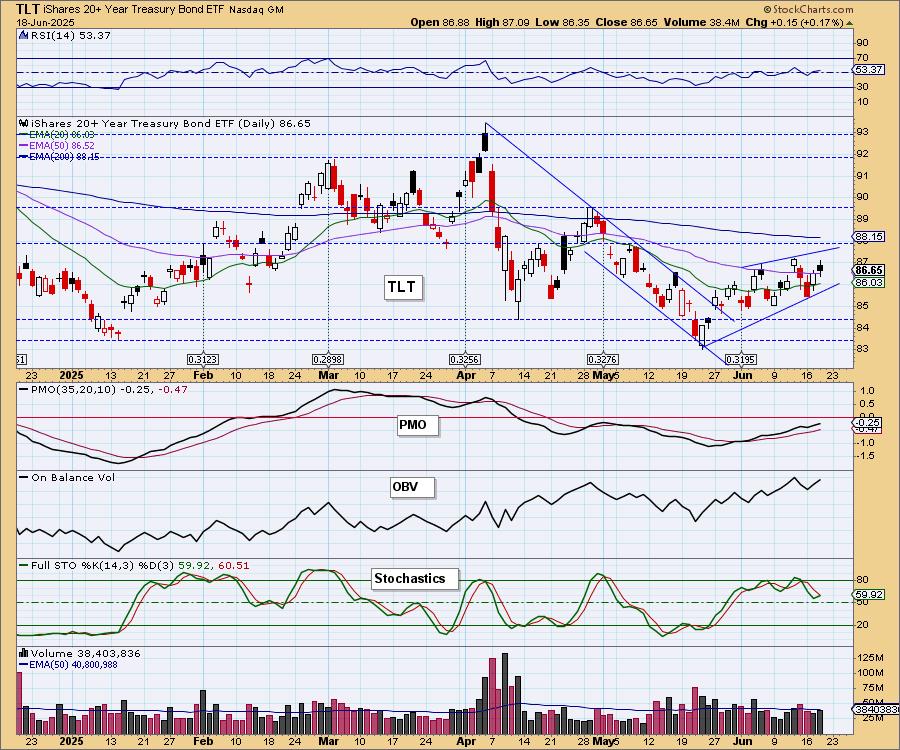
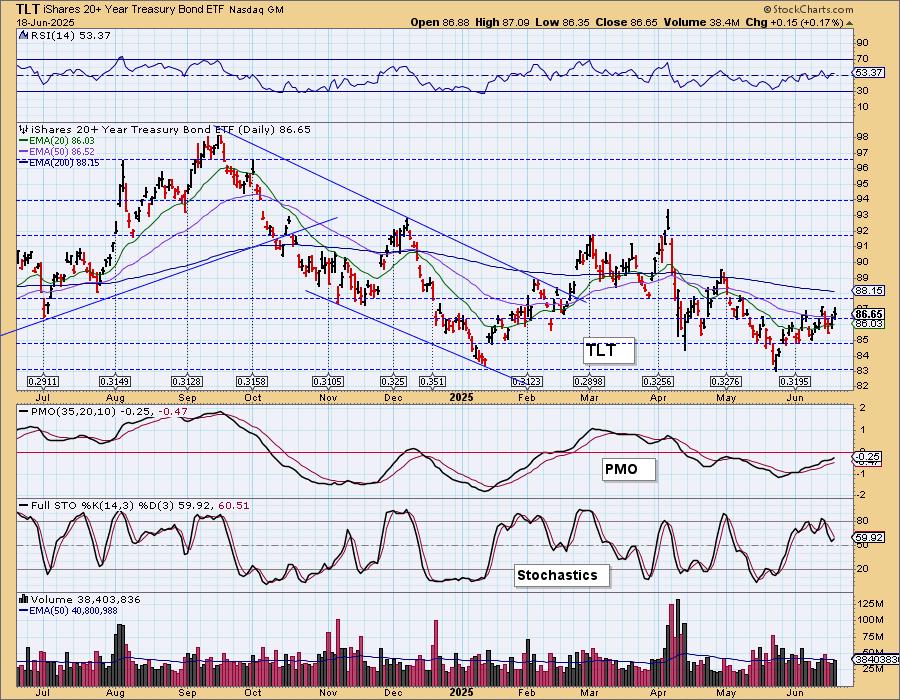
BONDS (TLT)
IT Trend Model: SELL as of 4/14/2025
LT Trend Model: SELL as of 12/13/2024
TLT Daily Chart: TLT is traveling within a bearish rising wedge that does imply a breakdown ahead. For now the PMO is rising, the RSI is positive and Stochastics are rising so while we are bullish on yields, we think there may be some more upside for Bonds in the short term.
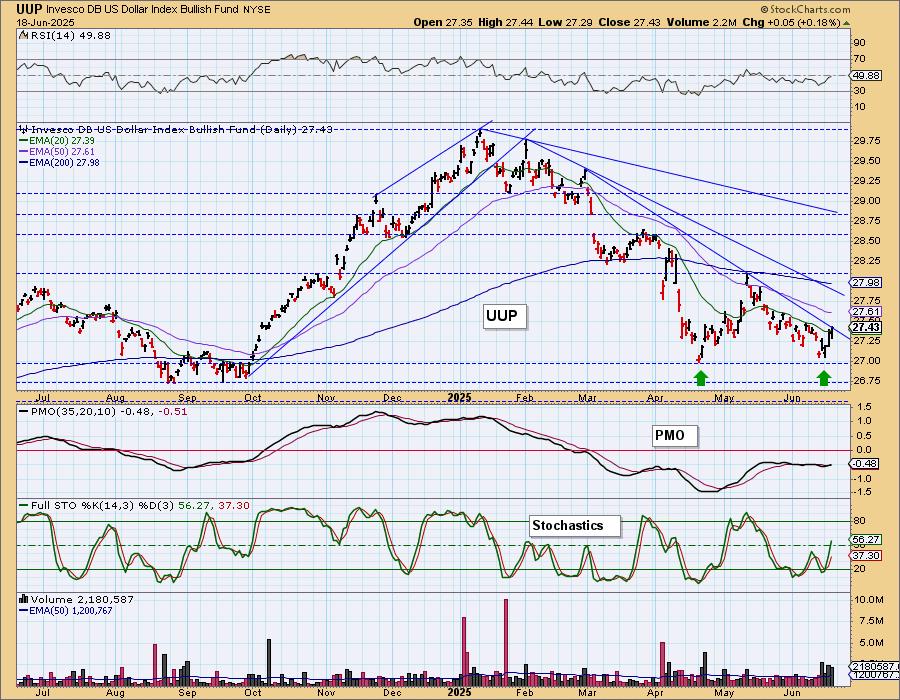
DOLLAR (UUP)
IT Trend Model: NEUTRAL as of 3/5/2025
LT Trend Model: SELL as of 4/25/2025
UUP Daily Chart: The Dollar is beginning to strength off support. It is still in a declining trend, but the first one is about to be broken. This is the best it has looked in some time so we do think we will see a breakout here. The RSI is still negative, but the PMO has triggered a Crossover BUY Signal and Stochastics have risen into positive territory. We'll look for some more upside.
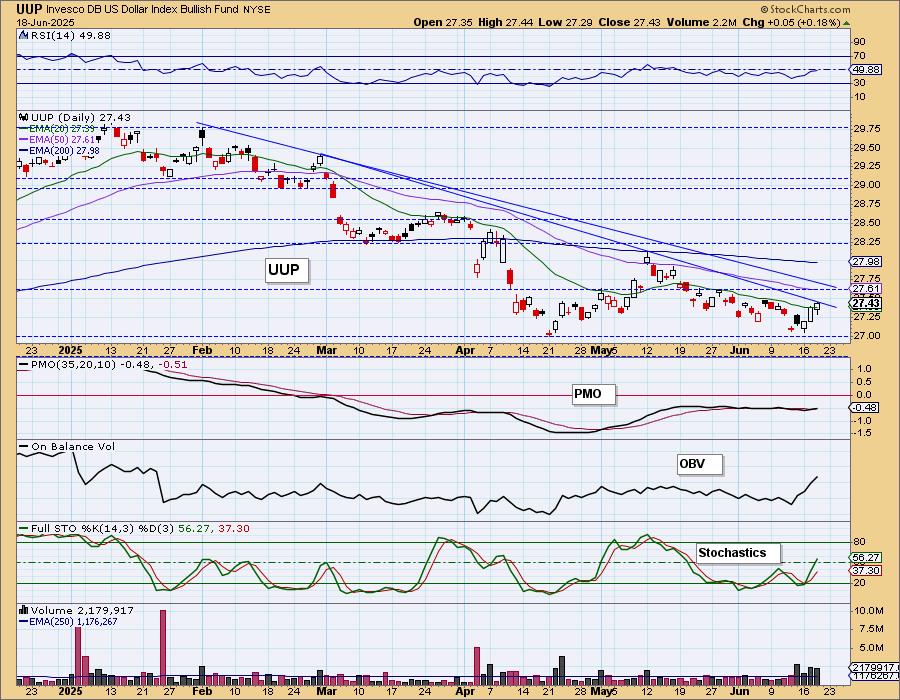
We could be looking at the start of a bullish double bottom.
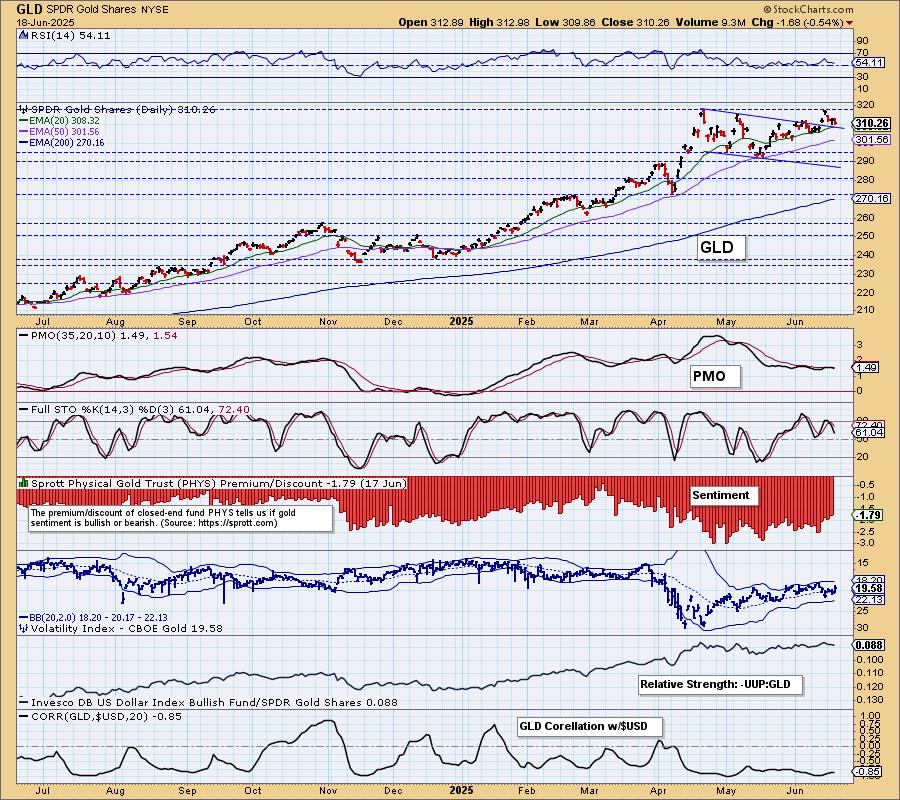
GOLD
IT Trend Model: BUY as of 1/10/2025
LT Trend Model: BUY as of 10/20/2023
GLD Daily Chart: A stronger Dollar is not going to be good for Gold. So far it is holding above the declining tops trendline, but given the PMO reversal and new Crossover SELL Signal combined with a rally on the Dollar, we should look for it to fall further from here. Stochastics are also in decline.
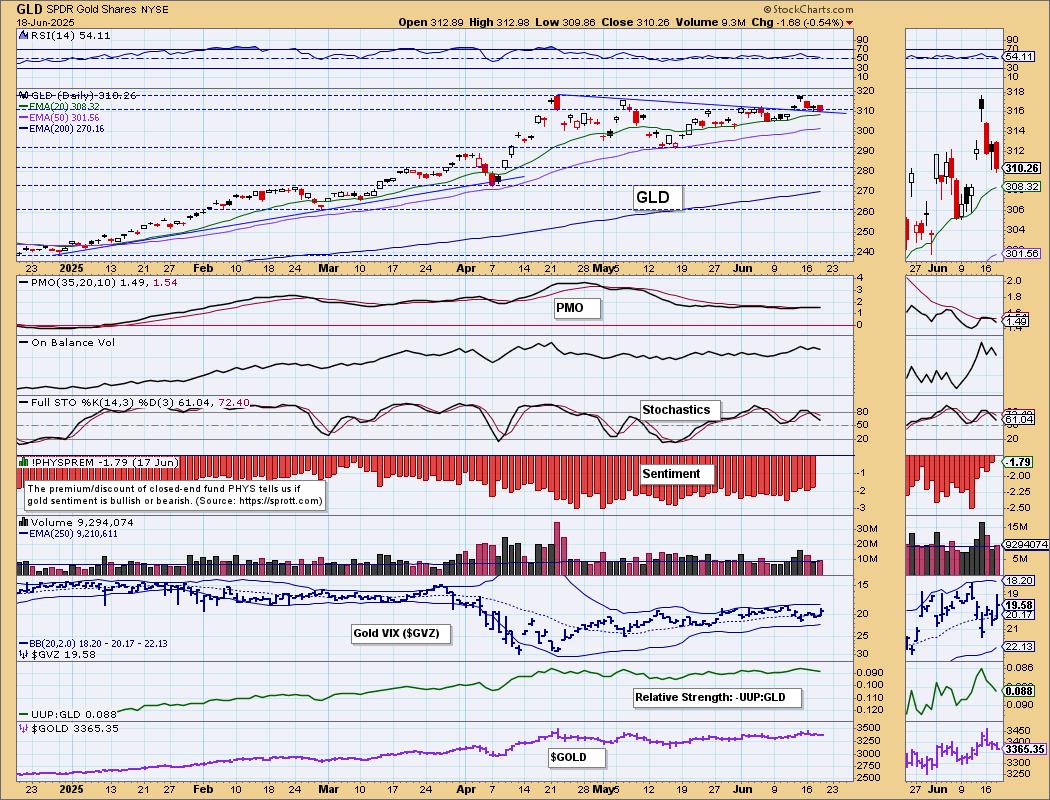
The rising trend out of the May low is still intact, but we expect it to be broken. For now we do see rising relative strength against the Dollar, but we suspect that will soon change.
GOLD MINERS (GDX) Daily Chart: With the rise in the Dollar likely to hold down Gold, we think Gold Miners are particularly vulnerable right now. We have a bearish rising wedge on the chart and the PMO has topped. There is a good chance we're going to see a breakdown here. We can also see a double top formation within the wedge. Participation is still holding up, but we expect that to change very soon. Be careful with this group right now.

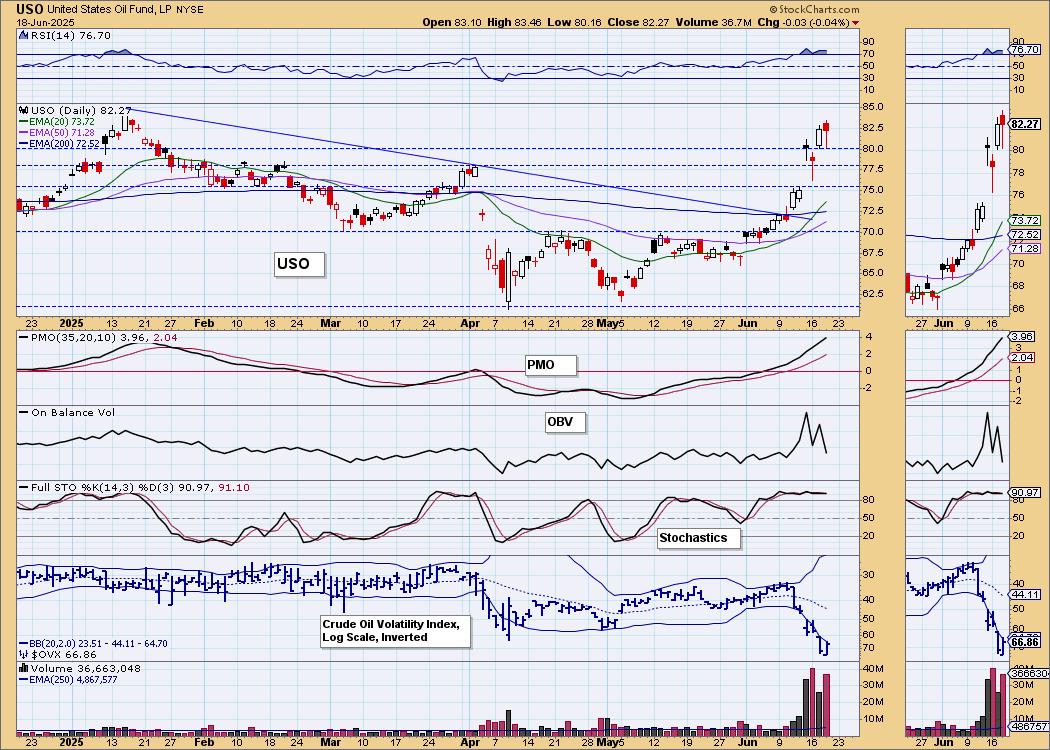
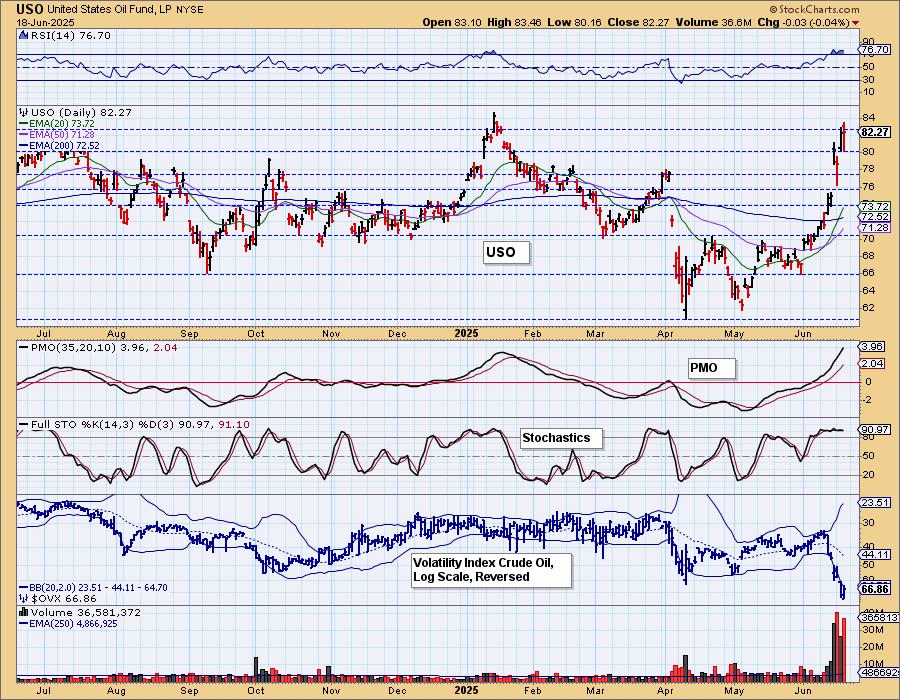
CRUDE OIL (USO)
IT Trend Model: BUY as of 6/11/2025
LT Trend Model: SELL as of 3/18/2025
USO Daily Chart: Crude was mostly unchanged today. The conflict in the Middle East could keep USO elevated awhile longer. $OVX looks very bullish as it continues to puncture the lower Bollinger Band on the inverted scale. The RSI is very overbought so it is likely we will see a pause or some consolidation to bring it under control, but given headlines and the conflict, it isn't out of the question that we'll see even higher prices. For now the indicators are very strong so we'll look for some more upside, at least until price hits overhead resistance.
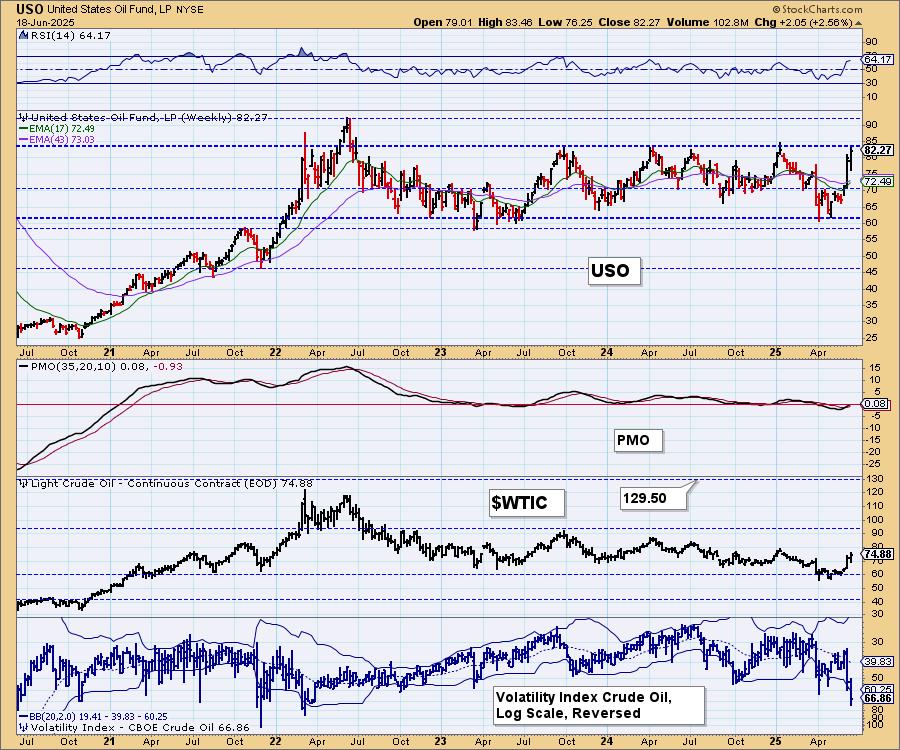
USO Weekly Chart: Yesterday's comments still apply:
"With war-related volatility, we think it is a good idea to keep the weekly chart close at hand. Note that USO still maintains its long-term trading range and a distinct impression of stability. The most obvious top of the range is 85, but it could be stretched to about 93, if circumstances require."
Good Luck & Good Trading!
Erin Swenlin and Carl Swenlin
Technical Analysis is a windsock, not a crystal ball. --Carl Swenlin
(c) Copyright 2025 DecisionPoint.com
Disclaimer: This blog is for educational purposes only and should not be construed as financial advice. The ideas and strategies should never be used without first assessing your own personal and financial situation, or without consulting a financial professional. Any opinions expressed herein are solely those of the author, and do not in any way represent the views or opinions of any other person or entity.
DecisionPoint is not a registered investment advisor. Investment and trading decisions are solely your responsibility. DecisionPoint newsletters, blogs or website materials should NOT be interpreted as a recommendation or solicitation to buy or sell any security or to take any specific action.
NOTE: The signal status reported herein is based upon mechanical trading model signals, specifically, the DecisionPoint Trend Model. They define the implied bias of the price index based upon moving average relationships, but they do not necessarily call for a specific action. They are information flags that should prompt chart review. Further, they do not call for continuous buying or selling during the life of the signal. For example, a BUY signal will probably (but not necessarily) return the best results if action is taken soon after the signal is generated. Additional opportunities for buying may be found as price zigzags higher, but the trader must look for optimum entry points. Conversely, exit points to preserve gains (or minimize losses) may be evident before the model mechanically closes the signal.
Helpful DecisionPoint Links:
DecisionPoint Alert Chart List
DecisionPoint Golden Cross/Silver Cross Index Chart List
DecisionPoint Sector Chart List
Price Momentum Oscillator (PMO)