
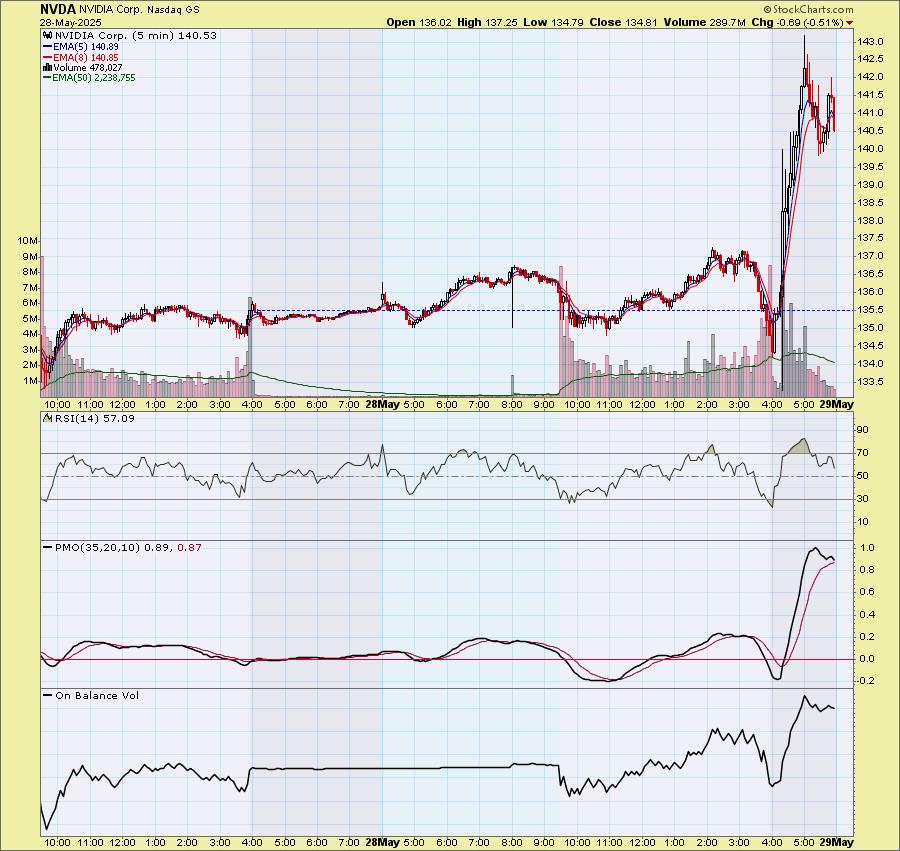
NVIDIA (NVDA) reported earnings after the bell and they have been well-received. Last we looked, NVDA was up +4.45% in after-hours trading. We can see the jump after the bell and the formation of a bull flag that does imply more upside. However, we do note that the 5-minute PMO is in decline right now. After-hours moves don't necessarily translate to the next day's trading, but this does bode well for the index.
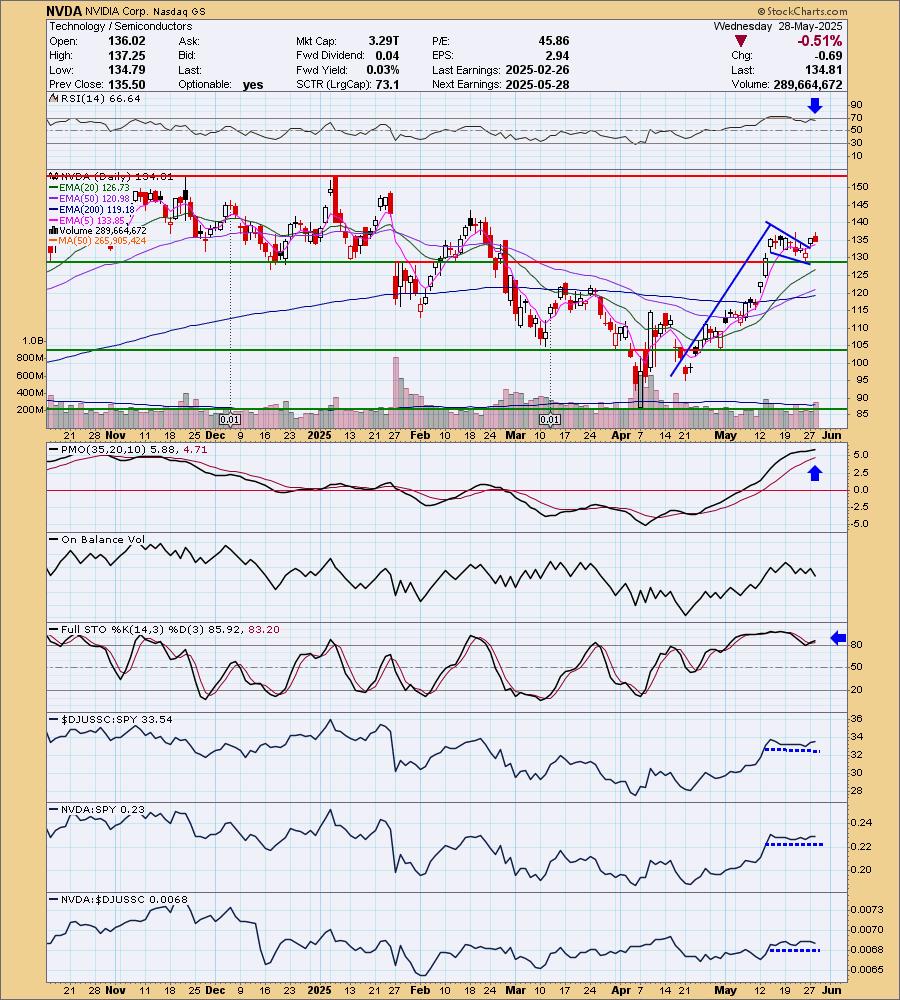
We can see a bull flag on the daily chart that has been confirmed with yesterday's breakout. Despite the long rally, the RSI is not overbought so we could see more upside from here. The PMO is rising strongly well above the zero line. Relative strength for the group is on par with the SPY. NVDA is showing inline relative strength to both the group and the SPY.
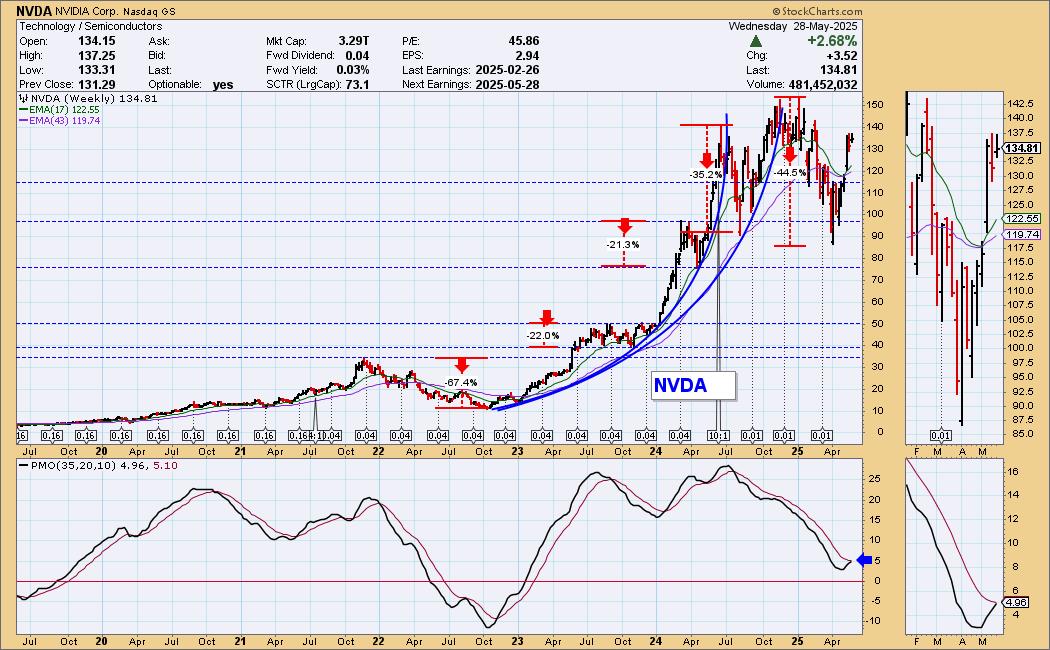
We can see various parabolic advances that resulted in deep declines. The last one was particularly painful. At this point price is rising vertically and that would also call for a breakdown or at least some consolidation. The weekly PMO is quite favorable suggesting we should ultimately see more upside for NVDA unless this vertical rally breaks down before then.
The DecisionPoint Alert Weekly Wrap presents an end-of-week assessment of the trend and condition of the Stock Market, the U.S. Dollar, Gold, Crude Oil, and Bonds. The DecisionPoint Alert daily report (Monday through Thursday) is abbreviated and gives updates on the Weekly Wrap assessments.
MARKET/INDUSTRY GROUP/SECTOR INDEXES

CLICK HERE for Carl's annotated Market Index, Sector, and Industry Group charts.
THE MARKET (S&P 500)
IT Trend Model: NEUTRAL as of 3/4/2025
LT Trend Model: SELL as of 4/16/2025
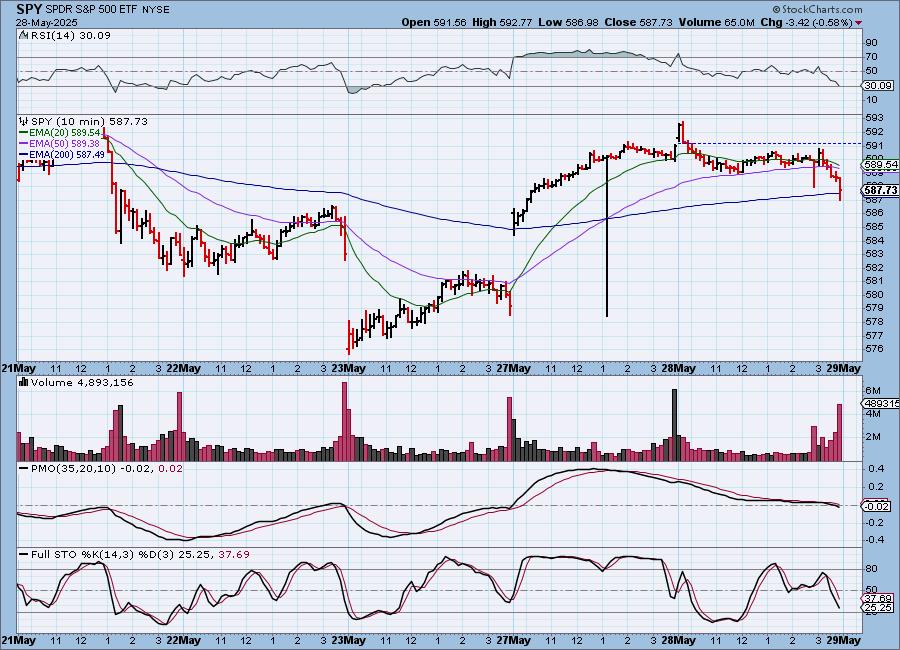
SPY 10-Minute Chart: Price spent the majority of the day in consolidation mode below yesterday's close. The upside initiation climax didn't see follow-through today. The deeper decline to finish the day is concerning. It is bringing the 10-minute PMO lower and Stochastics are falling in negative territory.
SPY Daily Chart: We did see a higher high and a higher low, but past that, the upside initiation climax from yesterday ultimately failed to produce. The PMO is still technically rising and the RSI is positive, not overbought.
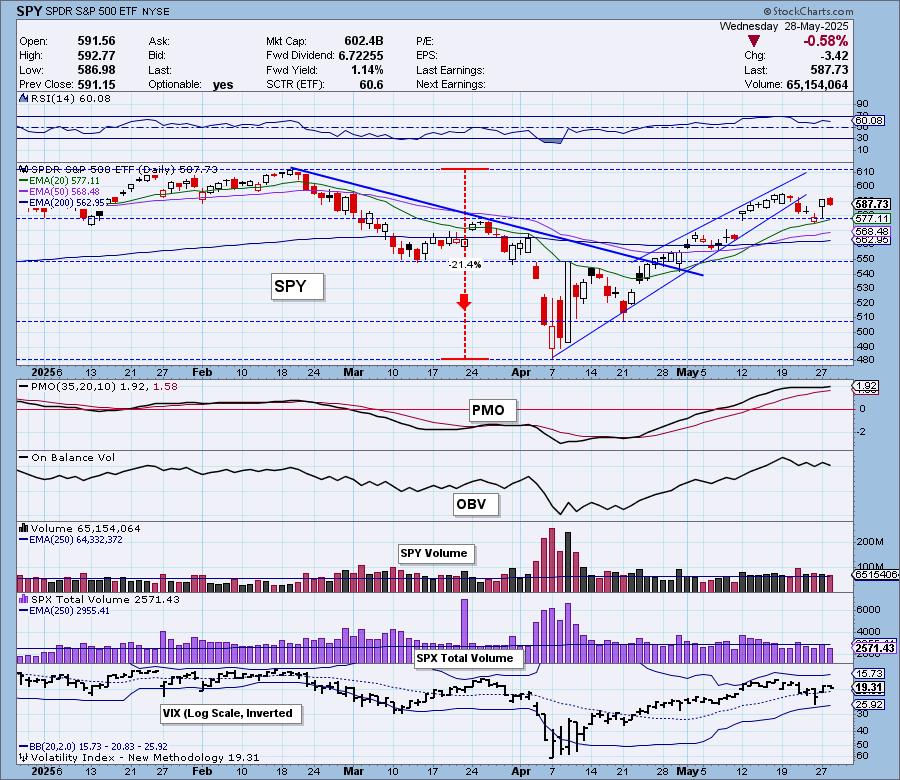
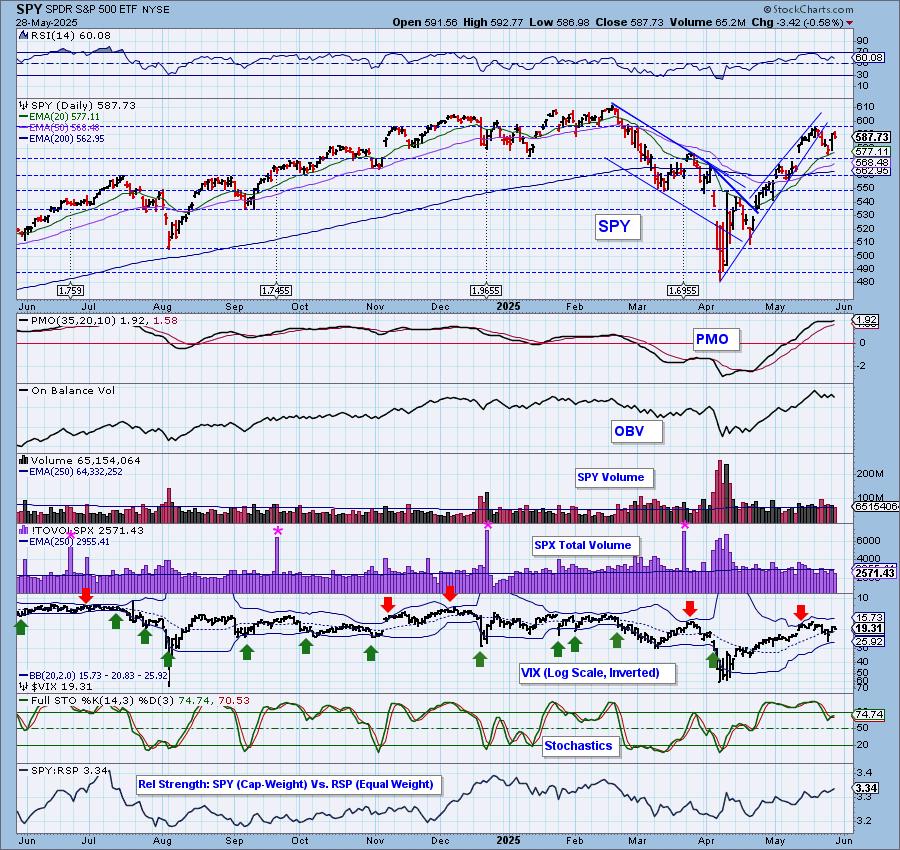
We still detect internal strength given the VIX is above its moving average on the inverted scale and Stochastics are rising in positive territory. Mega-caps need to hold up given the rising relative strength line to equal-weight RSP.
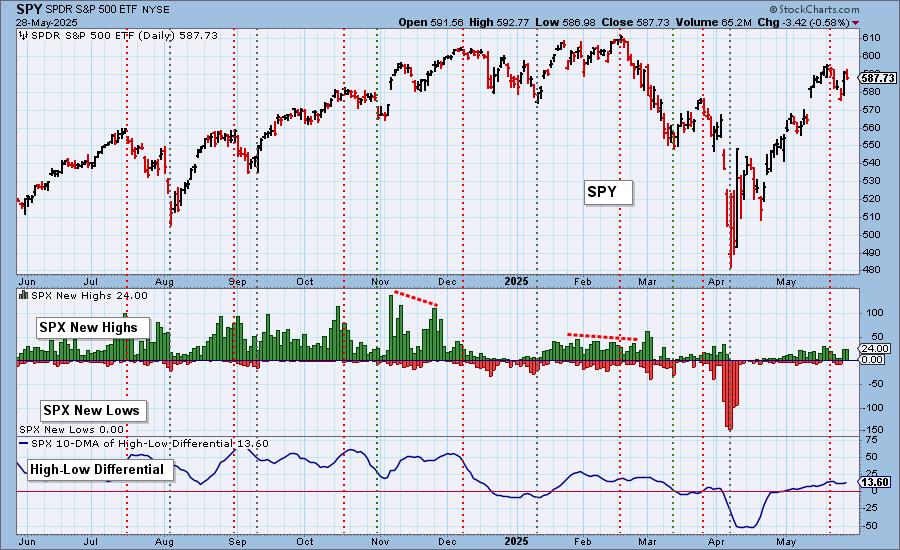
S&P 500 New 52-Week Highs/Lows: New Highs were on par with yesterday despite the decline. We didn't see any New Lows. The High-Low Differential is technically rising, but not with much gusto.
Climax* Analysis: There were three climax readings on the four relevant indicators today, giving us a downside initiation climax. SPX Total Volume was only 87% of the one-year daily average volume and thus, like yesterday's upside initiation climax, it did not confirm.
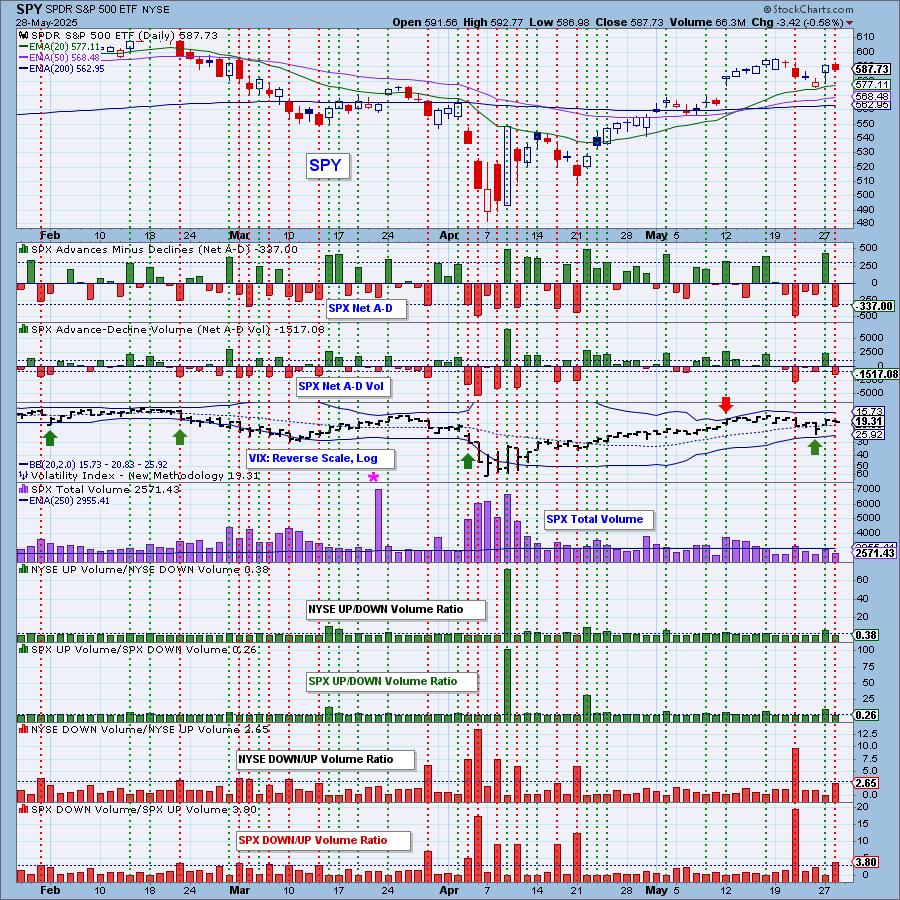
*A climax is a one-day event when market action generates very high readings in, primarily, breadth and volume indicators. We also include the VIX, watching for it to penetrate outside the Bollinger Band envelope. The vertical dotted lines mark climax days -- red for downside climaxes, and green for upside. Climaxes are at their core exhaustion events; however, at price pivots they may be initiating a change of trend.
Short-Term Market Indicators: The short-term market trend is UP and the condition is SOMEWHAT OVERSOLD.
Swenlin Trading Oscillators (STOs) switched gears and turned down today. They are in oversold territory and that can be good. They aren't as oversold as they can get and they are declining so we consider them bearish. Participation dropped on the decline today. We lost a great deal of rising PMOs and that could push the market lower.
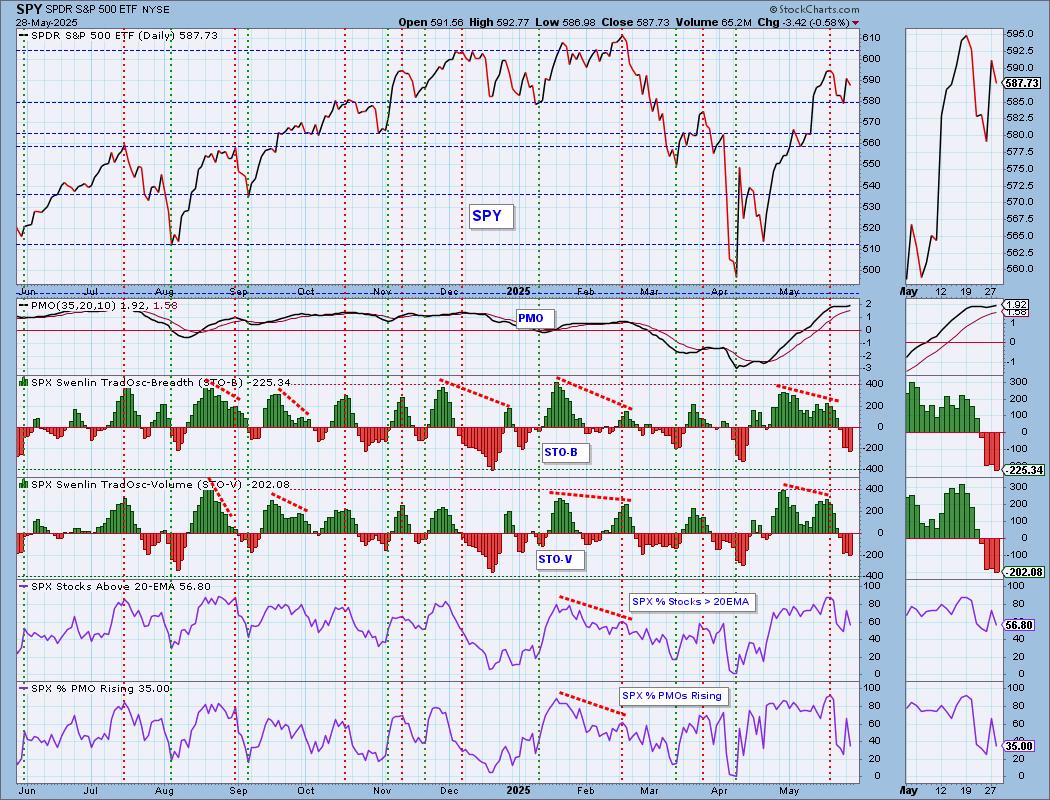
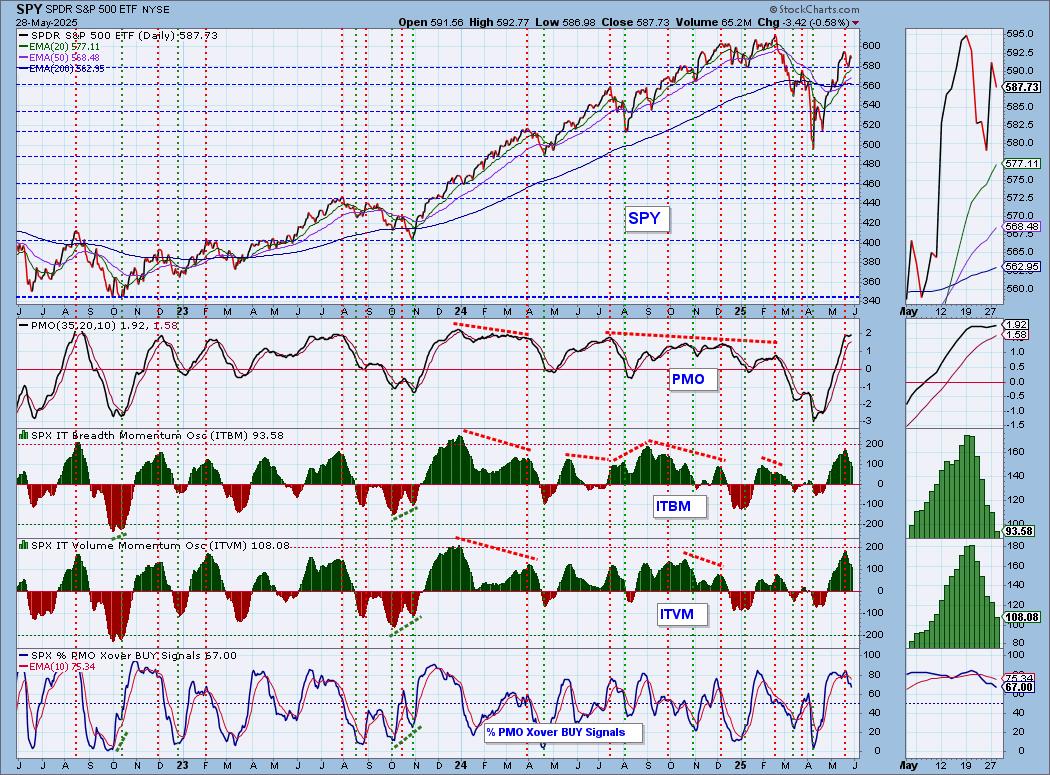
Intermediate-Term Market Indicators: The intermediate-term market trend is UP and the condition is OVERBOUGHT.
The ITBM and ITVM look very bearish as they continue to decline out of overbought territory. They certainly suggest a decline is ahead. We lost some PMO BUY Signals on the decline.
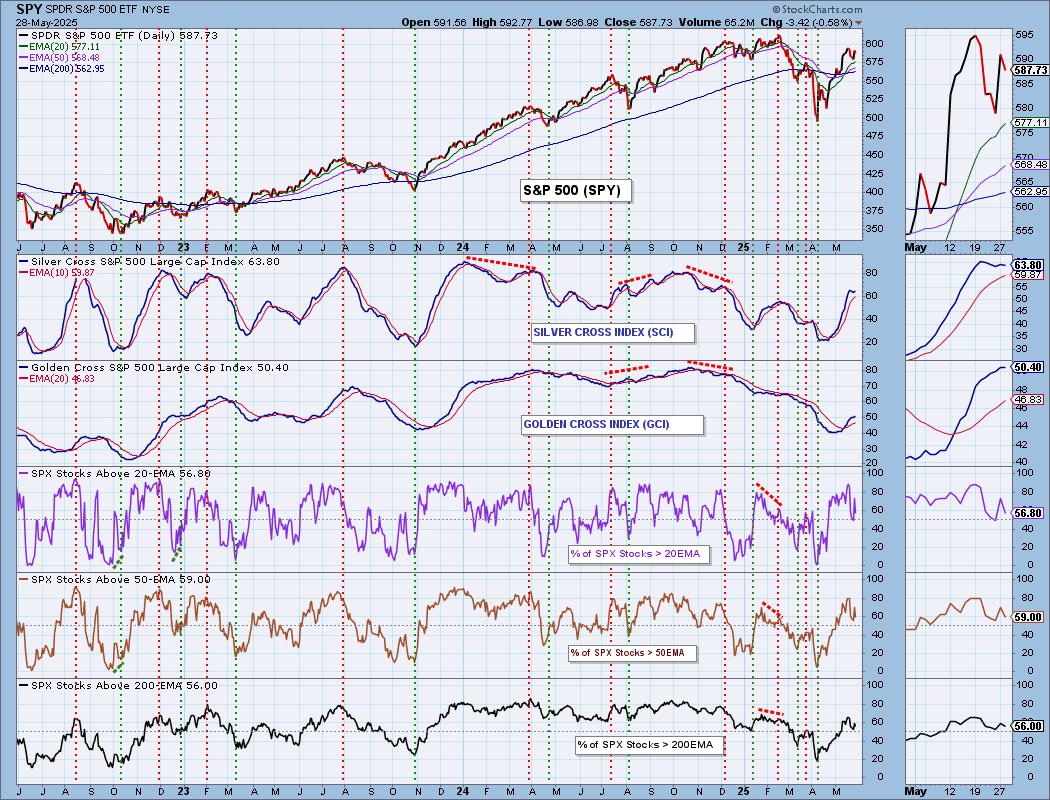
PARTICIPATION CHART (S&P 500): The following chart objectively shows the depth and trend of participation for the SPX in two time frames.
- Intermediate-Term - the Silver Cross Index (SCI) shows the percentage of SPX stocks on IT Trend Model BUY signals (20-EMA > 50-EMA). The opposite of the Silver Cross is a "Dark Cross" -- those stocks are, at the very least, in a correction.
- Long-Term - the Golden Cross Index (GCI) shows the percentage of SPX stocks on LT Trend Model BUY signals (50-EMA > 200-EMA). The opposite of a Golden Cross is the "Death Cross" -- those stocks are in a bear market.
The market bias is BULLISH in the intermediate and long terms.
Participation was hit fairly hard with today's decline which wasn't all that deep. All three indicators pushed downward. These second tops set up declining trends on participation. The Silver Cross Index is back to declining. It remains above its signal line for now so the IT Bias is BULLISH. It's hard to see, but the Golden Cross Index topped today as well. It hasn't made up much ground and is at a mediocre reading of 50%. It is still above its signal line so the LT Bias is BULLISH.
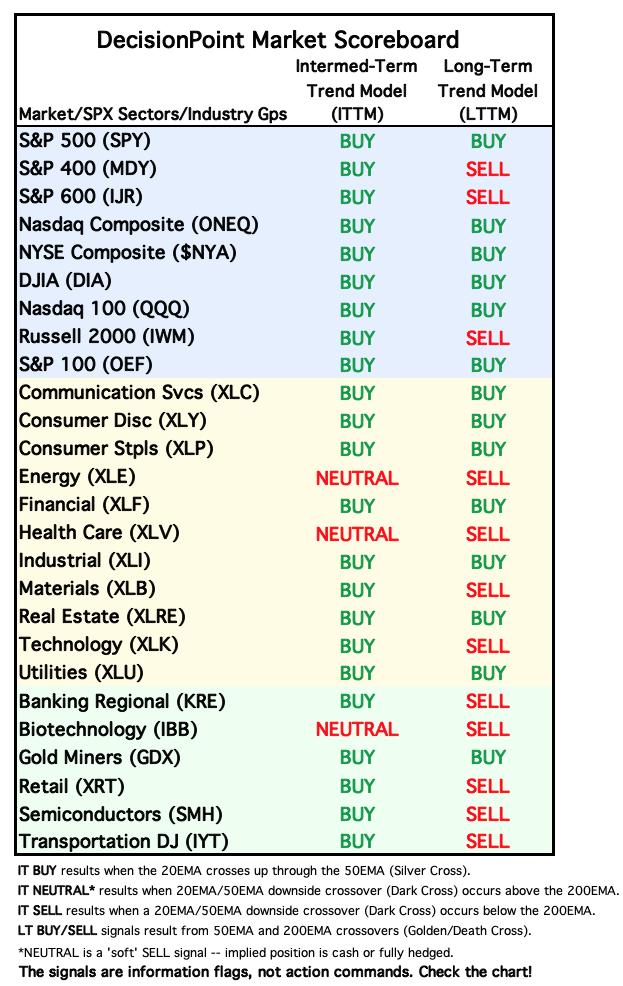
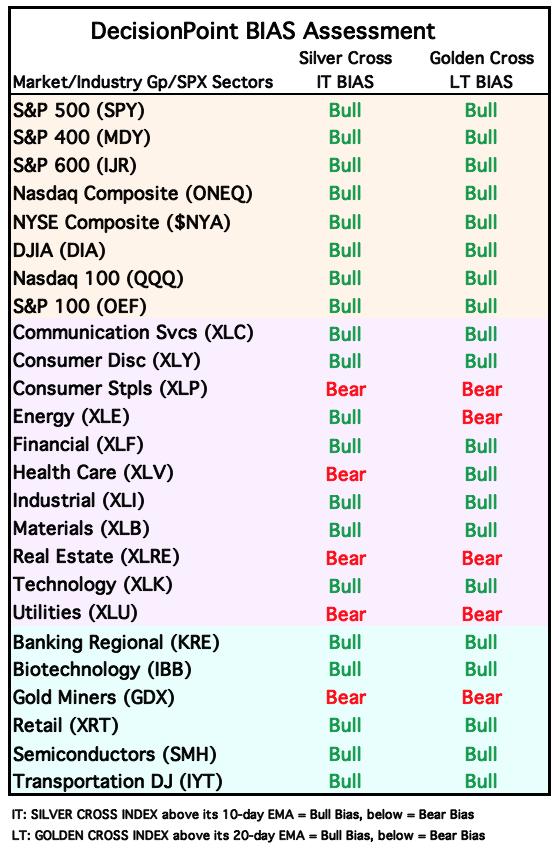
BIAS Assessment: The following table expresses the current BIAS of various price indexes based upon the relationship of the Silver Cross Index to its 10-day EMA (intermediate-term), and of the Golden Cross Index to its 20-day EMA (long-term). When the Index is above the EMA it is bullish, and it is bearish when the Index is below the EMA. The BIAS does not imply that any particular action should be taken. It is information to be used in the decision process.
The items with highlighted borders indicate that the BIAS changed today.
*****************************************************************************************************
CONCLUSION: Yesterday's upside initiation climax failed to produce and today we have a downside initiation climax. It wasn't a confirmed climax as Total Volume was well below average indicating a lack of conviction in this decline. This climax may also fail. STOs are back in decline alongside already falling ITBM/ITVM. We don't like this setup. The loss of rising PMOs and big losses to participation suggest weakness. The Bias Table is likely to start flipping bearish soon. The ITBM/ITVM do have us concerned about the intermediate term. The PMO and Stochastics are still rising, but we think the market is vulnerable right now. Although, NVDA could push the market higher should after-hours trading translate to tomorrow's trading.
Erin is 65% long, 0% short. (This is intended as information, not a recommendation.)
*****************************************************************************************************
CALENDAR

BITCOIN
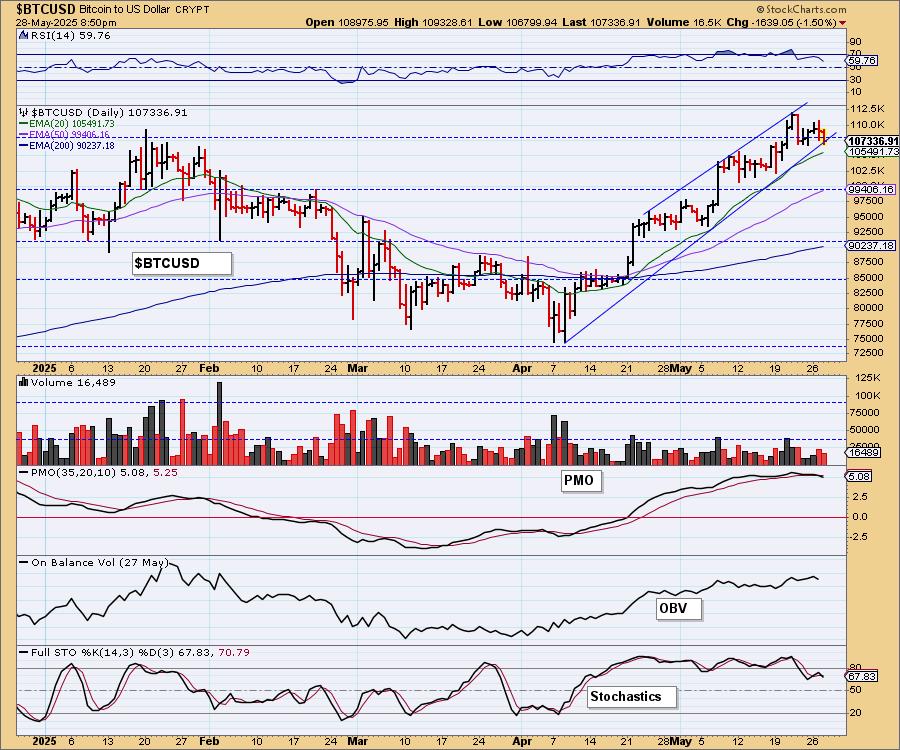
Bitcoin nearly broke below the bearish rising wedge. We do expect that to happen soon as the rally has gotten rather heated. We now have a new PMO Crossover SELL Signal and Stochastics have topped. Look for a breakdown with a potential trip down to 100,000.
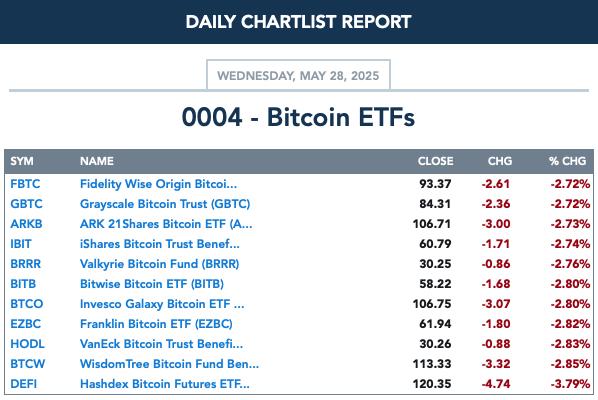
BITCOIN ETFs
INTEREST RATES
Yields reversed course today and rose. We still like the rising trends and think that could keep them elevated. Resistance has been met by most yields at 2025 highs so we should look for a potential top.
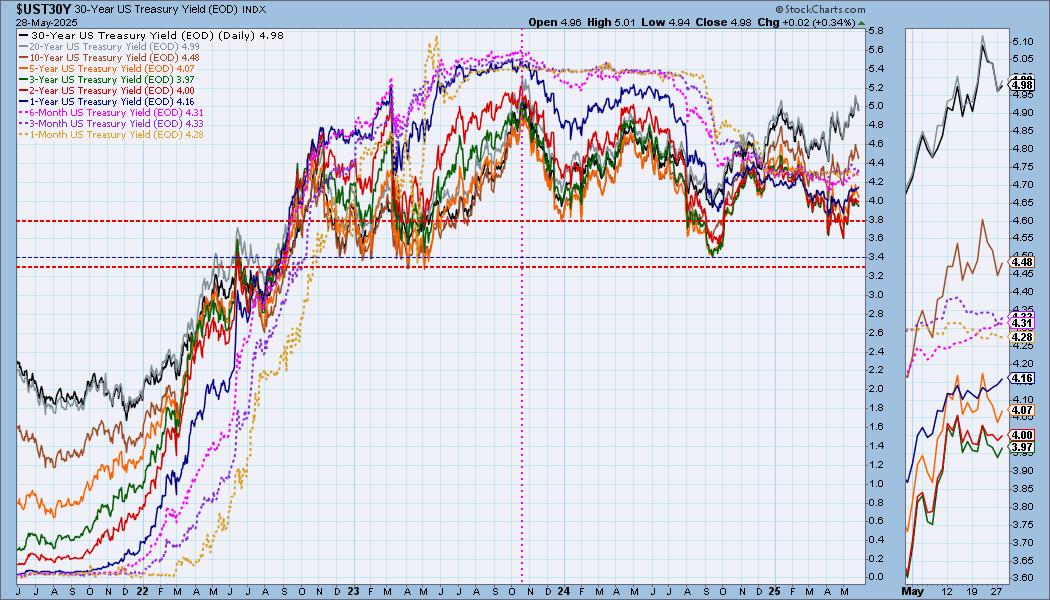
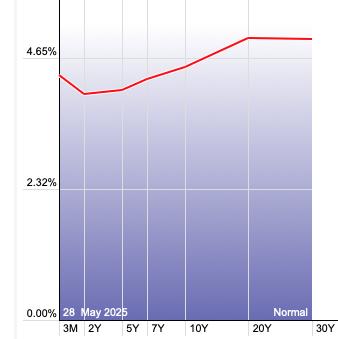
The Yield Curve Chart from StockCharts.com shows us the inversions taking place. The red line should move higher from left to right. Inversions are occurring where it moves downward.
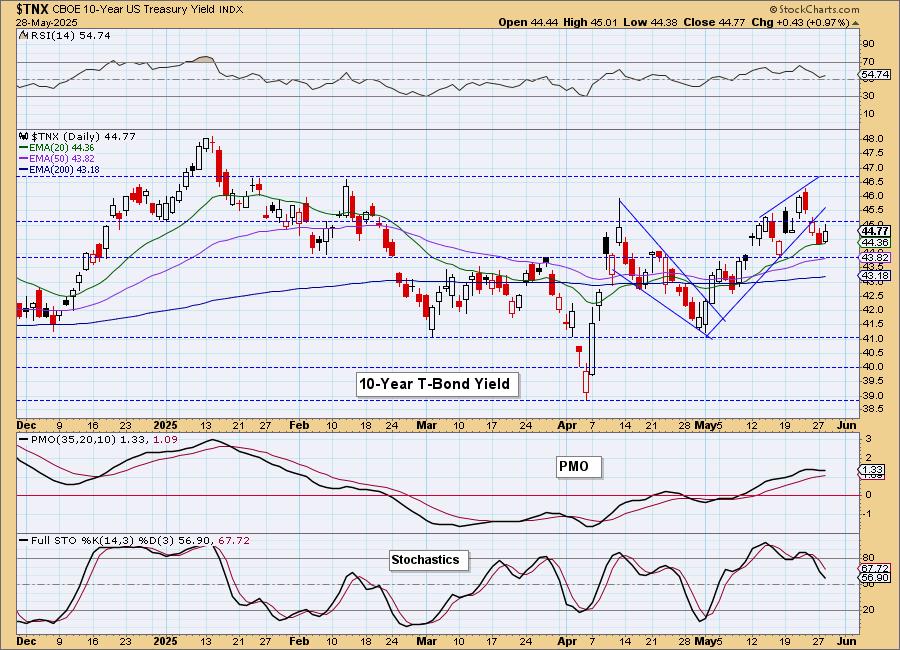
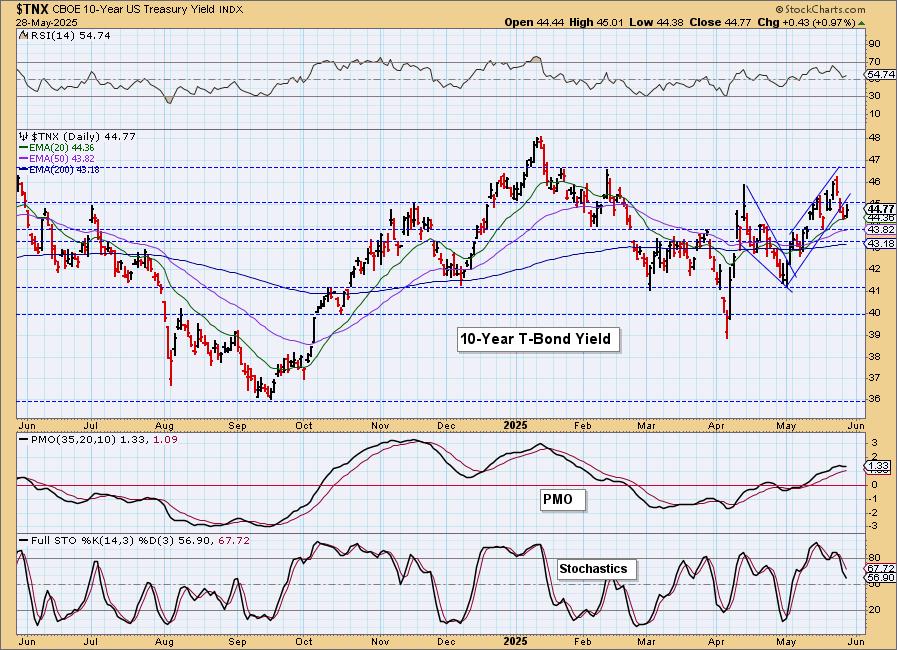
10-YEAR T-BOND YIELD
After breaking down out of the bearish rising wedge as expected, $TNX is holding above the 20-day EMA. The PMO isn't particularly helpful as it does look like it wants to rise. Stochastics, however tell us to look for more downside.
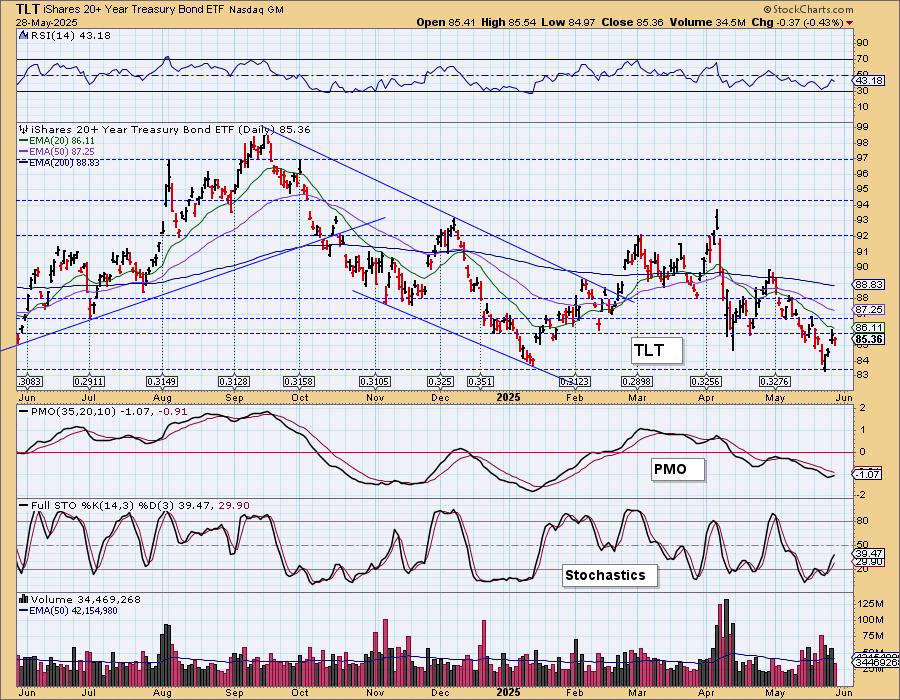
BONDS (TLT)
IT Trend Model: SELL as of 4/14/2025
LT Trend Model: SELL as of 12/13/2024
TLT Daily Chart: Price has technically broken out of a declining trend channel, but it doesn't look particularly bullish. Stochastics are rising again and the PMO is also rising right now so we'll look for higher prices in the short term.
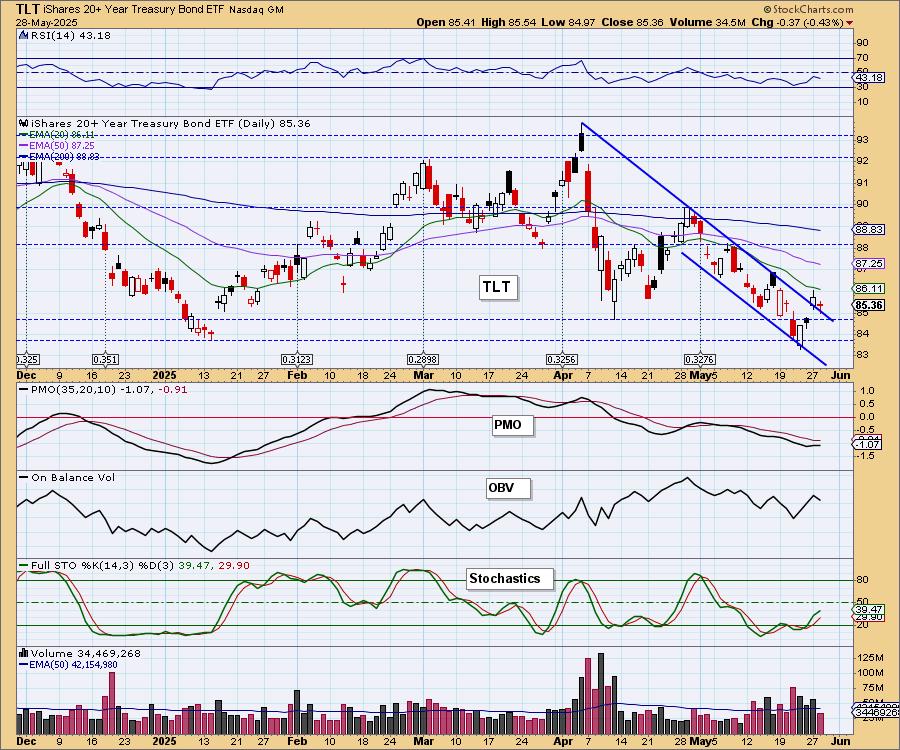
This is a strong area of support so we should get some follow-through on this bounce.
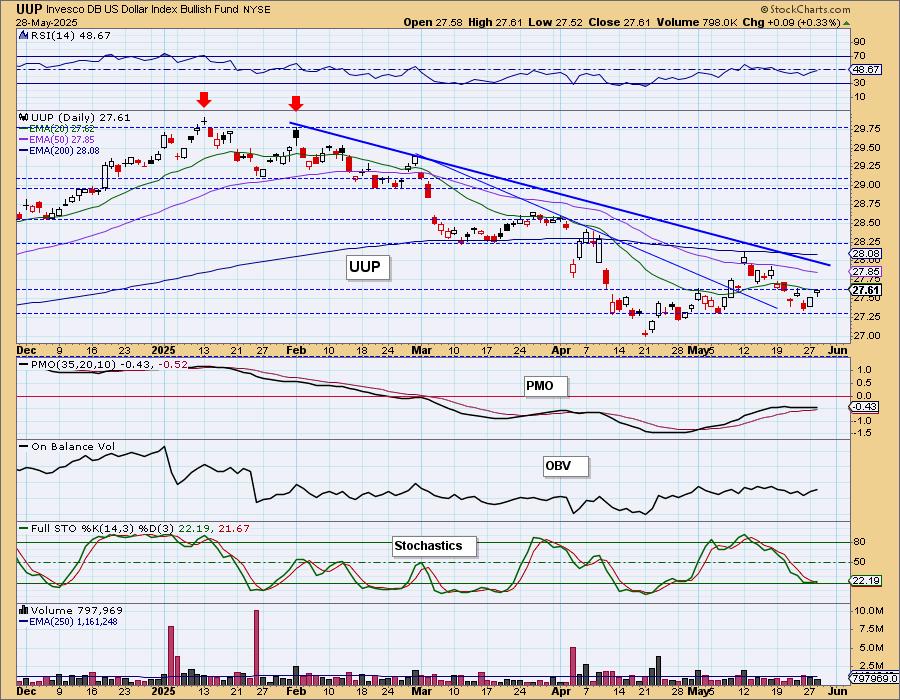
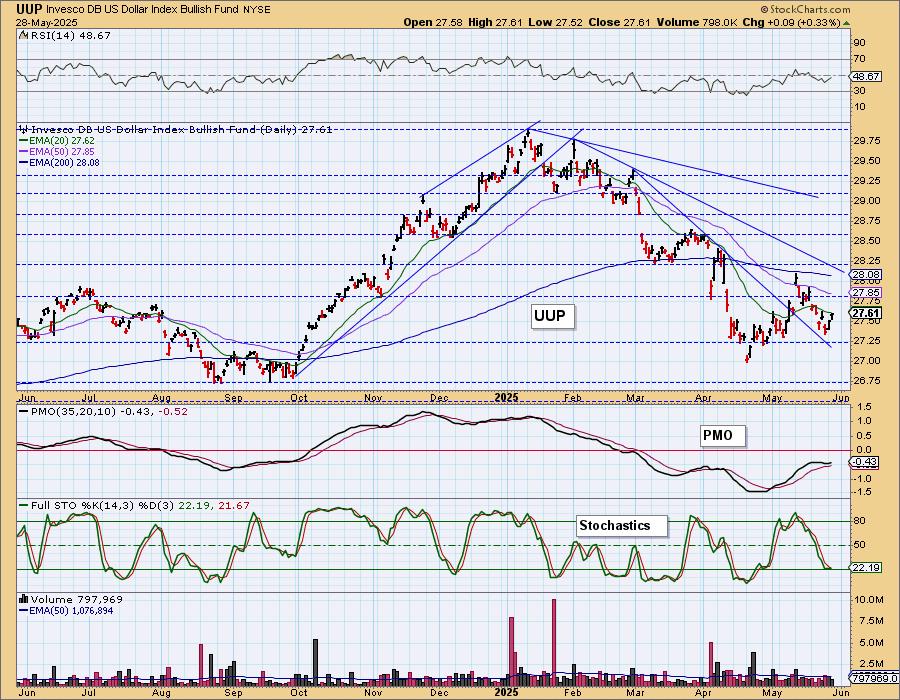
DOLLAR (UUP)
IT Trend Model: NEUTRAL as of 3/5/2025
LT Trend Model: SELL as of 4/25/2025
UUP Daily Chart: The Dollar rallied and has nearly broken from the short-term declining trend out of the May high. It still doesn't look that bullish to us given the longer-term declining tops trendline. The PMO is flat. Stochastics are in deeply negative territory so we don't see much internal strength here. Maybe we'll see some sideways movement.
GOLD
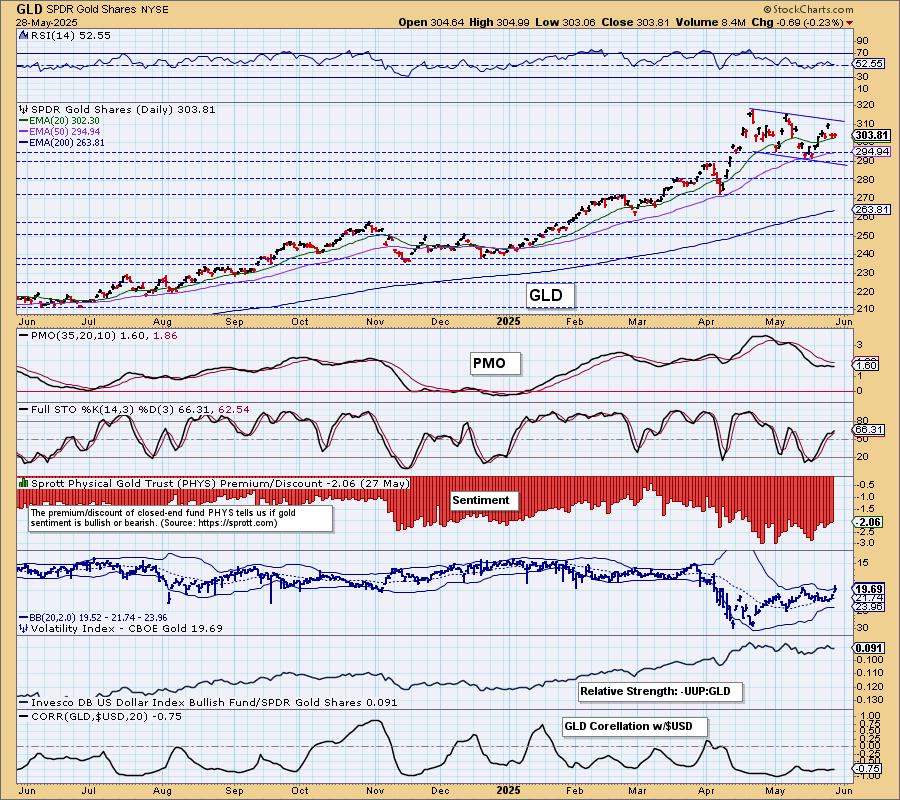
IT Trend Model: BUY as of 1/10/2025
LT Trend Model: BUY as of 10/20/2023
GLD Daily Chart: The bull flag on Gold may stick around a bit longer with a possible drop down to the bottom of the channel. We are still thinking it will rally given rising Stochastics. It was not down as far as the Dollar was up so we did see some buying here.
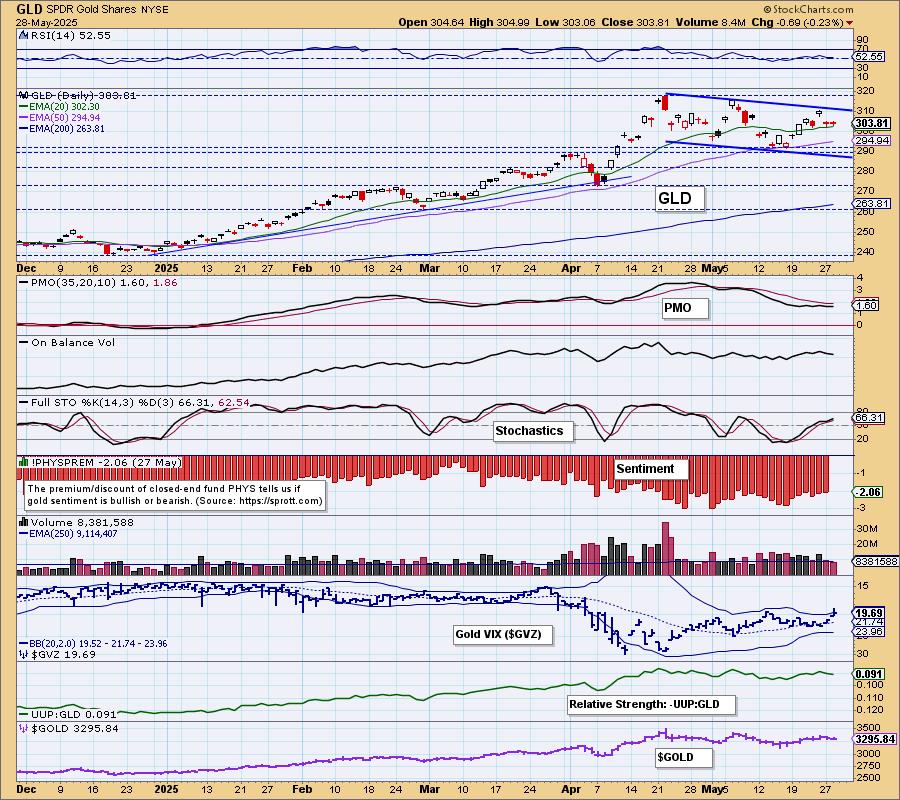
The correlation with the Dollar is very negative. The Dollar looks neutral to us and that could mean sideways movement for Gold. Ultimately we still like Gold.
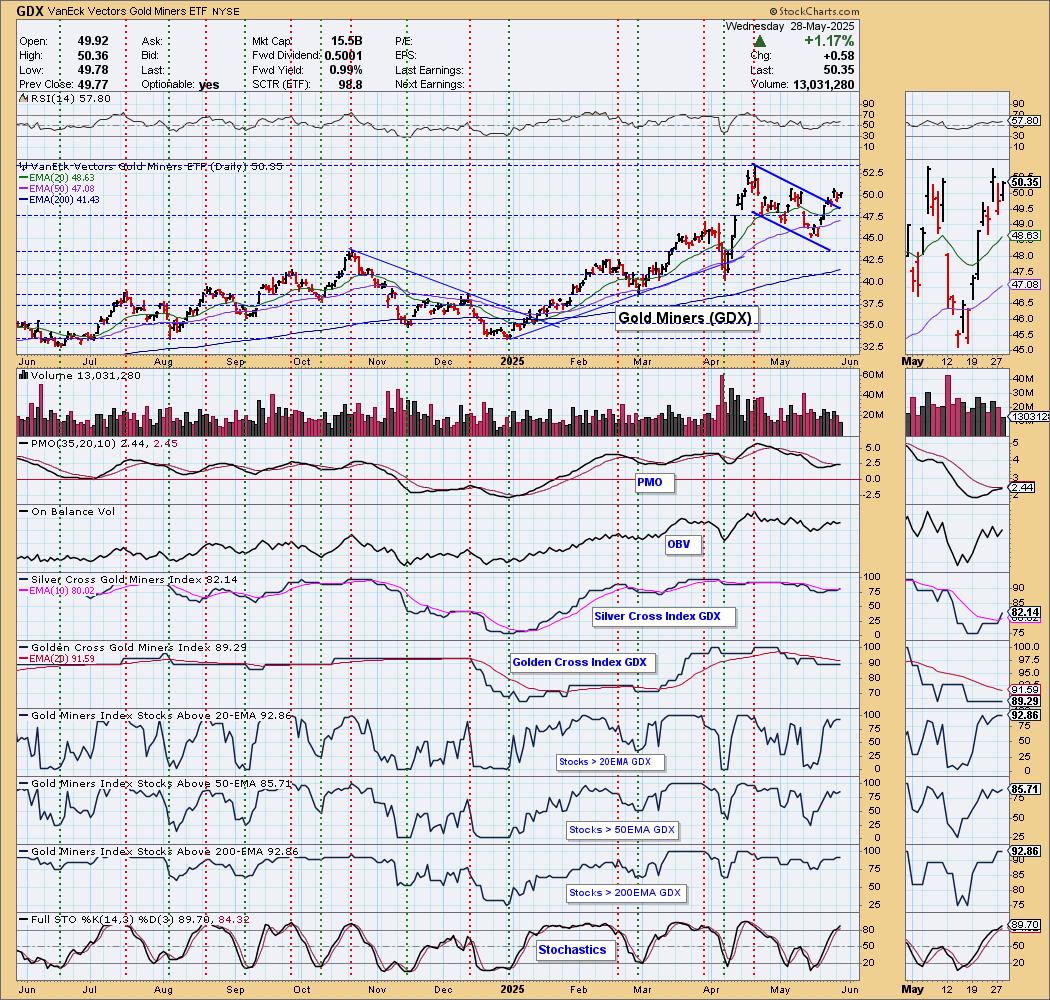
GOLD MINERS (GDX) Daily Chart: Gold Miners are showing strength. Yesterday they didn't drop as far as Gold did and today they rallied despite Gold being down on the day. Participation is incredibly strong and the Silver Cross Index looks particularly bullish after a Bullish Shift across the signal line. Look for more upside out of Gold Miners.
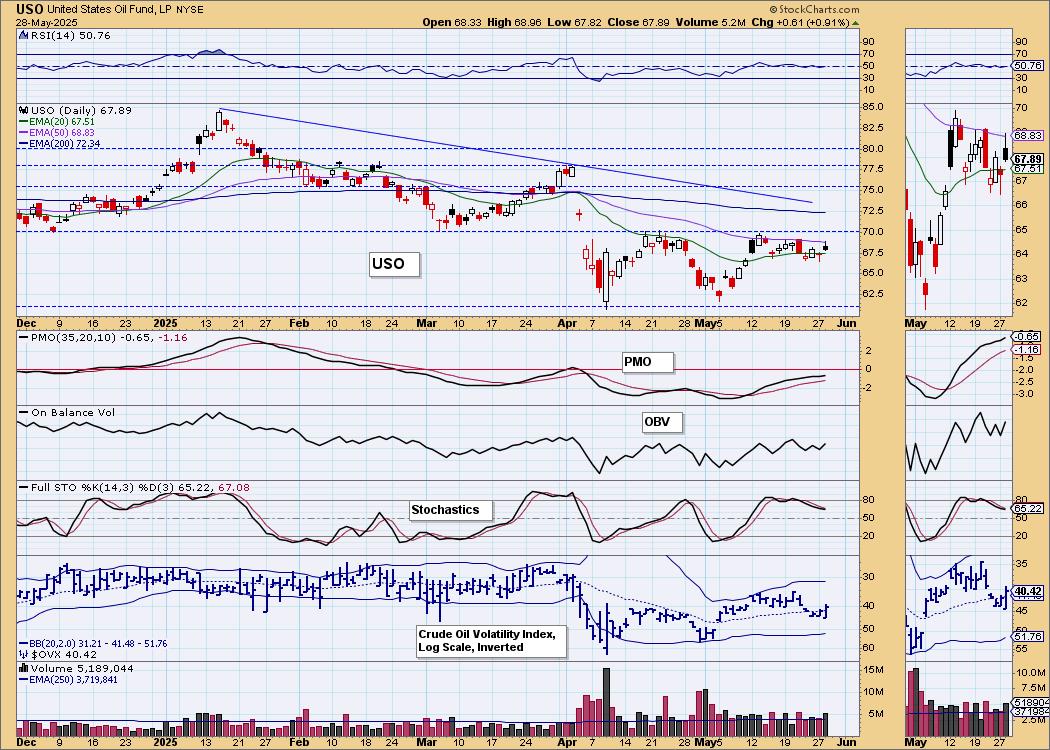
CRUDE OIL (USO)
IT Trend Model: NEUTRAL as of 2/27/2025
LT Trend Model: SELL as of 3/18/2025
USO Daily Chart: Crude had a nice rally today, but it is still stuck beneath resistance. We think that will continue. We are monitoring what could be a bull flag on the chart, but with Stochastics falling we aren't looking for a breakout yet. There is the backdrop of possibly more sanctions on Russia and Iran and that could get an upside breakout from the flag.
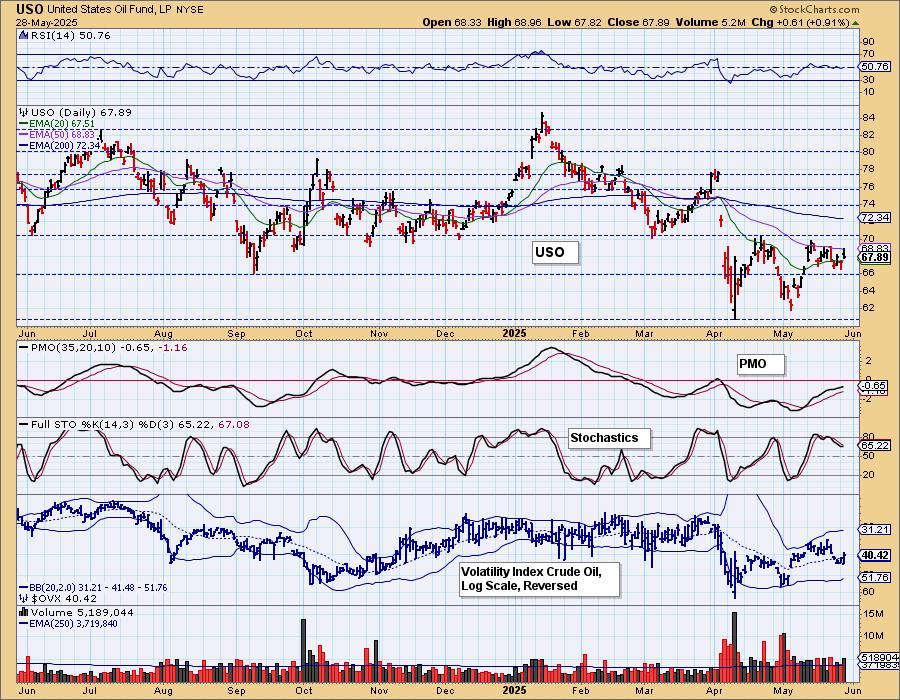
The bull flag is pretty obvious on the 1-year daily chart. It certainly could prevail, but the PMO has been rising awhile and we haven't seen any positive price movement out of it.
Good Luck & Good Trading!
Erin Swenlin and Carl Swenlin
Technical Analysis is a windsock, not a crystal ball. --Carl Swenlin
(c) Copyright 2025 DecisionPoint.com
Disclaimer: This blog is for educational purposes only and should not be construed as financial advice. The ideas and strategies should never be used without first assessing your own personal and financial situation, or without consulting a financial professional. Any opinions expressed herein are solely those of the author, and do not in any way represent the views or opinions of any other person or entity.
DecisionPoint is not a registered investment advisor. Investment and trading decisions are solely your responsibility. DecisionPoint newsletters, blogs or website materials should NOT be interpreted as a recommendation or solicitation to buy or sell any security or to take any specific action.
NOTE: The signal status reported herein is based upon mechanical trading model signals, specifically, the DecisionPoint Trend Model. They define the implied bias of the price index based upon moving average relationships, but they do not necessarily call for a specific action. They are information flags that should prompt chart review. Further, they do not call for continuous buying or selling during the life of the signal. For example, a BUY signal will probably (but not necessarily) return the best results if action is taken soon after the signal is generated. Additional opportunities for buying may be found as price zigzags higher, but the trader must look for optimum entry points. Conversely, exit points to preserve gains (or minimize losses) may be evident before the model mechanically closes the signal.
Helpful DecisionPoint Links:
DecisionPoint Alert Chart List
DecisionPoint Golden Cross/Silver Cross Index Chart List
DecisionPoint Sector Chart List
Price Momentum Oscillator (PMO)