
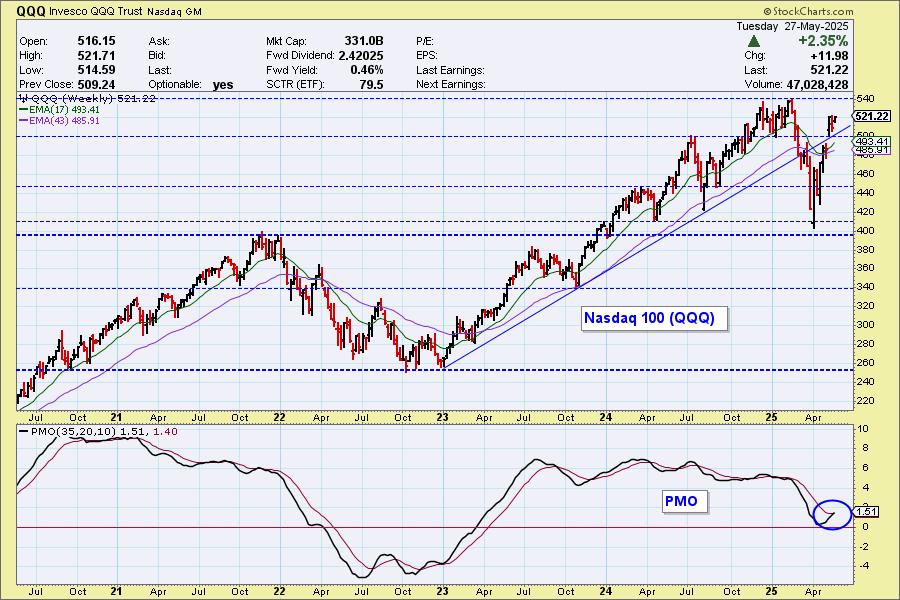
Today we got notice that the Nasdaq 100 (QQQ) had triggered an Intermediate-Term PMO BUY Signal. The signal won't be official until it goes "final" after the close on Friday. The SPY is getting close but we don't have it yet.
We have a bullish "V" Bottom formation that does imply a breakout ahead to new all-time highs. The rising trend has been recaptured. There is a slight chance that this could turn into a reverse island formation given the recent gap up, but so far it looks benign.
The DecisionPoint Alert Weekly Wrap presents an end-of-week assessment of the trend and condition of the Stock Market, the U.S. Dollar, Gold, Crude Oil, and Bonds. The DecisionPoint Alert daily report (Monday through Thursday) is abbreviated and gives updates on the Weekly Wrap assessments.
MARKET/INDUSTRY GROUP/SECTOR INDEXES
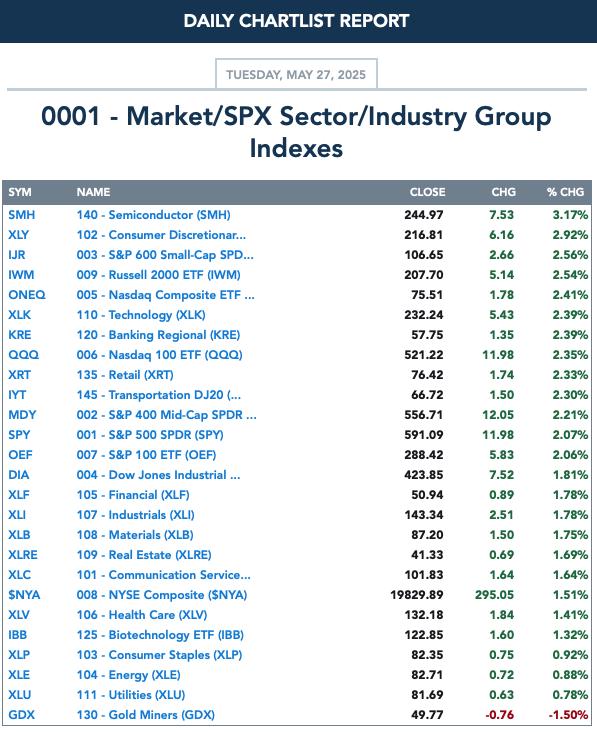
CLICK HERE for Carl's annotated Market Index, Sector, and Industry Group charts.
THE MARKET (S&P 500)
IT Trend Model: NEUTRAL as of 3/4/2025
LT Trend Model: SELL as of 4/16/2025
SPY 10-Minute Chart: Price gapped up on the open. There does appear to be an erroneous bar in there. Price steadily rose and then consolidated to finish the day. We did see a nice thrust higher in the last ten minutes of trading. The 10-minute PMO is turning back up so we could see some follow-through tomorrow.
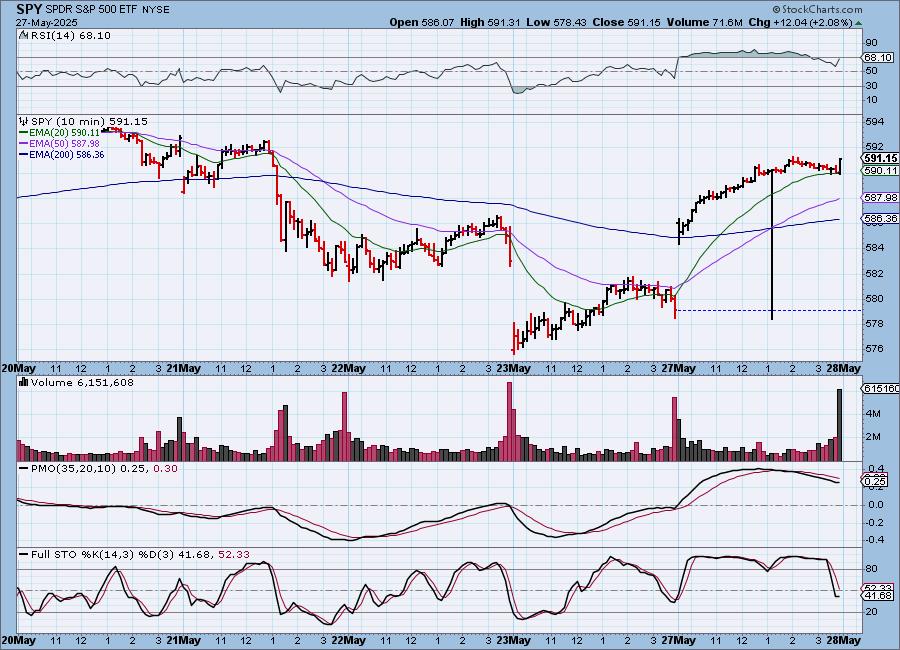
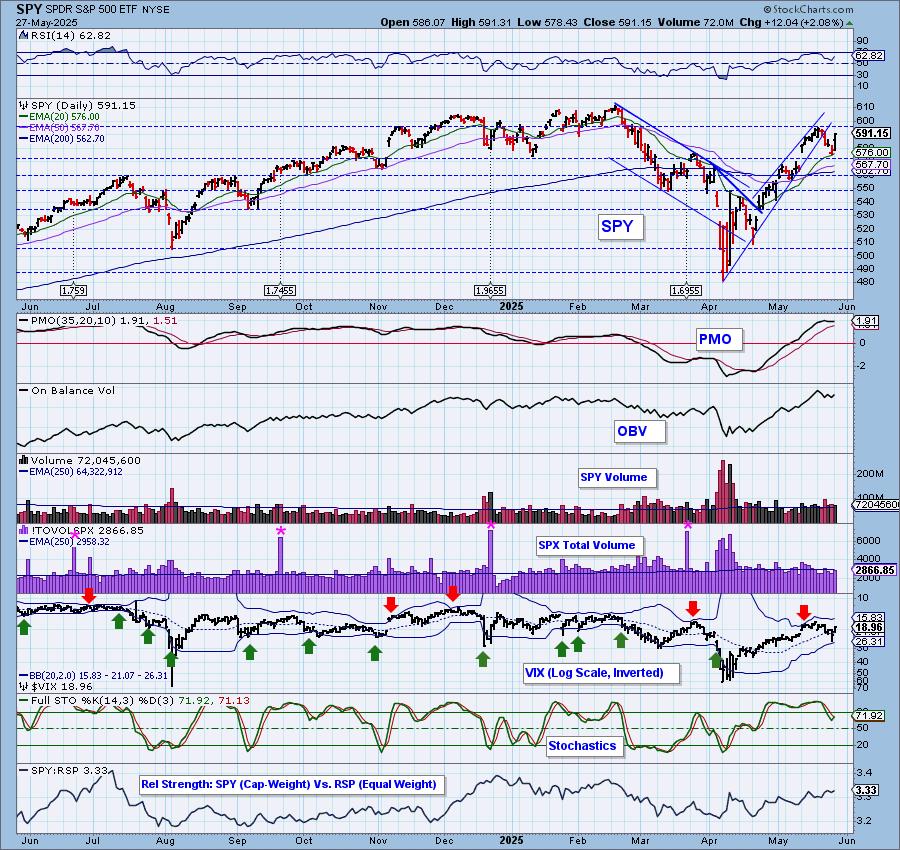
SPY Daily Chart: Price had dropped below support on Friday but did close right on it. Today saw a nice bounce off that support level. We checked and the PMO did turn back up today for a 'surge' above the signal line. The RSI is not overbought so we could certainly see more upside.
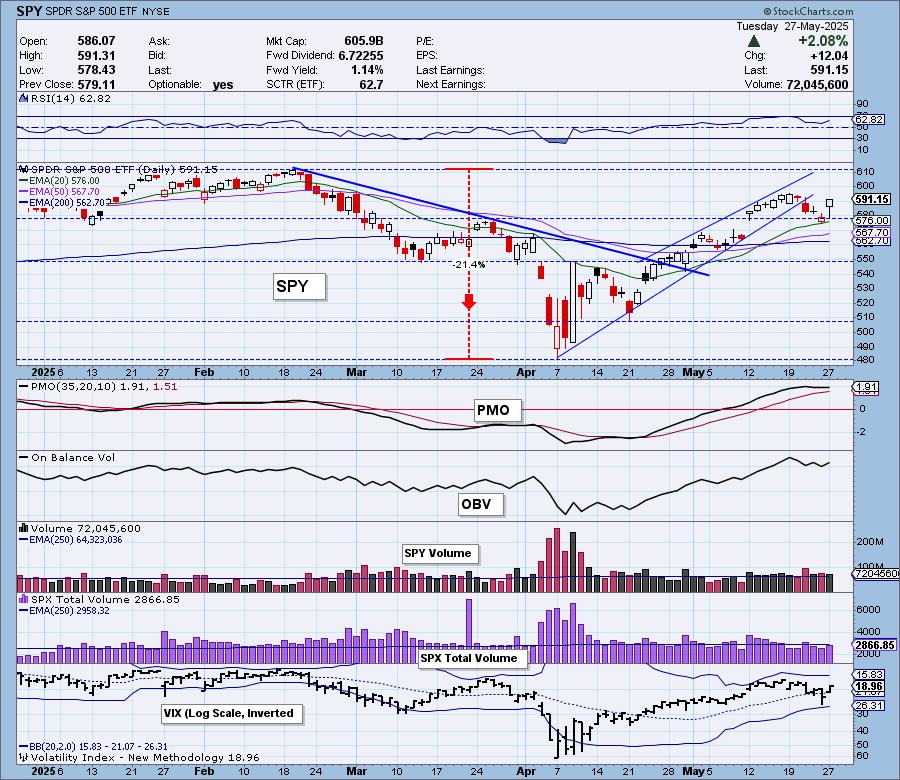
This could be a bull flag formation on the daily chart with the ascending wedge forming the flag pole. The VIX is back above its moving average which is bullish for the market. We also see that Stochastics have turned back up.
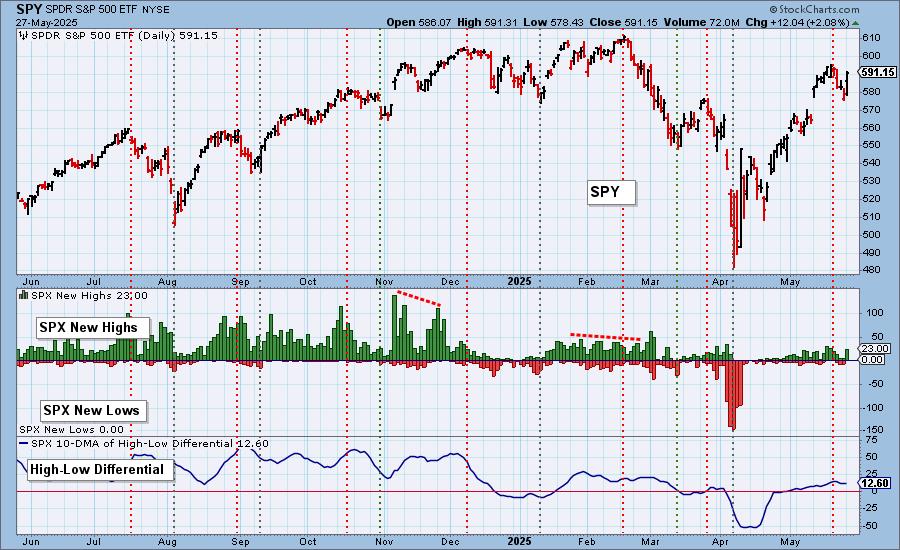
S&P 500 New 52-Week Highs/Lows: New Highs popped on today's rally and we didn't see any New Lows. The High-Low Differential has turned back up.
Climax* Analysis: There were unanimous climax readings on the four relevant indicators today, giving us an upside initiation climax. SPX Total Volume was rather light for a climax day and thus did not confirm.
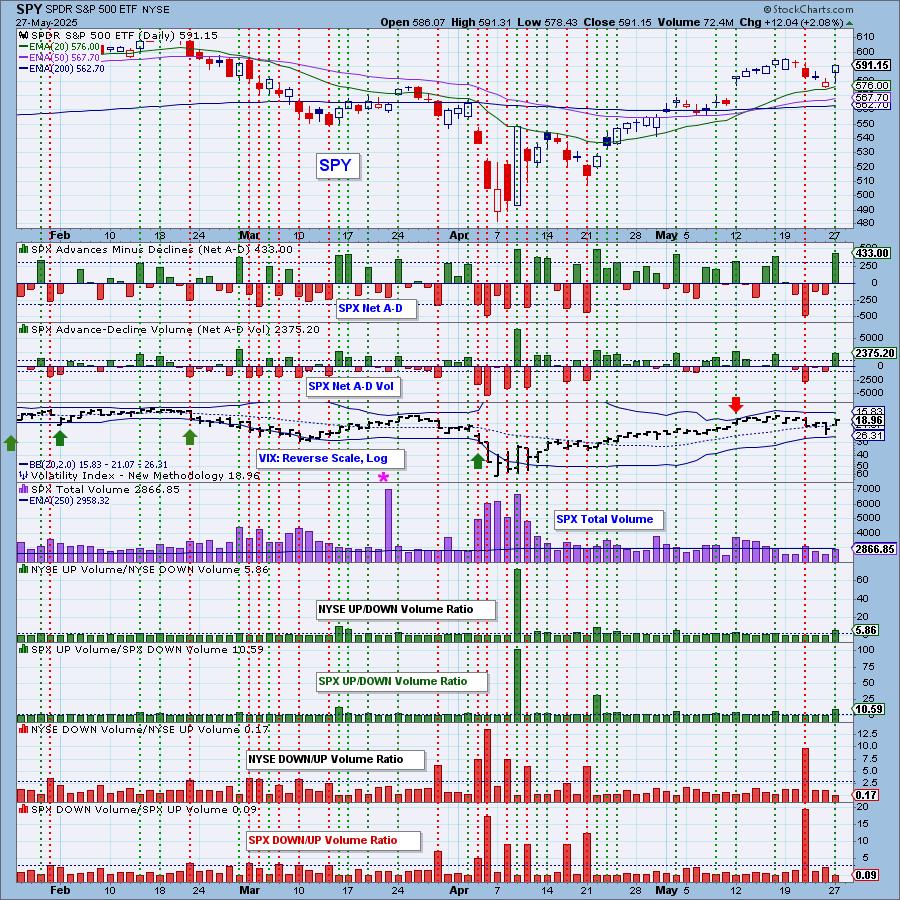
*A climax is a one-day event when market action generates very high readings in, primarily, breadth and volume indicators. We also include the VIX, watching for it to penetrate outside the Bollinger Band envelope. The vertical dotted lines mark climax days -- red for downside climaxes, and green for upside. Climaxes are at their core exhaustion events; however, at price pivots they may be initiating a change of trend.
Short-Term Market Indicators: The short-term market trend is UP and the condition is SOMEWHAT OVERSOLD.
Swenlin Trading Oscillators (STOs) are in somewhat oversold territory. Today they bullishly turned back up, but they are in negative territory. Participation saw a nice jump and we saw a large number of new rising PMOs. Both of these indicators are reading above our bullish 50% threshold.
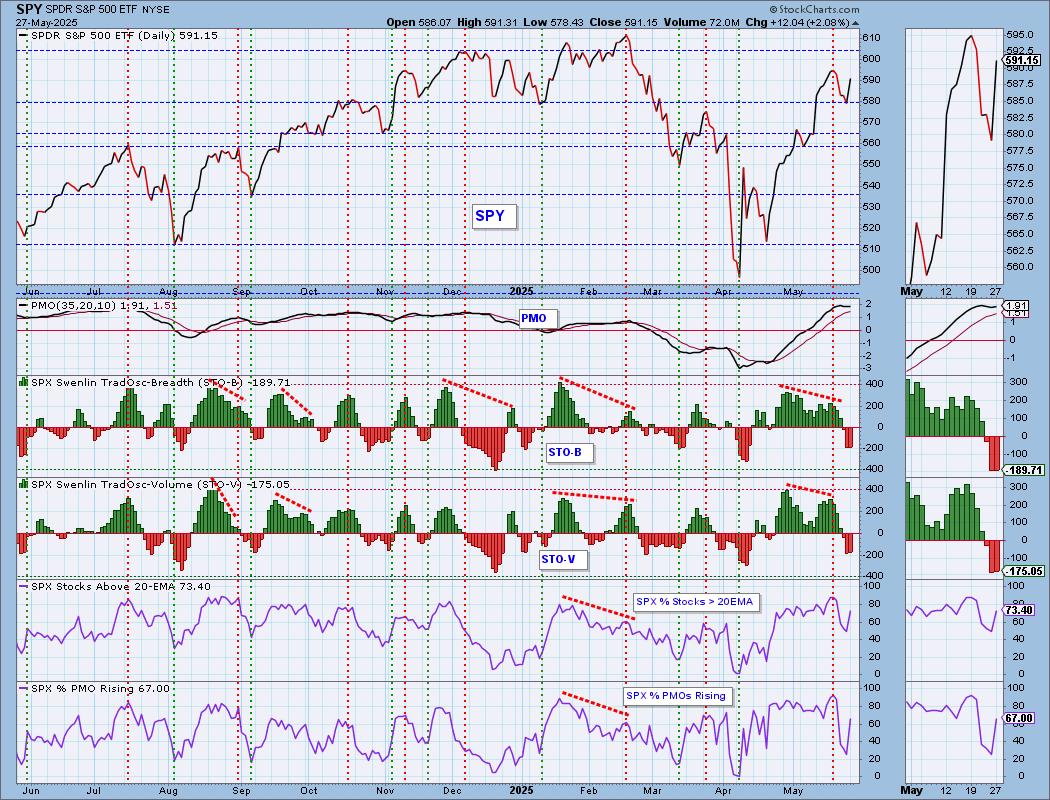
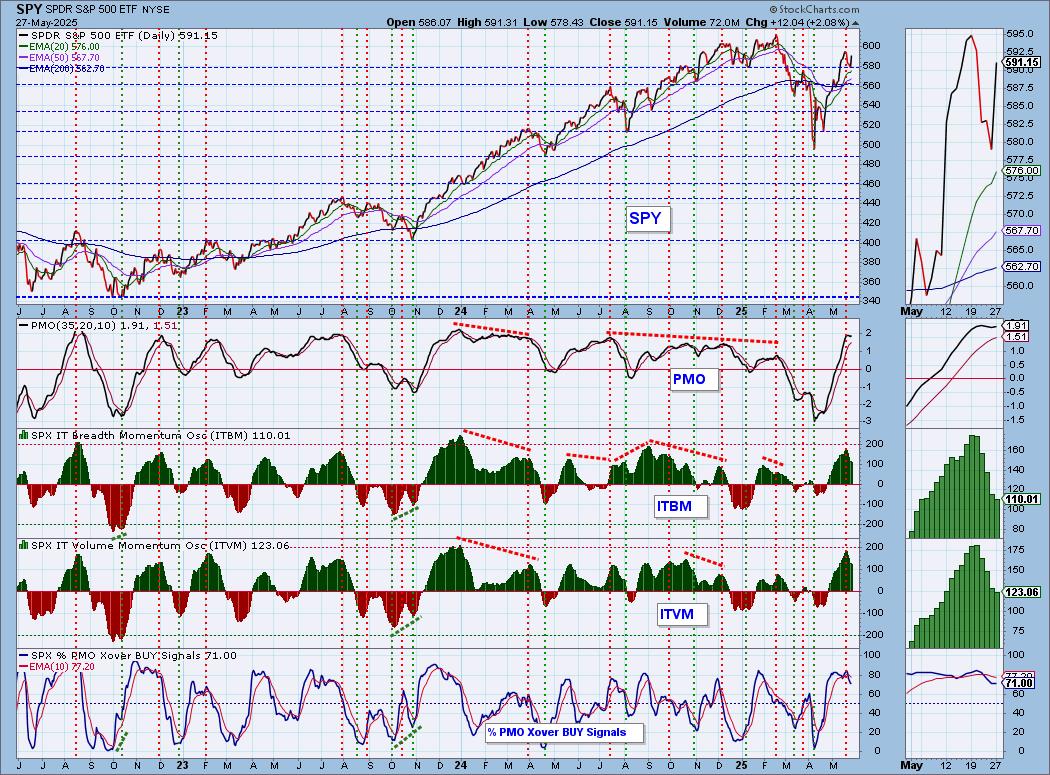
Intermediate-Term Market Indicators: The intermediate-term market trend is UP and the condition is OVERBOUGHT.
Unlike the STOs, the ITBM and ITVM are falling out of overbought territory. This doesn't bode well. We still have a healthy amount of PMO BUY Signals within the index.
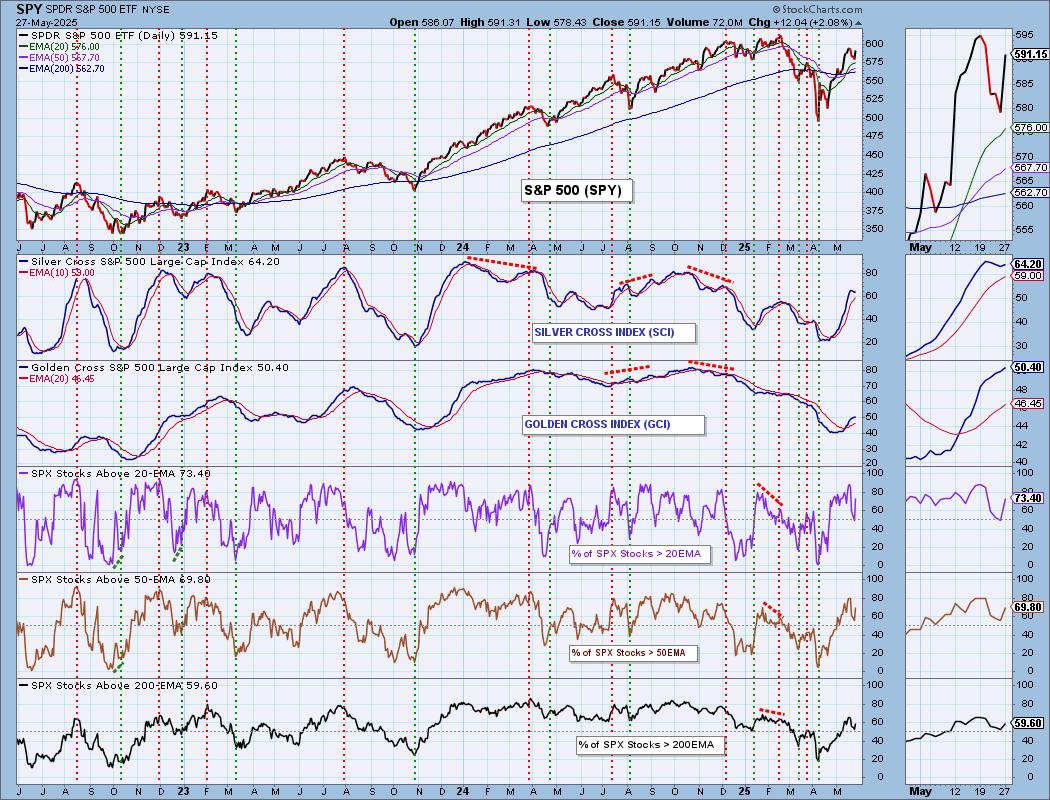
PARTICIPATION CHART (S&P 500): The following chart objectively shows the depth and trend of participation for the SPX in two time frames.
- Intermediate-Term - the Silver Cross Index (SCI) shows the percentage of SPX stocks on IT Trend Model BUY signals (20-EMA > 50-EMA). The opposite of the Silver Cross is a "Dark Cross" -- those stocks are, at the very least, in a correction.
- Long-Term - the Golden Cross Index (GCI) shows the percentage of SPX stocks on LT Trend Model BUY signals (50-EMA > 200-EMA). The opposite of a Golden Cross is the "Death Cross" -- those stocks are in a bear market.
The market bias is BULLISH in the intermediate and long terms.
Participation is healing, but is very close to overbought territory. The Silver Cross Index turned back up today. It is above its signal line still so the IT Bias is BULLISH. The Golden Cross Index is now above our bullish 50% threshold. It is holding above its signal line so the LT Bias is BULLISH.
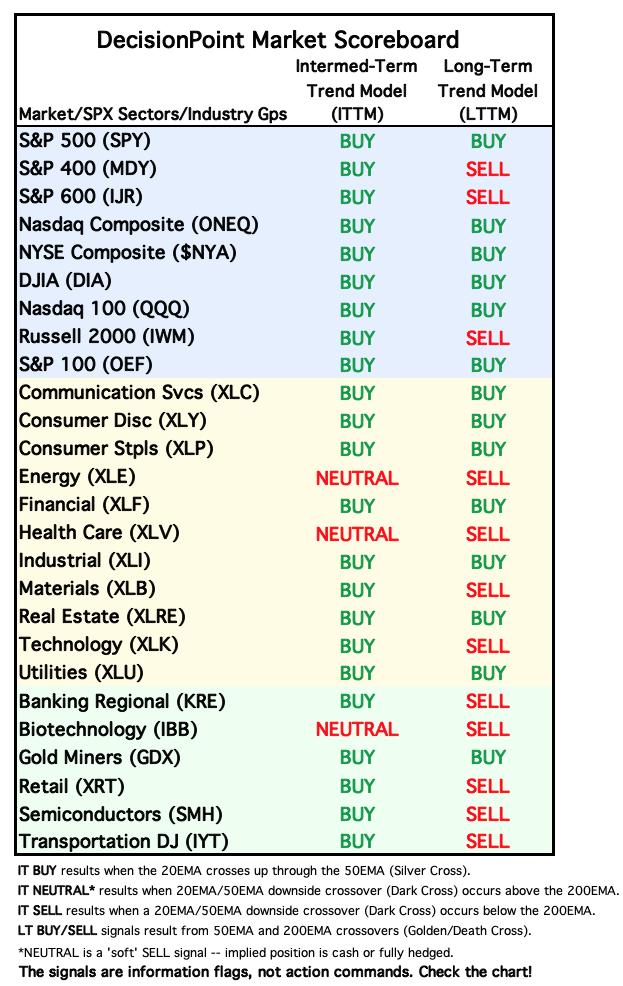
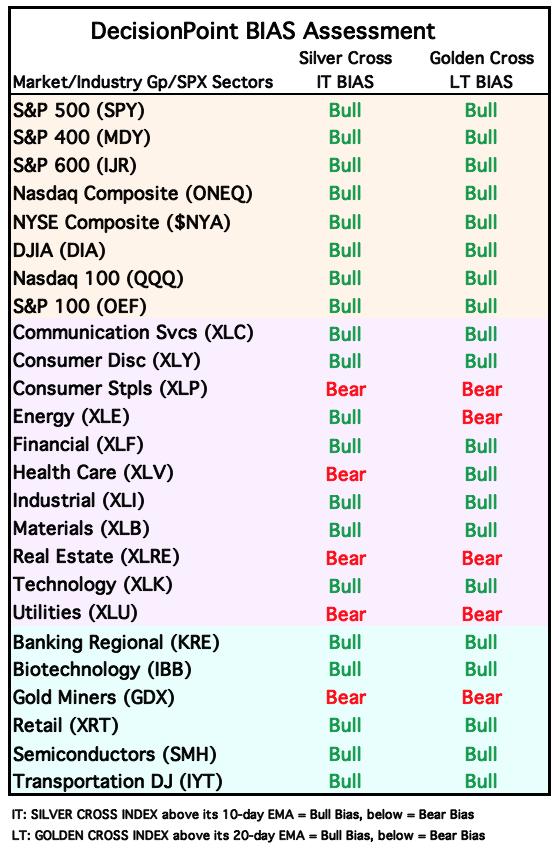
BIAS Assessment: The following table expresses the current BIAS of various price indexes based upon the relationship of the Silver Cross Index to its 10-day EMA (intermediate-term), and of the Golden Cross Index to its 20-day EMA (long-term). When the Index is above the EMA it is bullish, and it is bearish when the Index is below the EMA. The BIAS does not imply that any particular action should be taken. It is information to be used in the decision process.
The items with highlighted borders indicate that the BIAS changed today.
*****************************************************************************************************
CONCLUSION: We have some short-term bullish indications. The STOs turned back up today and we saw a large amount of participation reenter the market. The PMO has turned back up as did the High-Low Differential. We have an unconfirmed upside initiation climax. We didn't see a large amount of volume today so there was a lack of conviction on today's strong rally. Still, with short-term indicators improving and participation healing, we would expect a bit more upside here. The ITBM and ITVM are still falling out of overbought territory so we aren't so sure a rally will be lasting. Keep your stops in play.
Erin is 65% long, 0% short. (This is intended as information, not a recommendation.)
*****************************************************************************************************
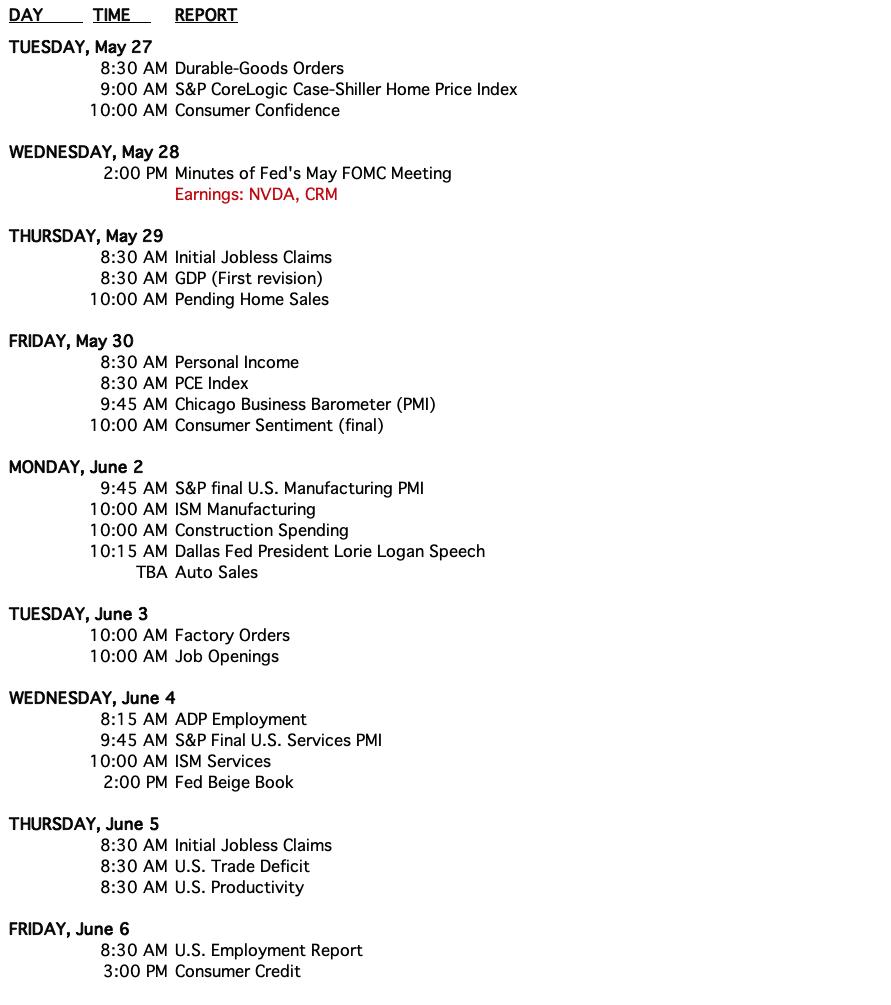
CALENDAR
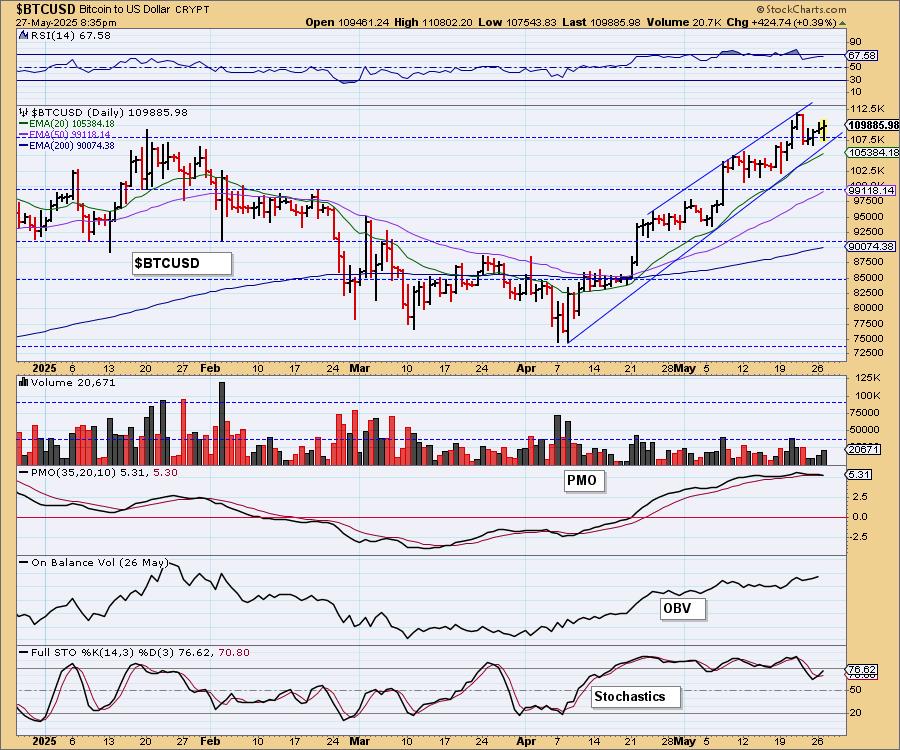
BITCOIN
Bitcoin looks very bullish in its strong rising trend. However, we now have a bearish rising wedge. These patterns call for a break of the rising trend. The PMO does look a bit toppy, but it is technically rising. The RSI isn't overbought yet, so we could see some more upside before we get the expected breakdown.
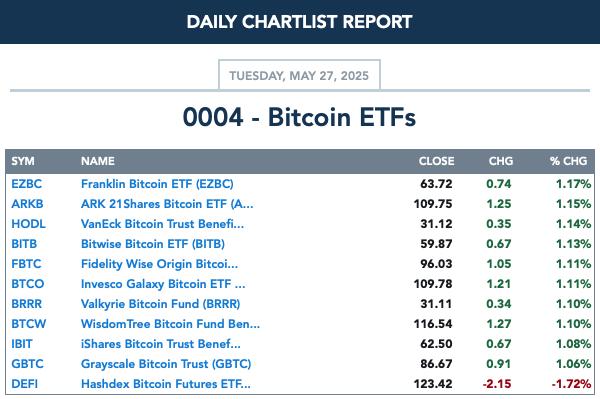
BITCOIN ETFs
INTEREST RATES
Yields pulled back quite a bit today. Long-term yields still look very bullish in their rising trends, but other yields do look toppy. Long-term rates could fall in sympathy with short-term rates.
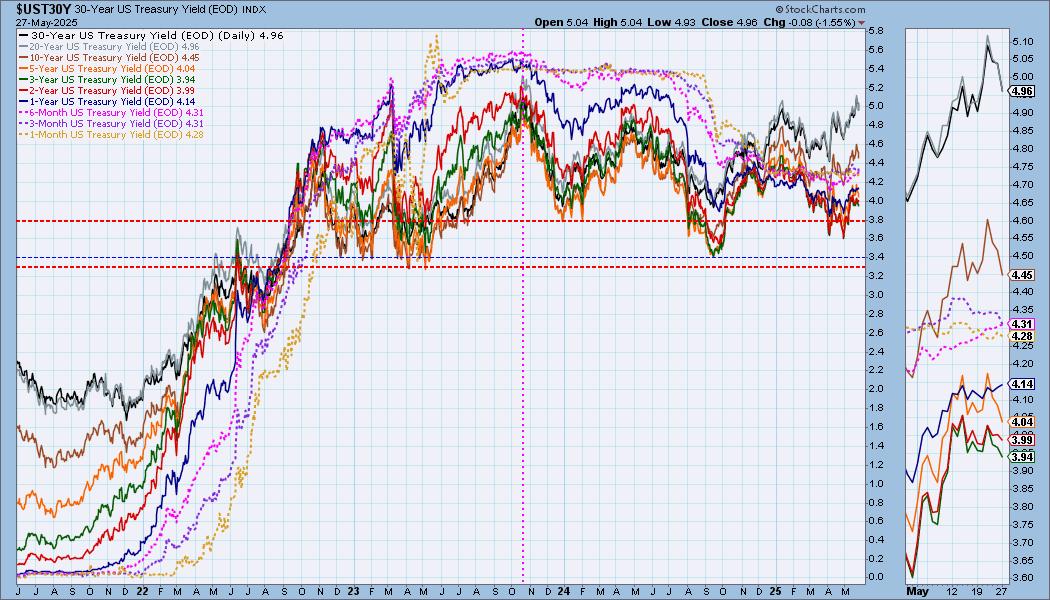
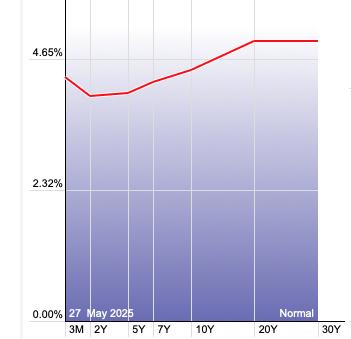
The Yield Curve Chart from StockCharts.com shows us the inversions taking place. The red line should move higher from left to right. Inversions are occurring where it moves downward.
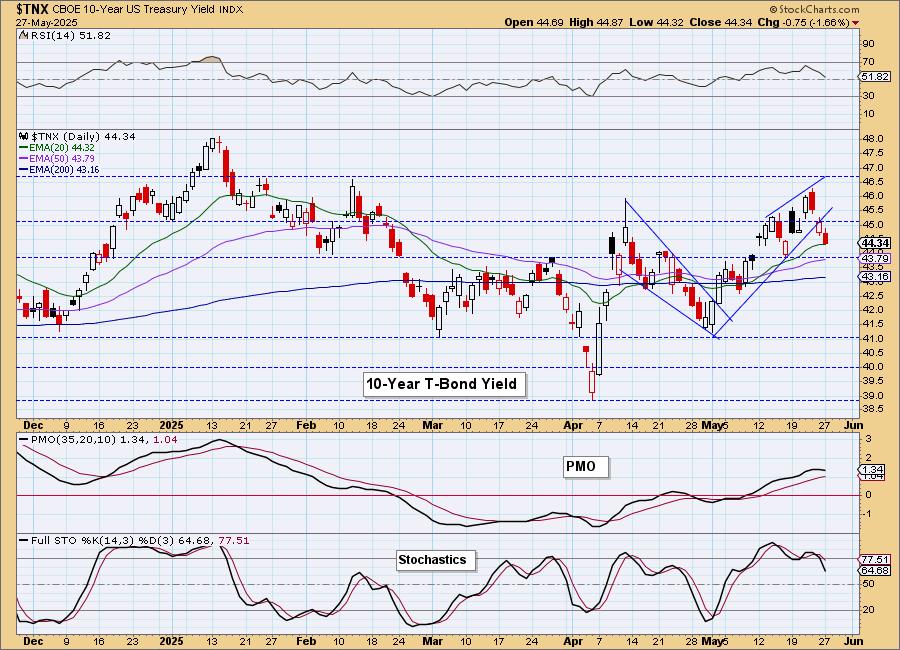
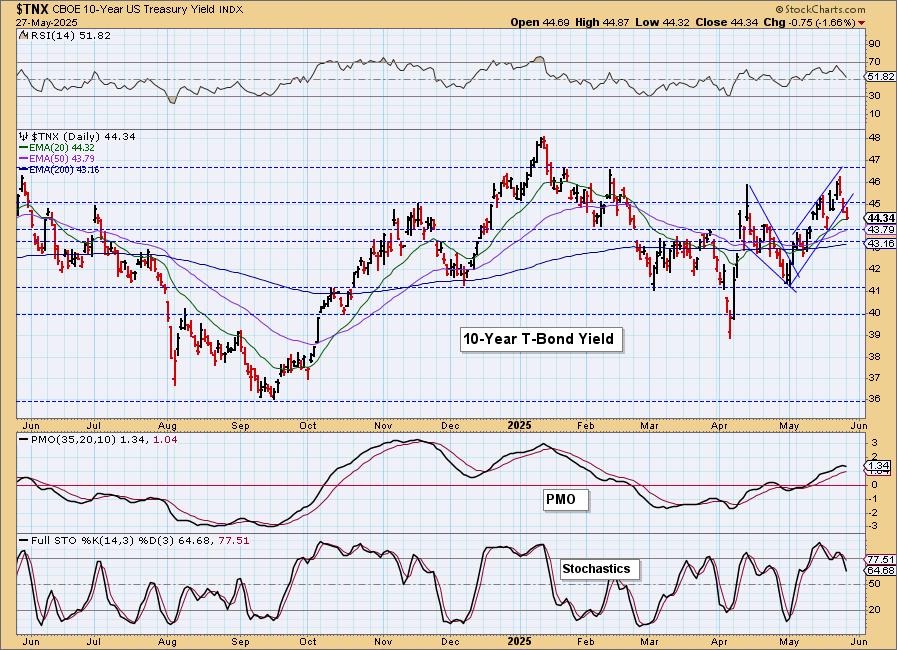
10-YEAR T-BOND YIELD
The bearish rising wedge was confirmed last Friday with a drop from the rising trend. Support is arriving, but the PMO has topped so we are preparing for more downside here. Stochastics also look bearish.
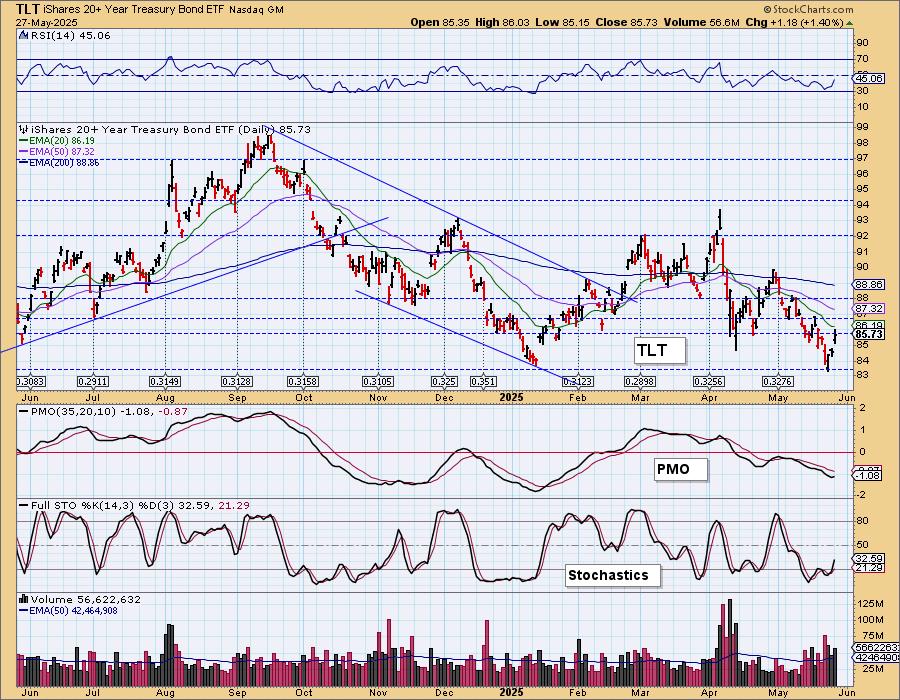
BONDS (TLT)
IT Trend Model: SELL as of 4/14/2025
LT Trend Model: SELL as of 12/13/2024
TLT Daily Chart: With yields starting to turn over, Bonds will be getting a lift. Price is now breaking from a declining trend channel. The PMO has turned back up and Stochastics are rising again. We think Bonds will get more upside as rates begin to soften.
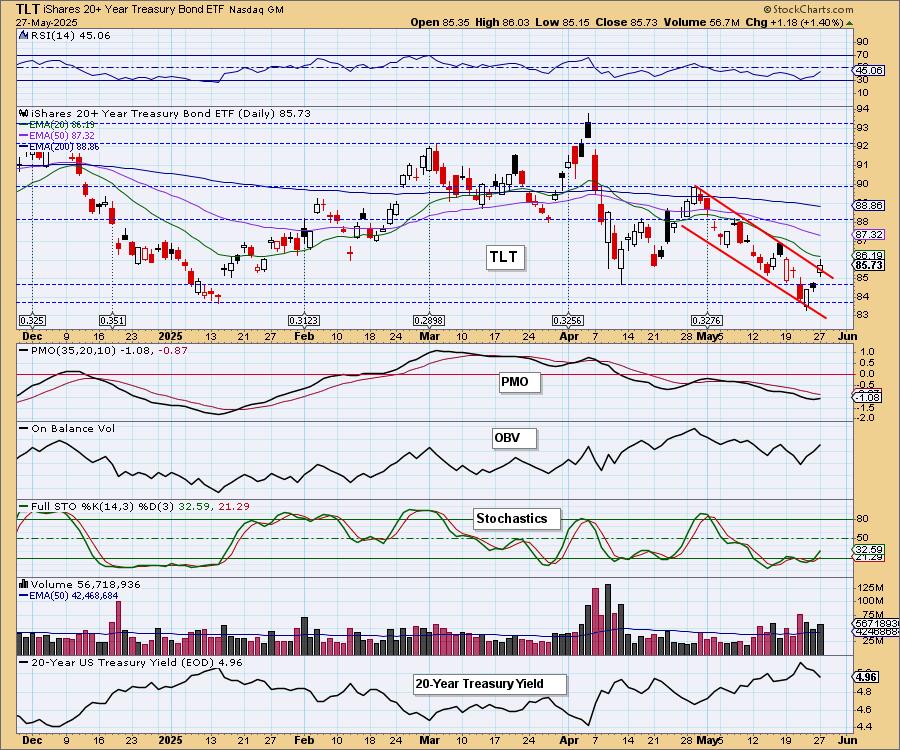
This is a strong area of support so we should get some follow-through on this bounce.
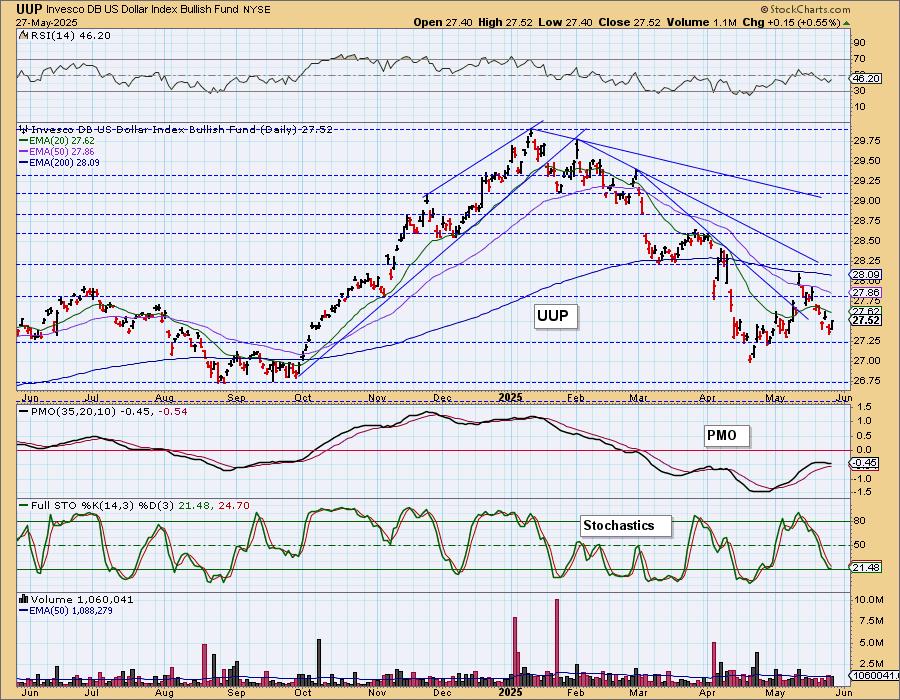
DOLLAR (UUP)
IT Trend Model: NEUTRAL as of 3/5/2025
LT Trend Model: SELL as of 4/25/2025
UUP Daily Chart: The Dollar had a good day, but remains in a declining trend in both the short and intermediate terms. The PMO topped below the zero line and while it is flattening, we are still feeling bearish about the Dollar. A break from the short-term declining trend would have us moving bullish. Right now it is drifting lower.
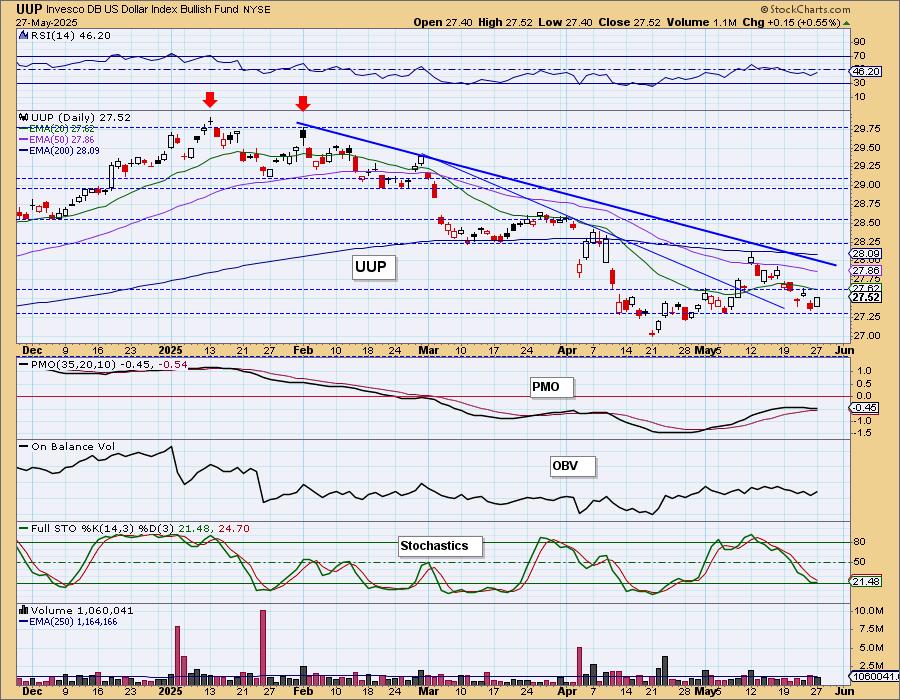
We do have an area of support for the Dollar arriving soon. That could be an area where we get a solid rebound. For now, it looks vulnerable to us.
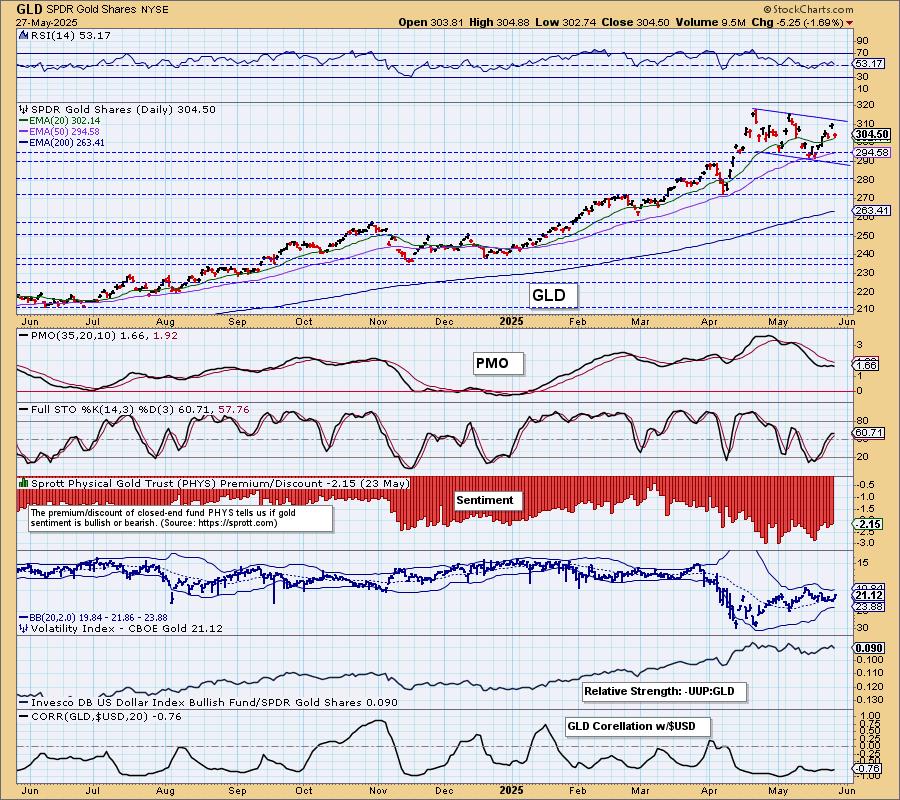
GOLD
IT Trend Model: BUY as of 1/10/2025
LT Trend Model: BUY as of 10/20/2023
GLD Daily Chart: Gold may stay in its flag a bit longer. We were expecting a breakout, but the Dollar spoiled that along with a large amount of sellers given the Dollar was only up +0.55% and Gold was down a whopping -1.69%. The PMO has topped below the signal line. Stochastics have topped as well. The Dollar doesn't look that bullish so we still could get a breakout here.
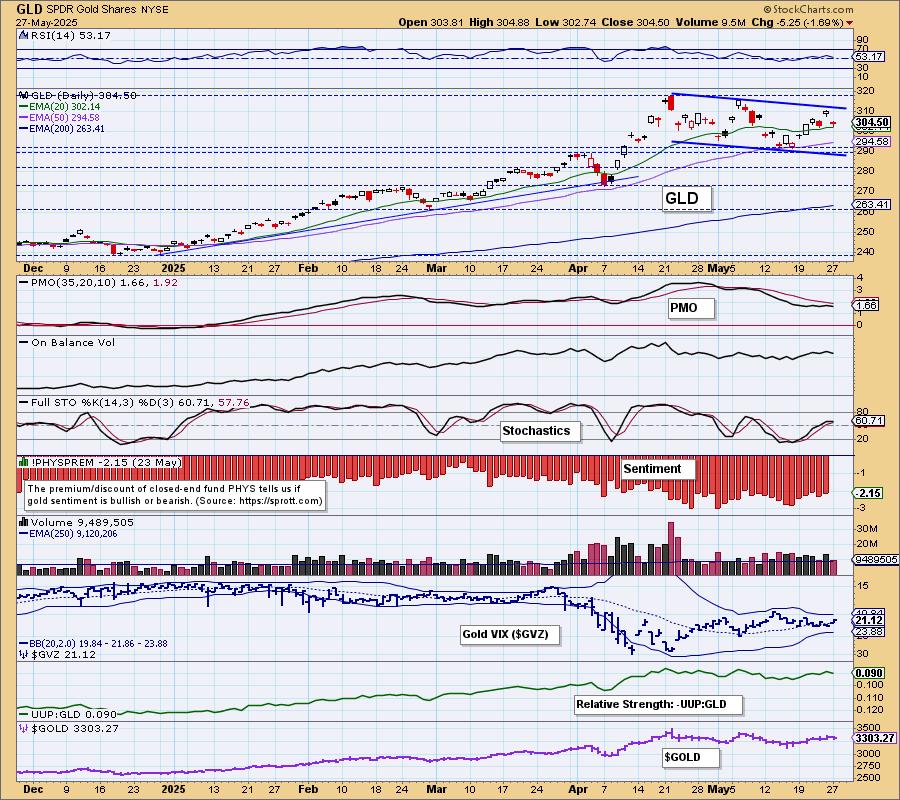
The correlation with the Dollar is very negative so Gold will be somewhat dependent on the Dollar. As noted earlier, the Dollar doesn't look that bullish right now so Gold still has a chance to rally up from here.
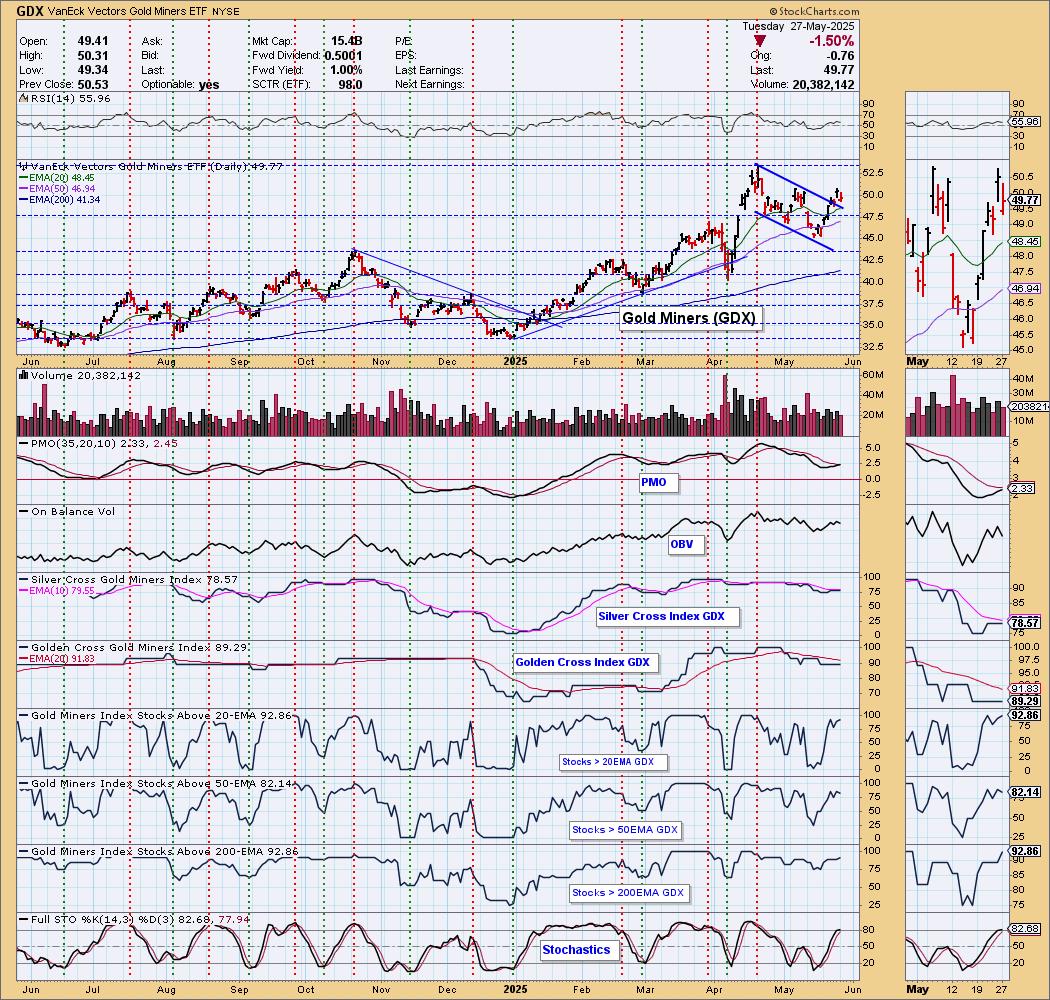
GOLD MINERS (GDX) Daily Chart: Interestingly, Gold Miners did not drop further than Gold. Usually they are very sensitive to its direction. It was a tremendous rally day today and that likely helped the cause. Participation is overbought, but we see that as strength as that condition could persist if the rally gets going again. The breakout did occur out of the bull flag so it has been confirmed. We should see a resumption in the rally barring a big slide on Gold.
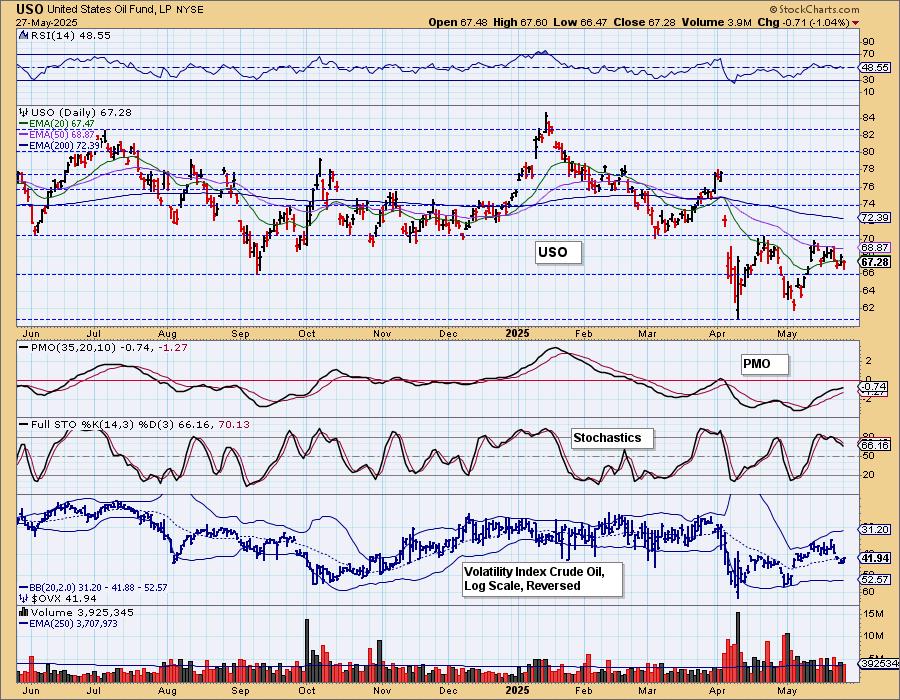
CRUDE OIL (USO)
IT Trend Model: NEUTRAL as of 2/27/2025
LT Trend Model: SELL as of 3/18/2025
USO Daily Chart: Crude hit overhead resistance and has been drifting lower. The PMO is still rising, but the RSI has moved into negative territory suggesting weakness. Stochastics are slowly moving lower. We would look for more decline as the administration works hard to keep Oil prices low.
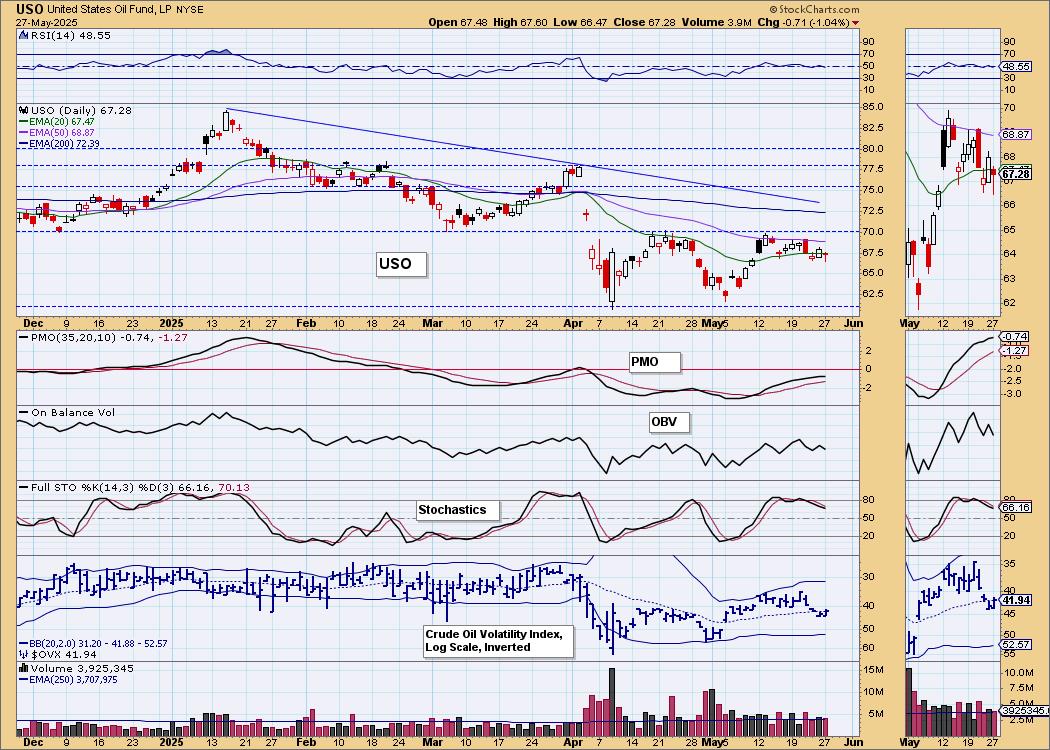
This is a big bullish double bottom on the chart, but it was never confirmed with a breakout. It will officially bust if price drops below the bottoms.
Good Luck & Good Trading!
Erin Swenlin and Carl Swenlin
Technical Analysis is a windsock, not a crystal ball. --Carl Swenlin
(c) Copyright 2025 DecisionPoint.com
Disclaimer: This blog is for educational purposes only and should not be construed as financial advice. The ideas and strategies should never be used without first assessing your own personal and financial situation, or without consulting a financial professional. Any opinions expressed herein are solely those of the author, and do not in any way represent the views or opinions of any other person or entity.
DecisionPoint is not a registered investment advisor. Investment and trading decisions are solely your responsibility. DecisionPoint newsletters, blogs or website materials should NOT be interpreted as a recommendation or solicitation to buy or sell any security or to take any specific action.
NOTE: The signal status reported herein is based upon mechanical trading model signals, specifically, the DecisionPoint Trend Model. They define the implied bias of the price index based upon moving average relationships, but they do not necessarily call for a specific action. They are information flags that should prompt chart review. Further, they do not call for continuous buying or selling during the life of the signal. For example, a BUY signal will probably (but not necessarily) return the best results if action is taken soon after the signal is generated. Additional opportunities for buying may be found as price zigzags higher, but the trader must look for optimum entry points. Conversely, exit points to preserve gains (or minimize losses) may be evident before the model mechanically closes the signal.
Helpful DecisionPoint Links:
DecisionPoint Alert Chart List
DecisionPoint Golden Cross/Silver Cross Index Chart List
DecisionPoint Sector Chart List
Price Momentum Oscillator (PMO)