
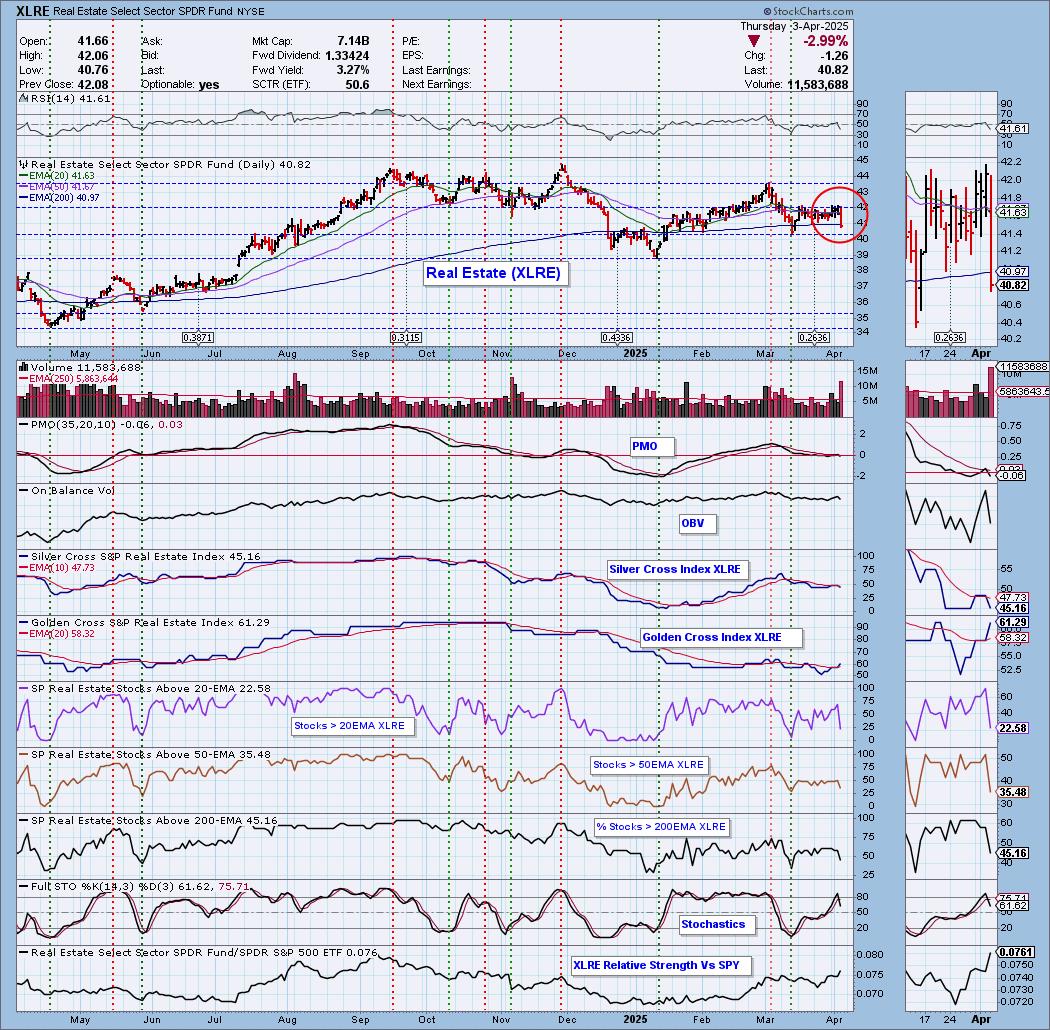
Today the Real Estate (XLRE) 20-day EMA crossed down through the 50-day EMA (Dark Cross) above the 200-day EMA, generating an IT Trend Model NEUTRAL Signal. You may remember that yesterday XLRE switched to a BUY Signal, but today's market crash reversed the signal. XLRE is still in a narrow trading range with future direction still undecided.
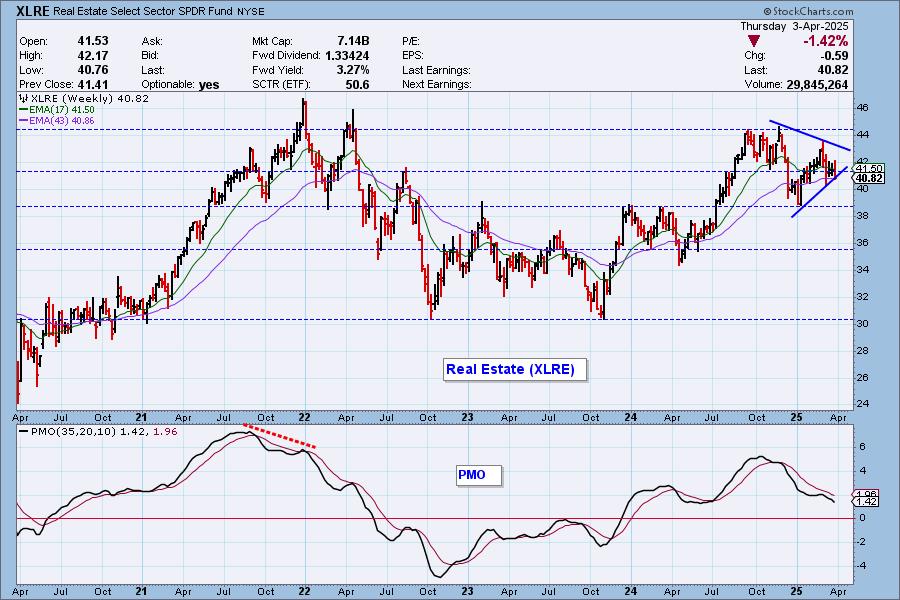
We still note a symmetrical triangle on the weekly chart. As a continuation pattern it should break to the upside, but today's decline is taking it very close to a breakdown.
The DecisionPoint Alert Weekly Wrap presents an end-of-week assessment of the trend and condition of the Stock Market, the U.S. Dollar, Gold, Crude Oil, and Bonds. The DecisionPoint Alert daily report (Monday through Thursday) is abbreviated and gives updates on the Weekly Wrap assessments.
MARKET/INDUSTRY GROUP/SECTOR INDEXES
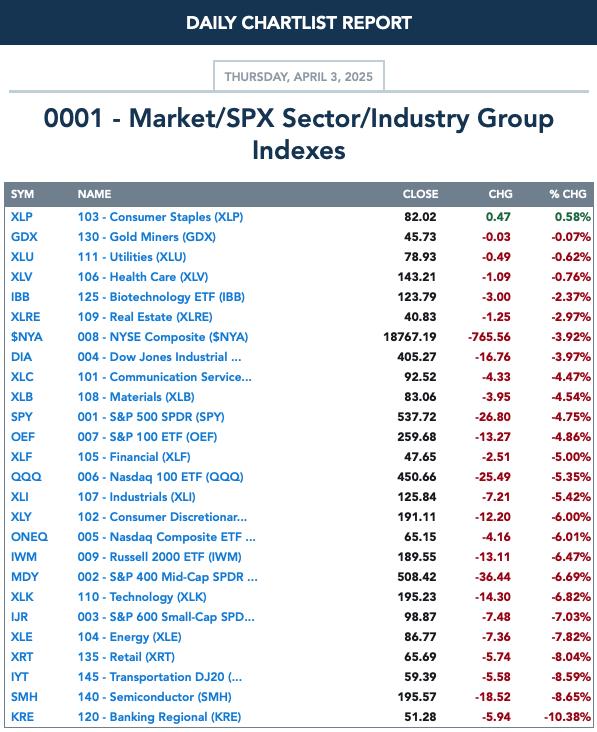
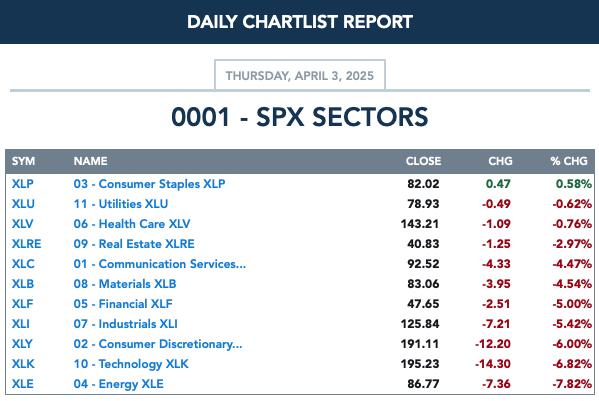
CLICK HERE for Carl's annotated Market Index, Sector, and Industry Group charts.
THE MARKET (S&P 500)
IT Trend Model: NEUTRAL as of 3/4/2025
LT Trend Model: BUY as of 3/29/2023
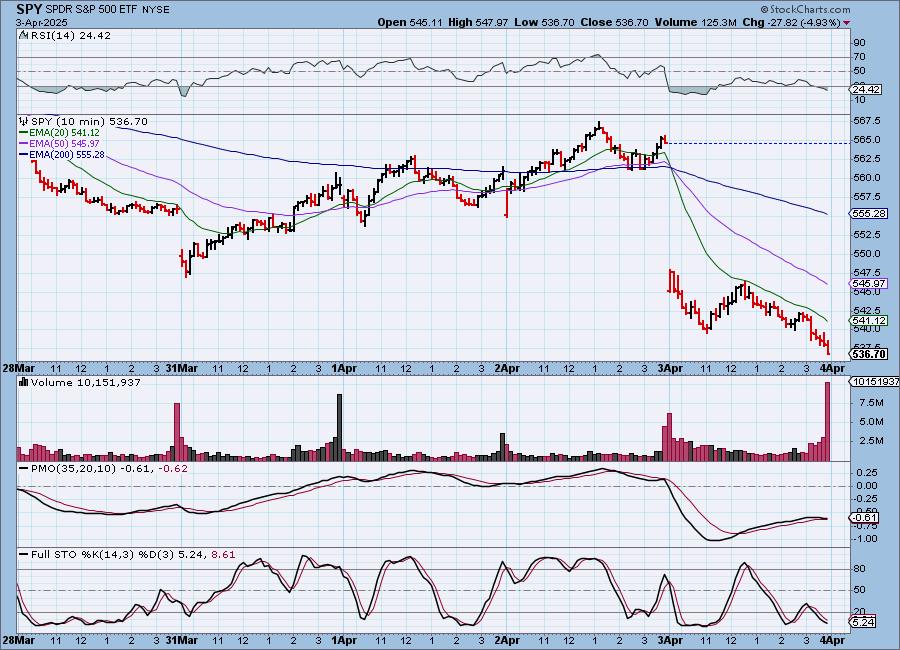
SPY 10-Minute Chart: The market gapped down big time on the open and after a small rally busted it declined all the way into the close. The 10-minute PMO has topped and Stochastics are below 20. It doesn't bode well for tomorrow.
SPY Daily Chart: We note that today candle is lower than the March low, so now we have a top beneath a top and a bottom beneath a bottom, and SPY is officially in an intermediate-term down trend. The PMO topped and triggered a Crossover SELL Signal.
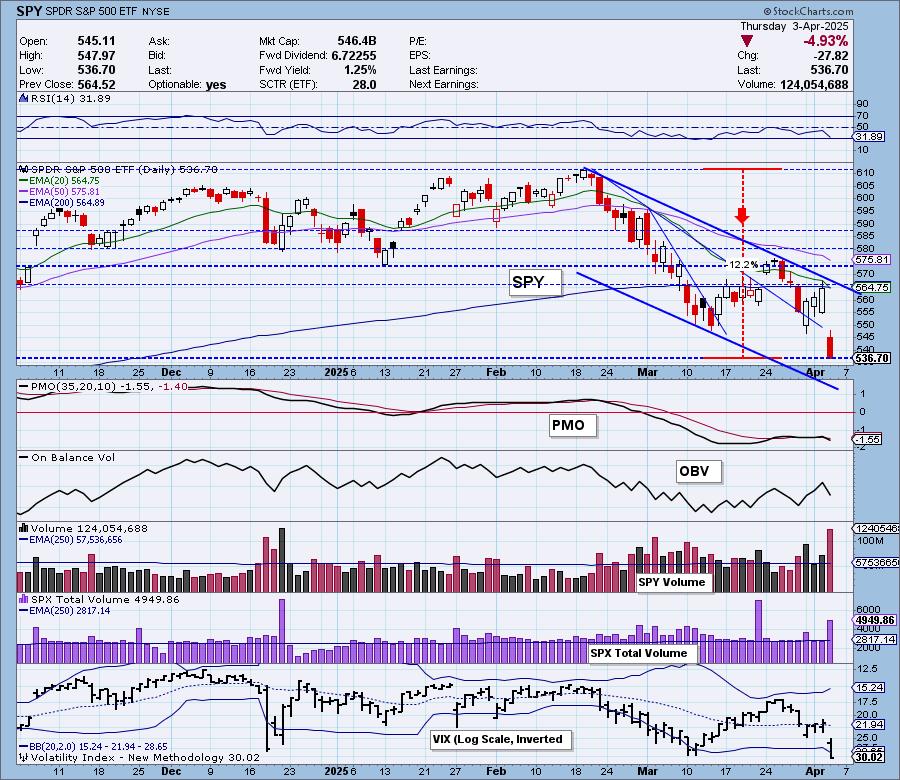
The VIX dropped precipitously and punctured the lower Bollinger Band. This often leads to an upside reversal, but we're not so sure. Stochastics have tumbled lower and are in negative territory. Mega-caps are partially to blame as you can see the SPY has been underperforming equal-weight RSP.
S&P 500 New 52-Week Highs/Lows: New Lows spiked on today's big decline. This has pushed the High-Low Differential down below the zero line. Interestingly we did see quite a few New Highs so not everyone is suffering.
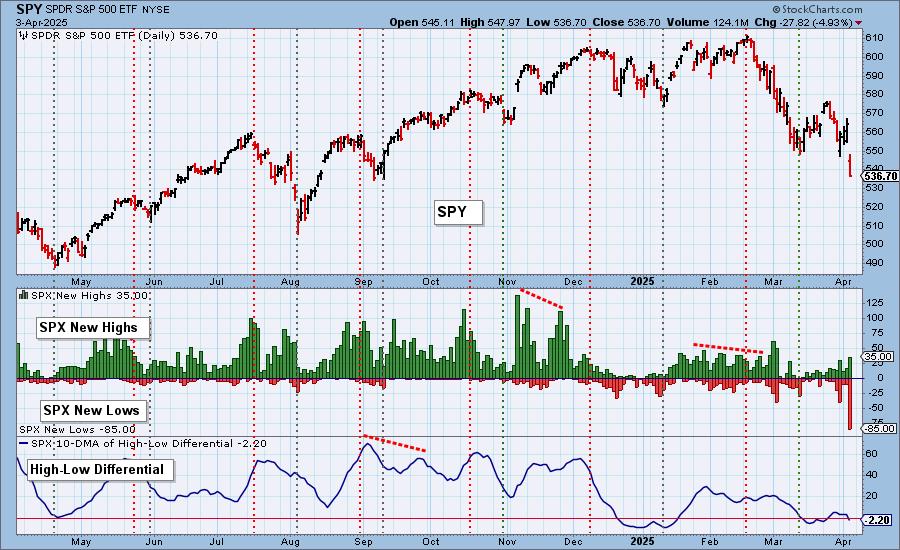
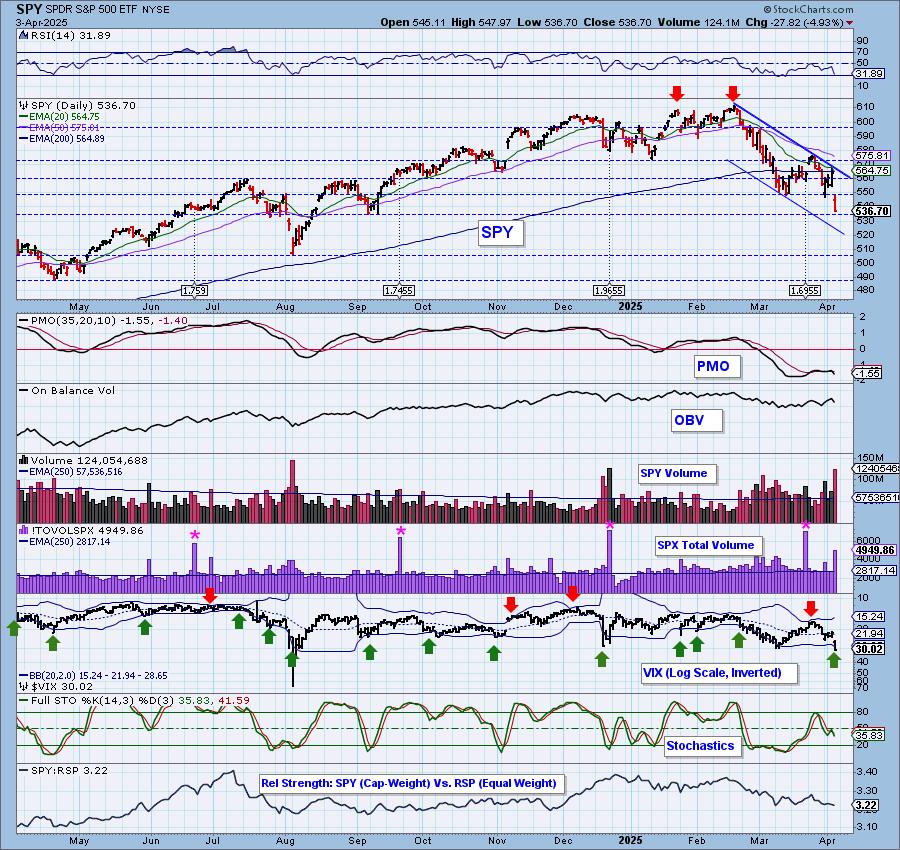
Climax* Analysis: As one might expect, today there were strong and unanimous climax readings on the four relevant indicators, giving us a downside initiation climax. SPX Total Volume was 176% of the one-year daily average volume, which is easily blowout level; however, we'd be careful about assuming that there is no more downside coming.
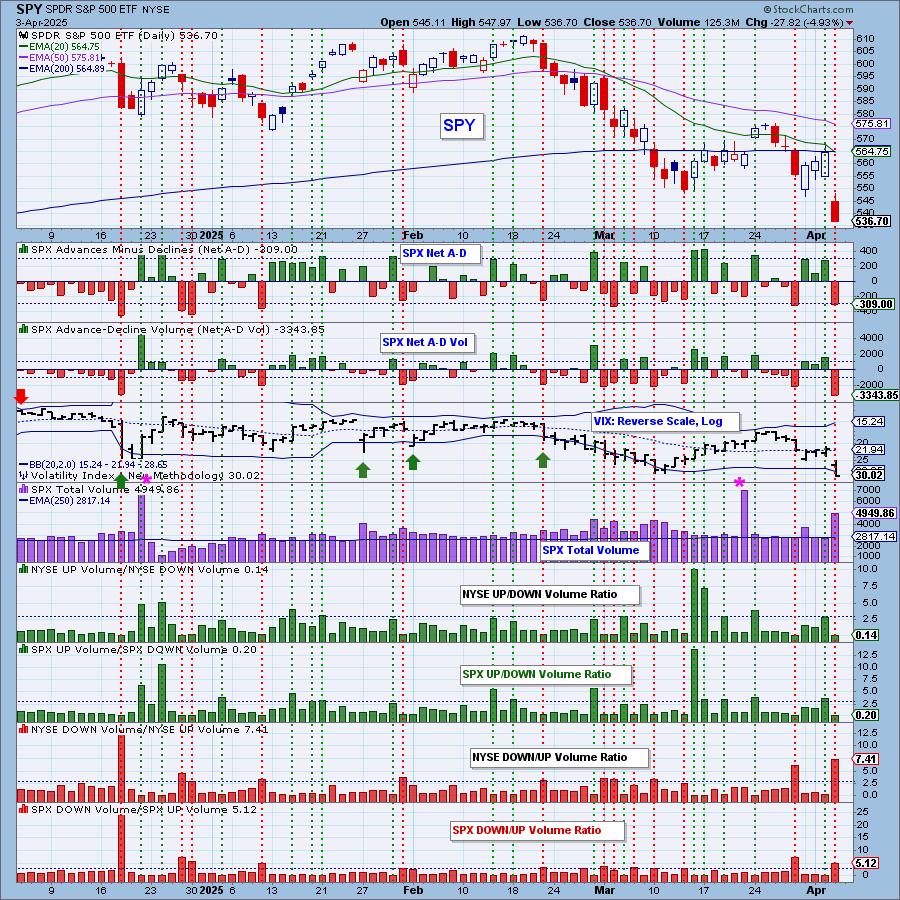
*A climax is a one-day event when market action generates very high readings in, primarily, breadth and volume indicators. We also include the VIX, watching for it to penetrate outside the Bollinger Band envelope. The vertical dotted lines mark climax days -- red for downside climaxes, and green for upside. Climaxes are at their core exhaustion events; however, at price pivots they may be initiating a change of trend.
Short-Term Market Indicators: The short-term market trend is DOWN and the condition is NEUTRAL.
It's hard to see, but the STO-V did tick downward along with the STO-B. So now both Swenlin Trading Oscillators (STOs) are in decline. Participation was slashed and we lost an incredible amount of rising PMOs. Unfortunately neither of these readings are oversold.
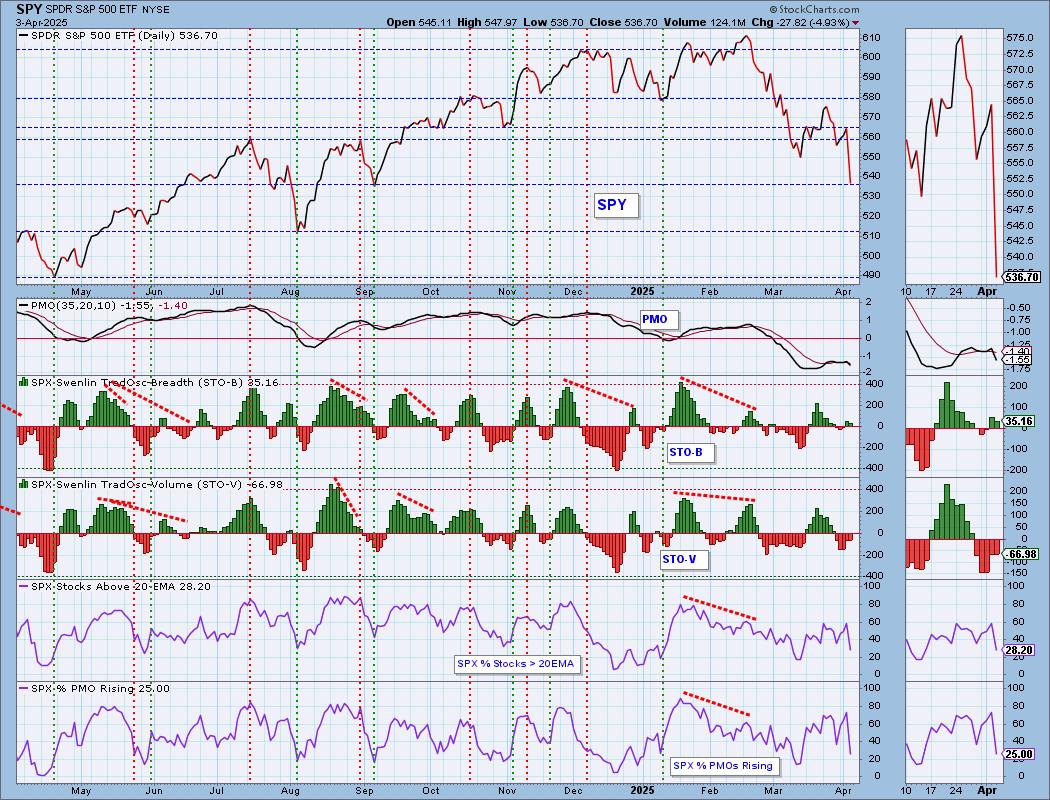
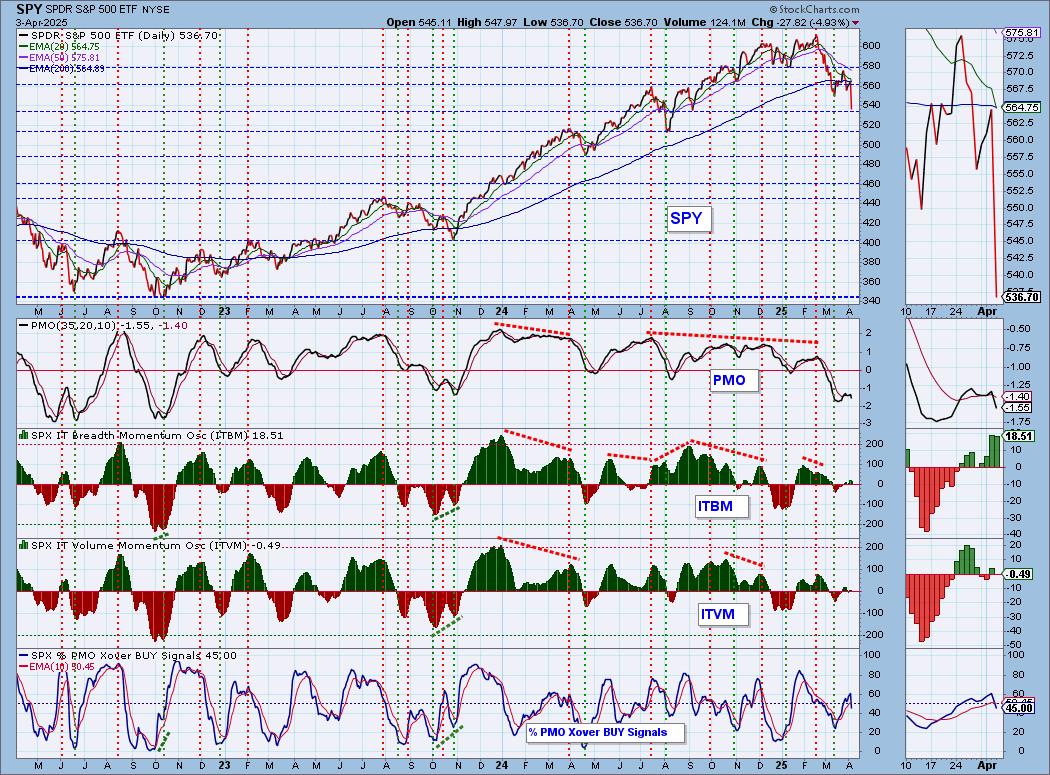
Intermediate-Term Market Indicators: The intermediate-term market trend is DOWN and the condition is NEUTRAL.
We're very surprised to see that the ITVM rose on today's action. Could be related to the high volume we saw today. The ITBM is moving lower now. We lost quite a few PMO Crossover BUY Signals. %PMO Xover BUY Signals crossed below the signal line.
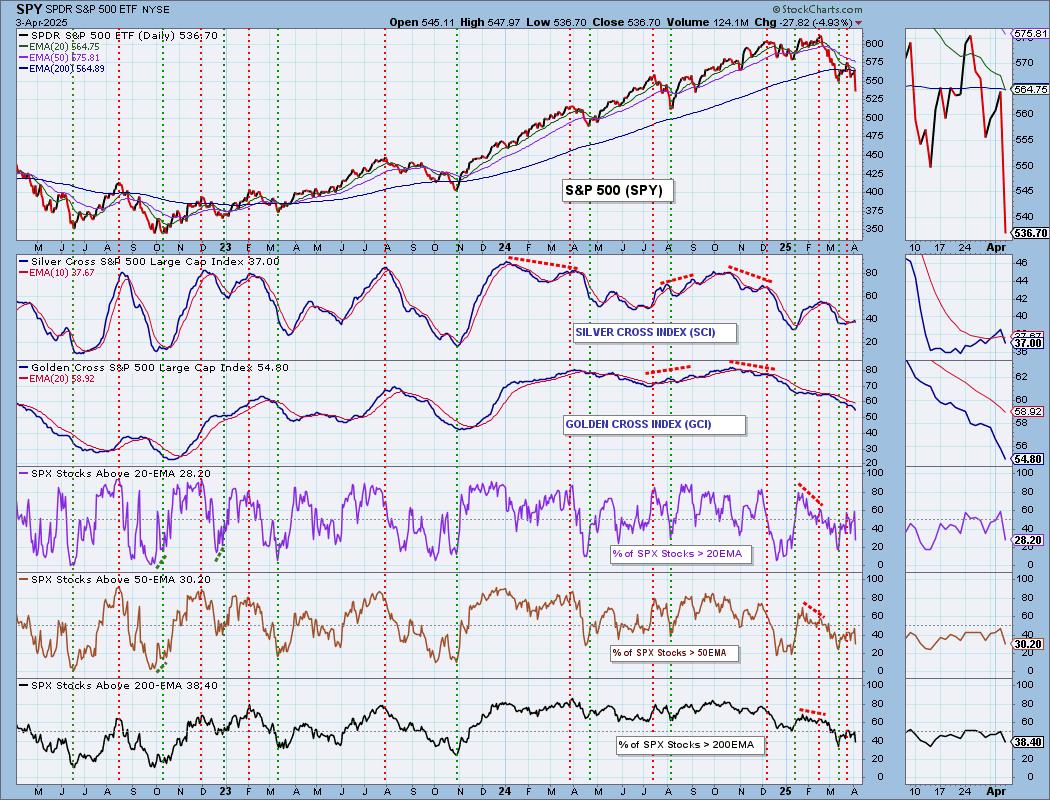
PARTICIPATION CHART (S&P 500): The following chart objectively shows the depth and trend of participation for the SPX in two time frames.
- Intermediate-Term - the Silver Cross Index (SCI) shows the percentage of SPX stocks on IT Trend Model BUY signals (20-EMA > 50-EMA). The opposite of the Silver Cross is a "Dark Cross" -- those stocks are, at the very least, in a correction.
- Long-Term - the Golden Cross Index (GCI) shows the percentage of SPX stocks on LT Trend Model BUY signals (50-EMA > 200-EMA). The opposite of a Golden Cross is the "Death Cross" -- those stocks are in a bear market.
The market bias is BEARISH in the intermediate term.
The market bias is BEARISH in the long term.
Participation was slashed across the board. It was enough to not only turn the Silver Cross Index down, it also caused a Bearish Shift across the signal line which moves our IT Bias back to BEARISH. The Golden Cross Index continues to move lower. It is below its signal line so the LT Bias is still BEARISH.
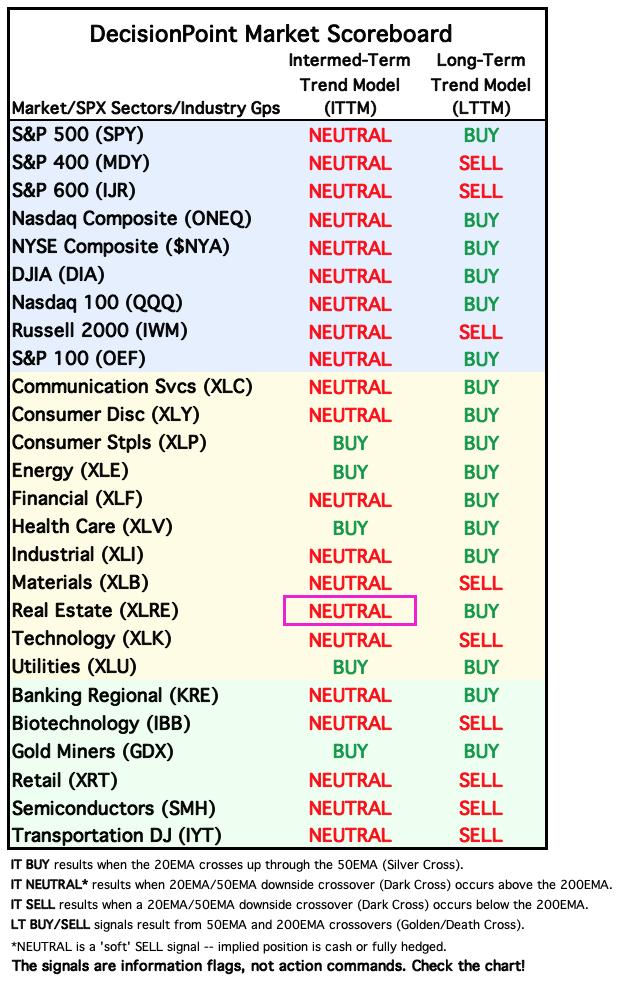
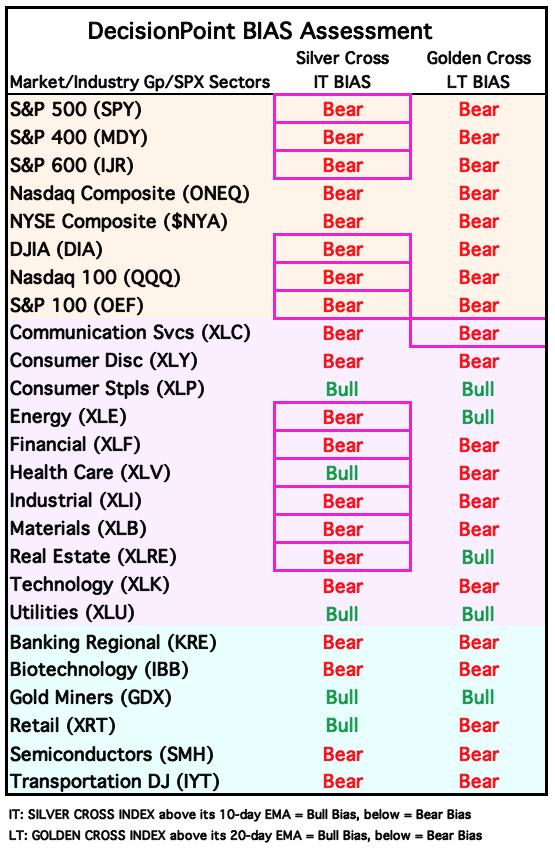
BIAS Assessment: The following table expresses the current BIAS of various price indexes based upon the relationship of the Silver Cross Index to its 10-day EMA (intermediate-term), and of the Golden Cross Index to its 20-day EMA (long-term). When the Index is above the EMA it is bullish, and it is bearish when the Index is below the EMA. The BIAS does not imply that any particular action should be taken. It is information to be used in the decision process.
The items with highlighted borders indicate that the BIAS changed today.
*****************************************************************************************************
CONCLUSION: Bearish biases are now taking over the Bias Table above. The SPY now has a bearish bias in the intermediate term as the Silver Cross Index crossed below its signal line today. Participation readings were slashed on today's deep decline. It took the STOs down and caused numerous New Lows. The weakness is clearly visible and with a new declining trend in the intermediate term we would expect to see prices move even lower from here. We could see a snapback tomorrow if the "buy the dip" crowd comes in, but given today's downside initiation climax, we have to believe we will see lower prices persist in the short term.
Erin is 15% long, 0% short. (This is intended as information, not a recommendation.)
*****************************************************************************************************
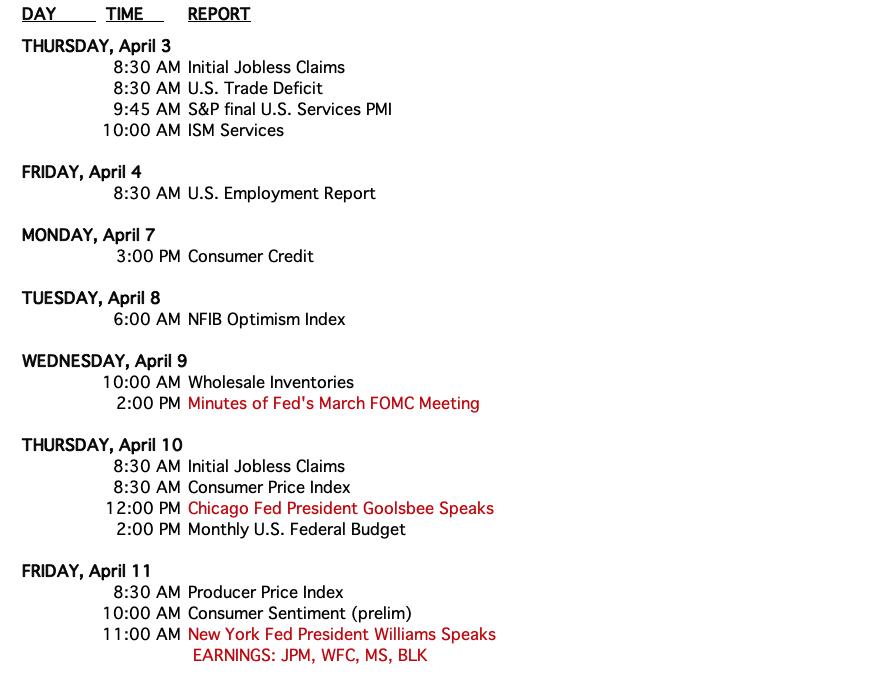
CALENDAR
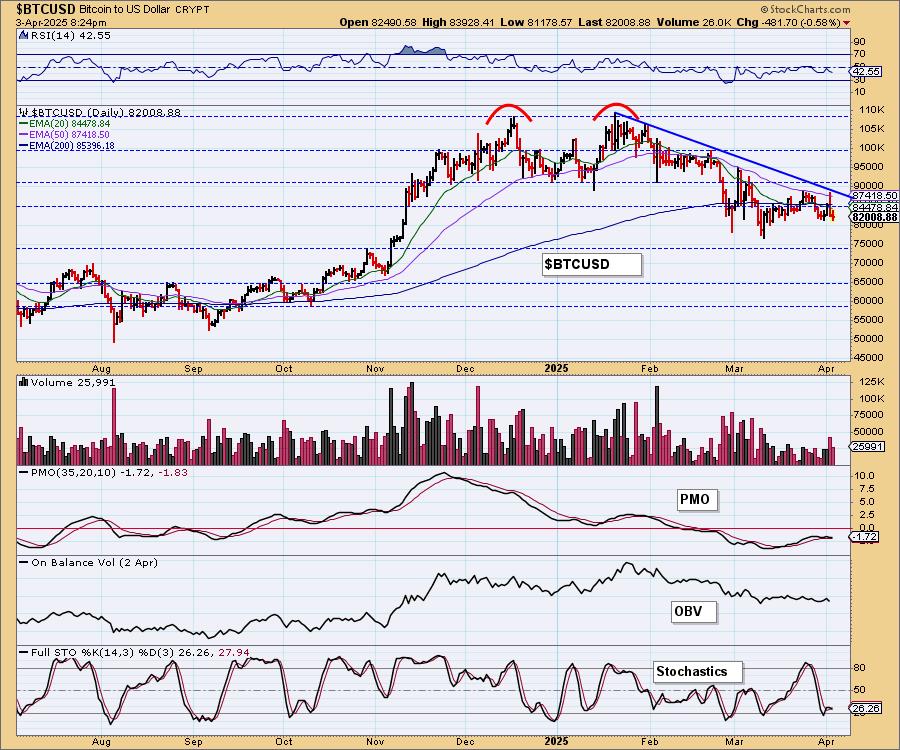
BITCOIN
Bitcoin failed another test of the declining tops trendline. The PMO has now topped and the RSI is falling negative territory. Stochastics also topped deep in negative territory. We were looking for a possible breakout, but it seems we'll have to wait longer.
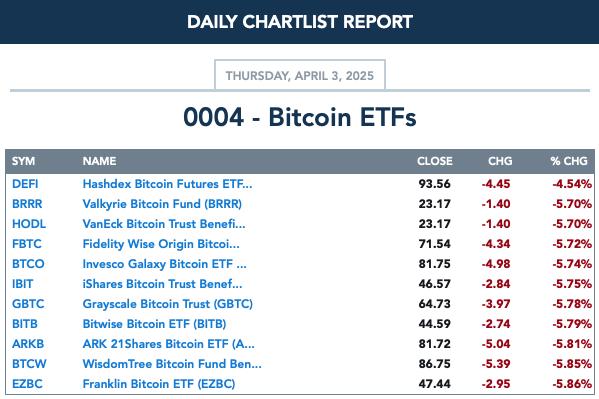
BITCOIN ETFs
INTEREST RATES
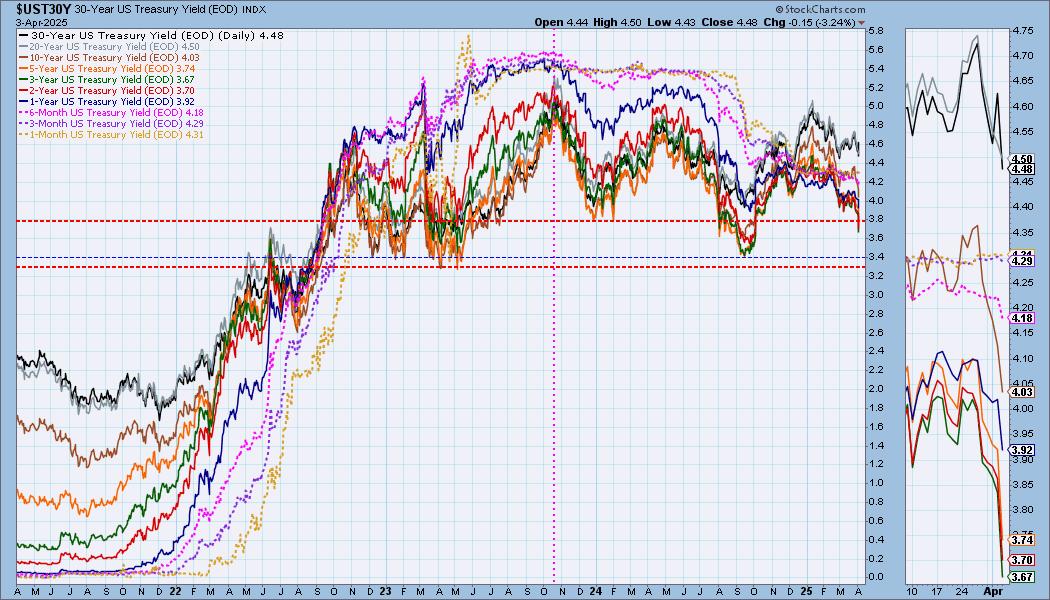
Yields tumbled as investors rushed to the safety of Bonds. We would look for them to fall further as more investors go to hide out from this stormy market.
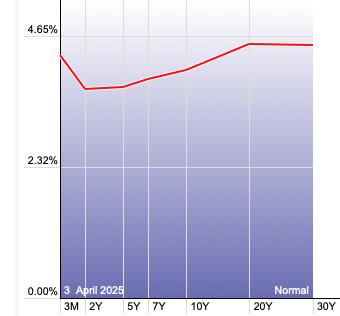
The Yield Curve Chart from StockCharts.com shows us the inversions taking place. The red line should move higher from left to right. Inversions are occurring where it moves downward.
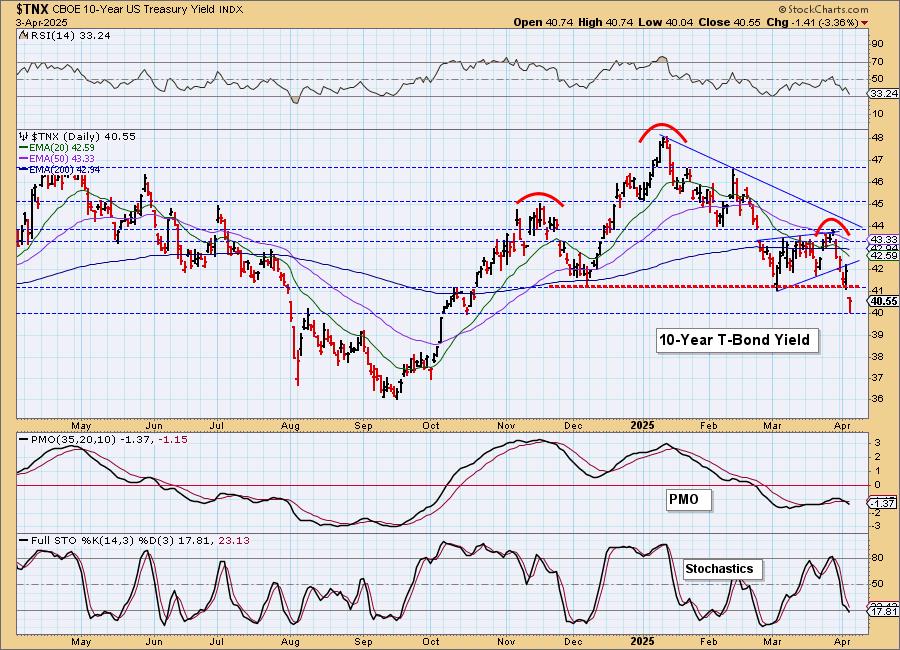
10-YEAR T-BOND YIELD
$TNX dipped to the 4% level today. It is on support, but it doesn't look very sturdy. We do see a bullish hammer candlestick so maybe we'll get a bit of gain tomorrow. Overall with the PMO topping and giving us a Crossover SELL Signal so far beneath the zero line, we have to expect this level of support will fail.
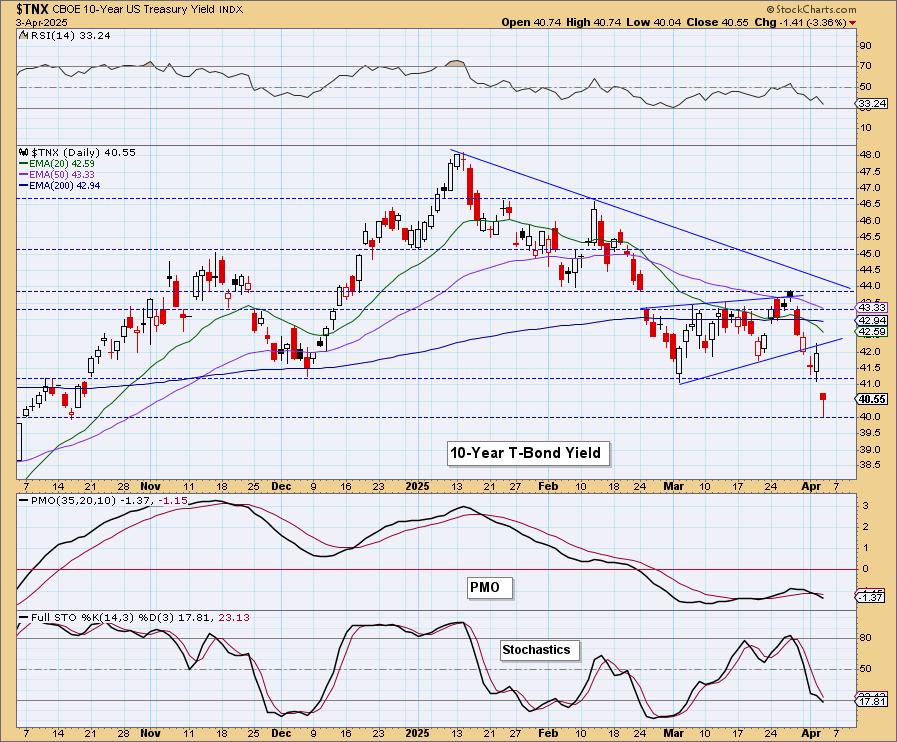
We see a very large head and shoulders pattern on the 1-year chart. Today's decline confirmed the pattern. We could see $TNX drop back to the 2024 low based on the pattern.
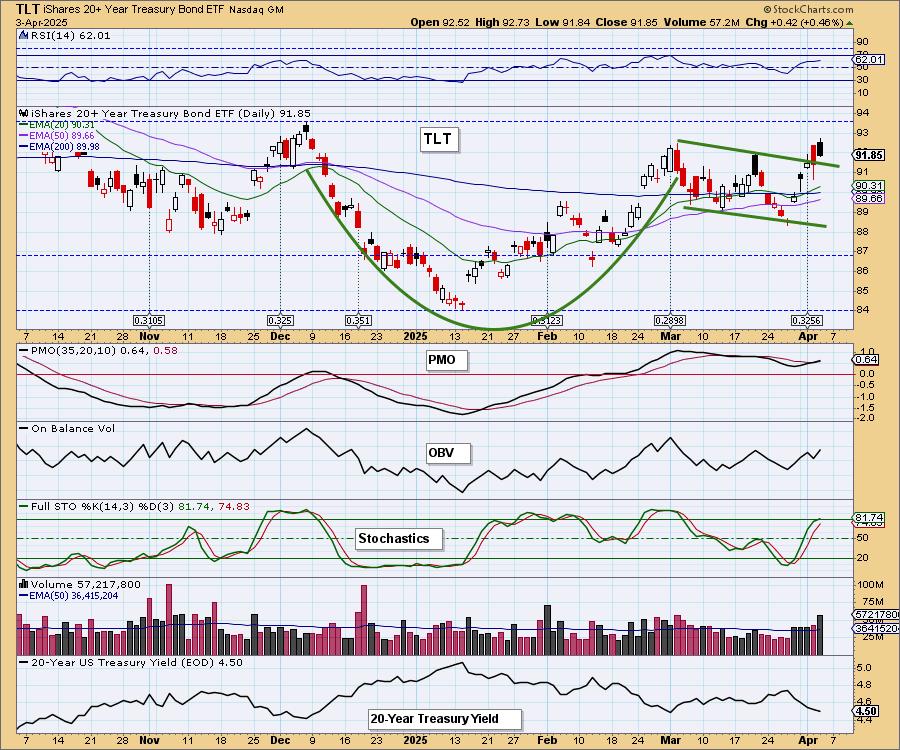
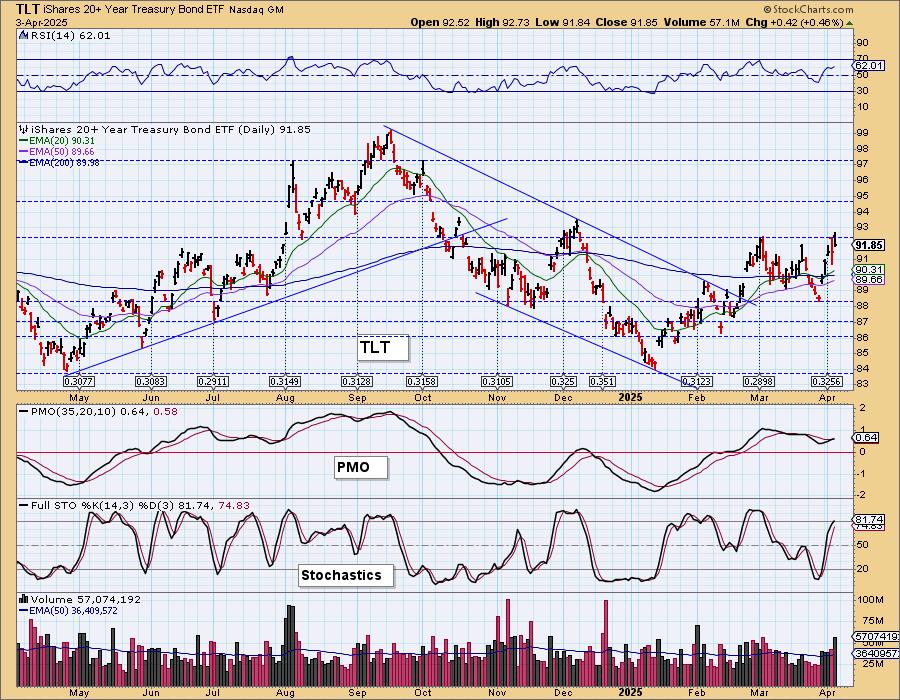
BONDS (TLT)
IT Trend Model: BUY as of 2/25/2025
LT Trend Model: SELL as of 12/13/2024
TLT Daily Chart: The cup with handle pattern seems to be executing with the rally out of the handle. With yields looking so bearish, we are expecting a nice rally out of TLT. The RSI is positive and not overbought. The PMO is rising on a Crossover BUY Signal above the zero line. Stochastics are back above 80 signaling internal strength.
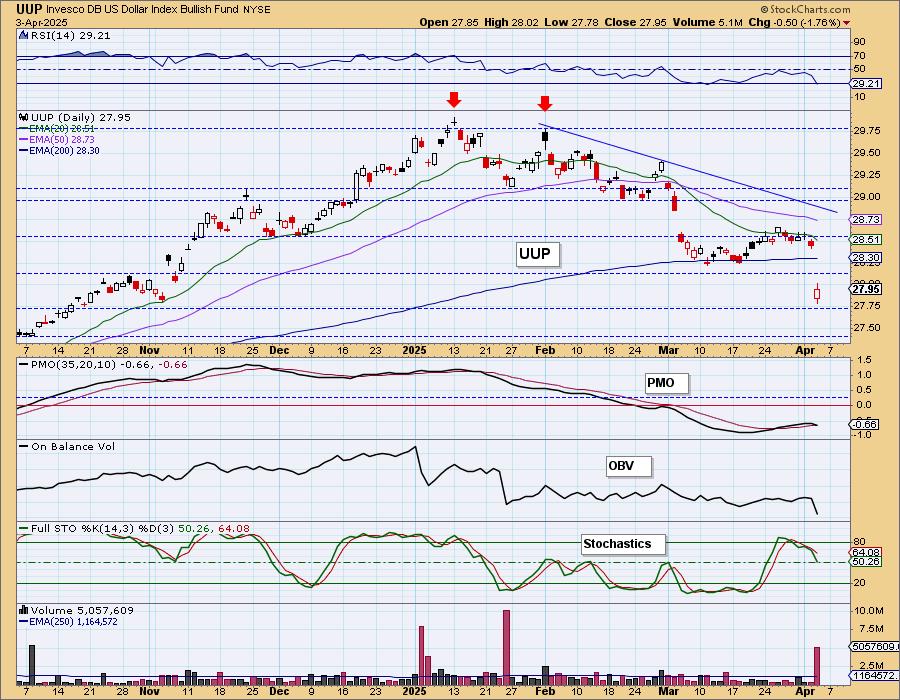
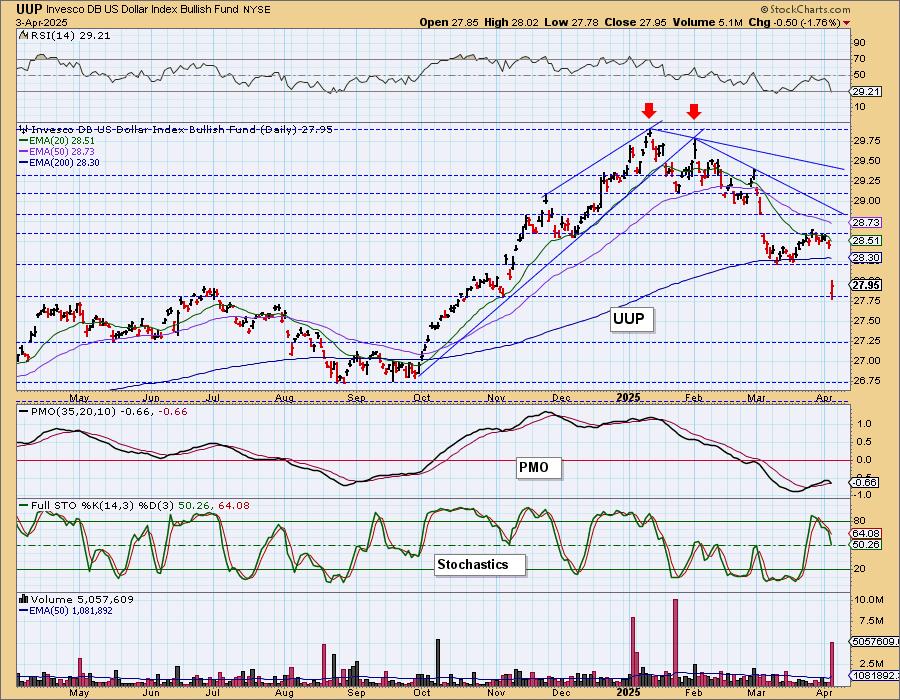
DOLLAR (UUP)
IT Trend Model: NEUTRAL as of 3/5/2025
LT Trend Model: BUY as of 5/25/2023
UUP Daily Chart: The Dollar dropped out of the sky today on the concerns about tariffs. It was already looking weak. The PMO is now crossing over its signal line for a Crossover SELL Signal below the zero line. Stochastics are also dropping. We could say there is a small bit of good news and that is that the RSI is now oversold. However, given the big decline, we think it will get much further oversold before we look for a good rally.
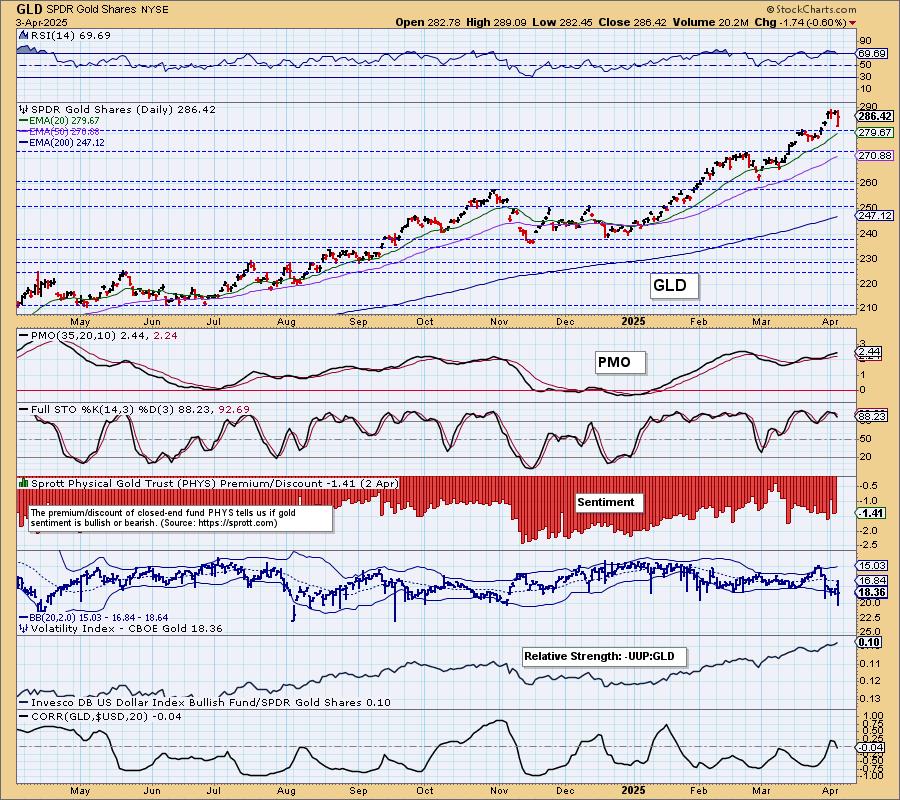
GOLD
IT Trend Model: BUY as of 1/10/2025
LT Trend Model: BUY as of 10/20/2023
GLD Daily Chart: Gold did not take advantage of the falling Dollar at all as it too was down. This tells us there were quite a few sellers out there which is somewhat surprising given the usual flight to safety during difficult times for the market. It was overbought on the RSI so we did expect some downside or a pause. It dropped below the very short-term rising bottoms trendline and looks ready to test the 20-day EMA. We don't think it will be down for long.
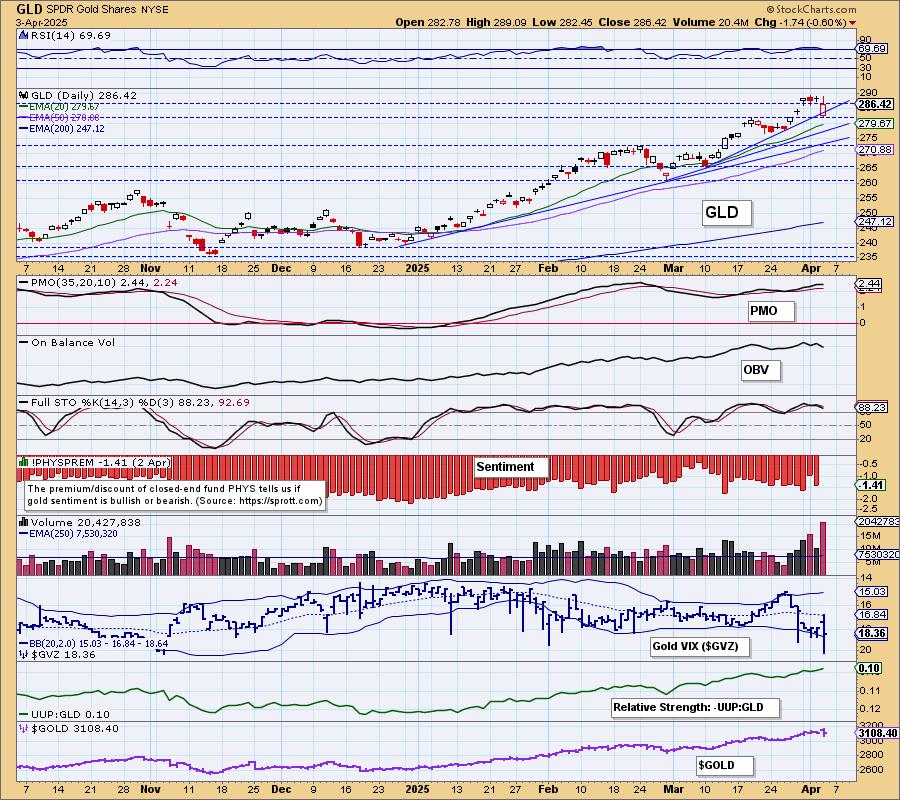
The Gold Volatility Index ($GVZ) continues to puncture the lower Bollinger Band on our inverted scale and that can often times lead to rally. We do expect some turbulence, but ultimately Gold should right itself.
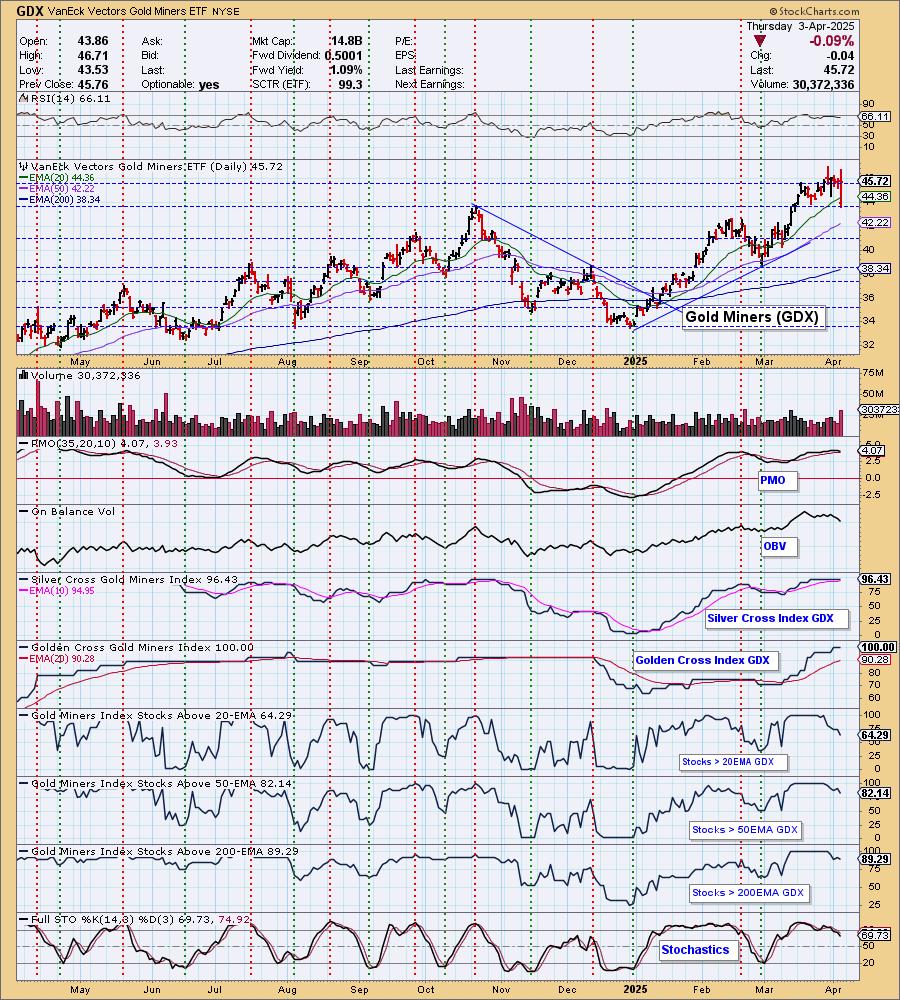
GOLD MINERS (GDX) Daily Chart: Gold Miners had a very volatile day finishing only slightly down. Not bad given Gold was down quite a bit. We still see GDX as topping right now. Participation is really starting to leak out of the group suggesting it is likely to drop a bit further.
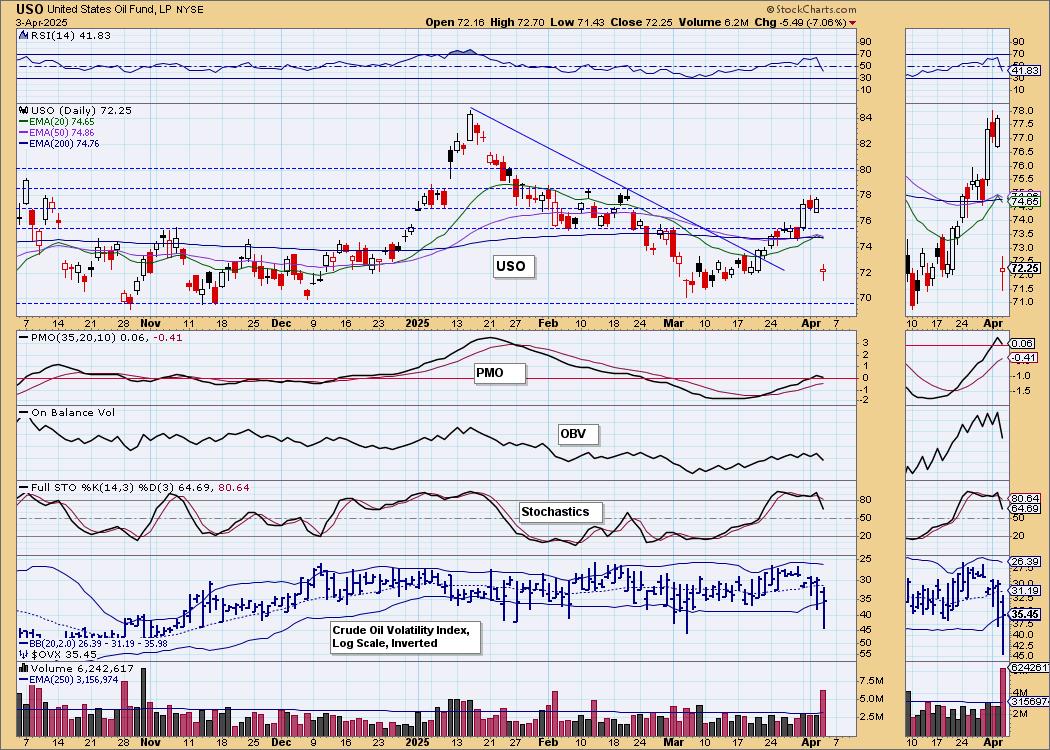
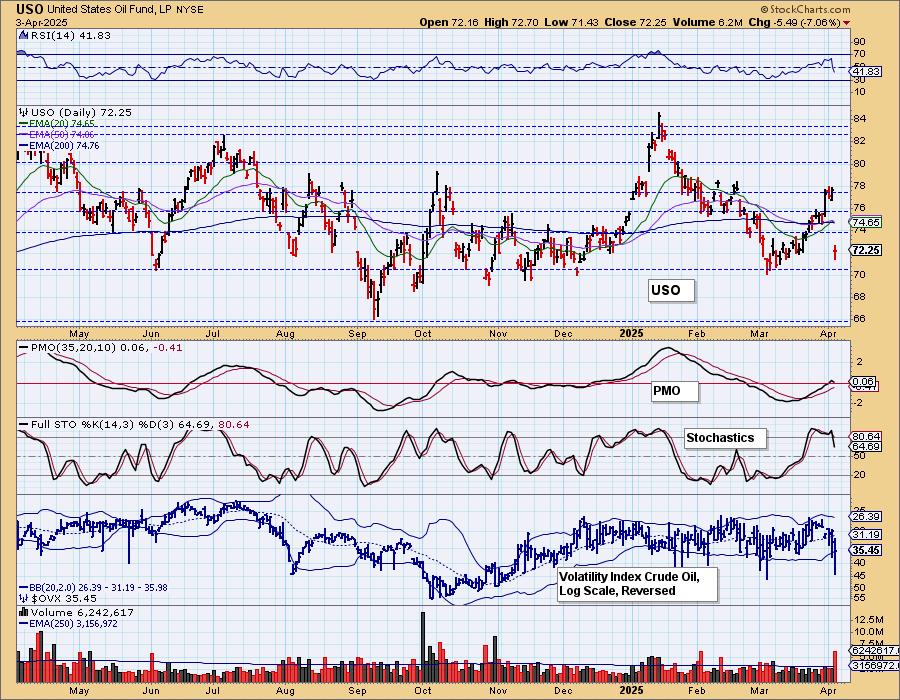
CRUDE OIL (USO)
IT Trend Model: NEUTRAL as of 2/27/2025
LT Trend Model: BUY as of 4/1/2025
USO Daily Chart: Crude Oil crashed today and took the Energy sector down with it. The rally looked good and we did think we would see a continuation, but the tables have now turned. We wouldn't be surprised if we get a snapback tomorrow, but ultimately it is likely to test strong support just under 70.
Good Luck & Good Trading!
Erin Swenlin and Carl Swenlin
Technical Analysis is a windsock, not a crystal ball. --Carl Swenlin
(c) Copyright 2025 DecisionPoint.com
Disclaimer: This blog is for educational purposes only and should not be construed as financial advice. The ideas and strategies should never be used without first assessing your own personal and financial situation, or without consulting a financial professional. Any opinions expressed herein are solely those of the author, and do not in any way represent the views or opinions of any other person or entity.
DecisionPoint is not a registered investment advisor. Investment and trading decisions are solely your responsibility. DecisionPoint newsletters, blogs or website materials should NOT be interpreted as a recommendation or solicitation to buy or sell any security or to take any specific action.
NOTE: The signal status reported herein is based upon mechanical trading model signals, specifically, the DecisionPoint Trend Model. They define the implied bias of the price index based upon moving average relationships, but they do not necessarily call for a specific action. They are information flags that should prompt chart review. Further, they do not call for continuous buying or selling during the life of the signal. For example, a BUY signal will probably (but not necessarily) return the best results if action is taken soon after the signal is generated. Additional opportunities for buying may be found as price zigzags higher, but the trader must look for optimum entry points. Conversely, exit points to preserve gains (or minimize losses) may be evident before the model mechanically closes the signal.
Helpful DecisionPoint Links:
DecisionPoint Alert Chart List
DecisionPoint Golden Cross/Silver Cross Index Chart List
DecisionPoint Sector Chart List
Price Momentum Oscillator (PMO)