
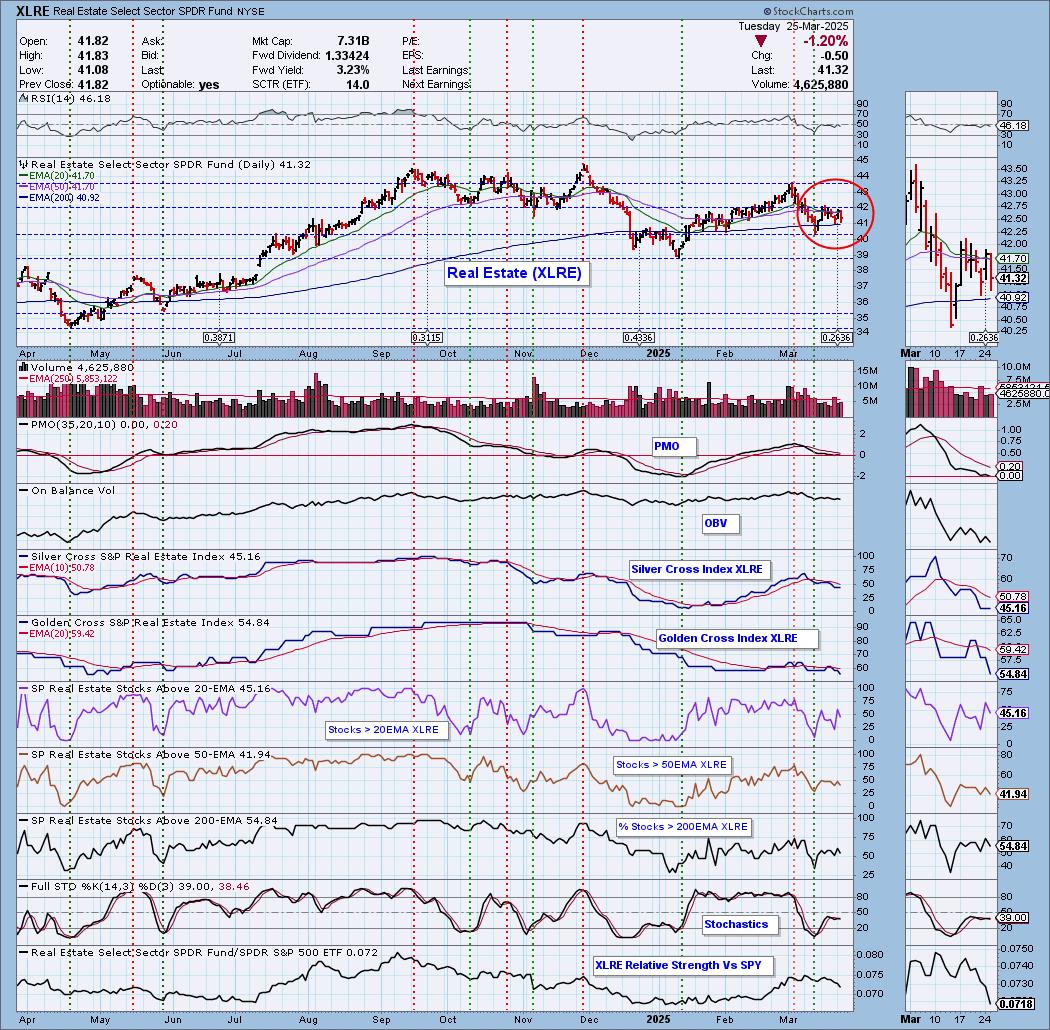
Today the Real Estate Sector ETF (XLRE) 20-day EMA crossed down through the 50-day EMA (Dark Cross), above the 200-day EMA, generating an IT Trend Model NEUTRAL Signal. Price has been meandering sideways in a trading range. Price is very close to both the 20/50-day EMAs so this signal could bust fairly quickly if price can rally above. Participation is rather thin and Stochastics are flat and unresponsive. We could eke out a bit more rally, but with the Silver Cross Index reading below our bullish 50% threshold, it will be difficult to make much headway.
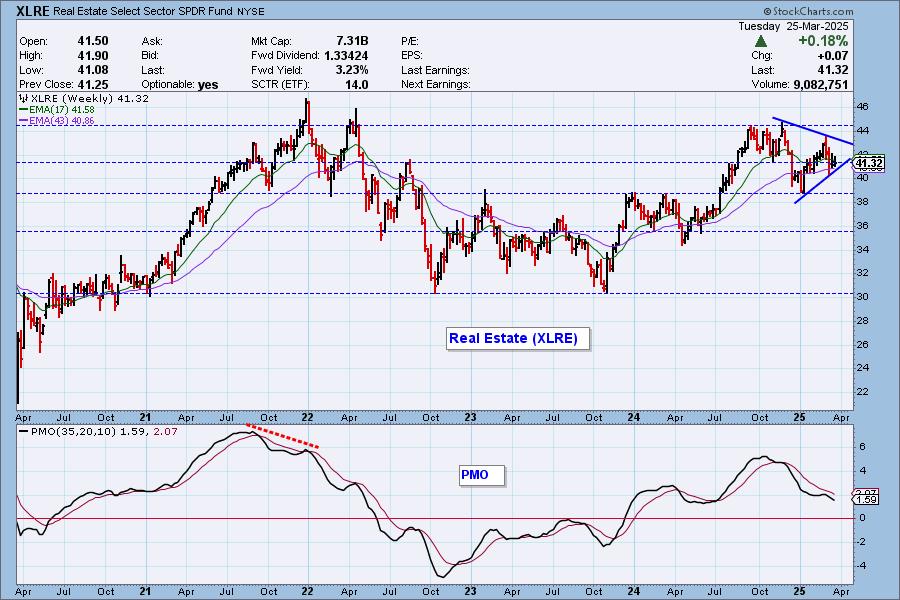
The weekly chart shows a long-term double top, with XLRE forming a triangle in indecision. Technically these are continuation patterns so given the prior trend was UP, we should expect an upside breakout. However, with the weekly PMO diving lower it is very vulnerable to a breakdown instead of a breakout.
The DecisionPoint Alert Weekly Wrap presents an end-of-week assessment of the trend and condition of the Stock Market, the U.S. Dollar, Gold, Crude Oil, and Bonds. The DecisionPoint Alert daily report (Monday through Thursday) is abbreviated and gives updates on the Weekly Wrap assessments.
Watch the latest episode of DecisionPoint on our YouTube channel here!
MARKET/INDUSTRY GROUP/SECTOR INDEXES
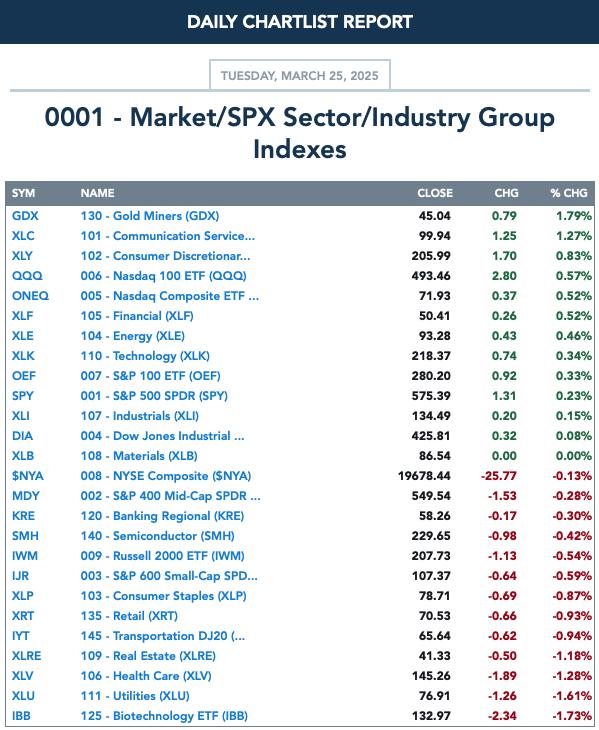
CLICK HERE for Carl's annotated Market Index, Sector, and Industry Group charts.
THE MARKET (S&P 500)
IT Trend Model: NEUTRAL as of 3/4/2025
LT Trend Model: BUY as of 3/29/2023
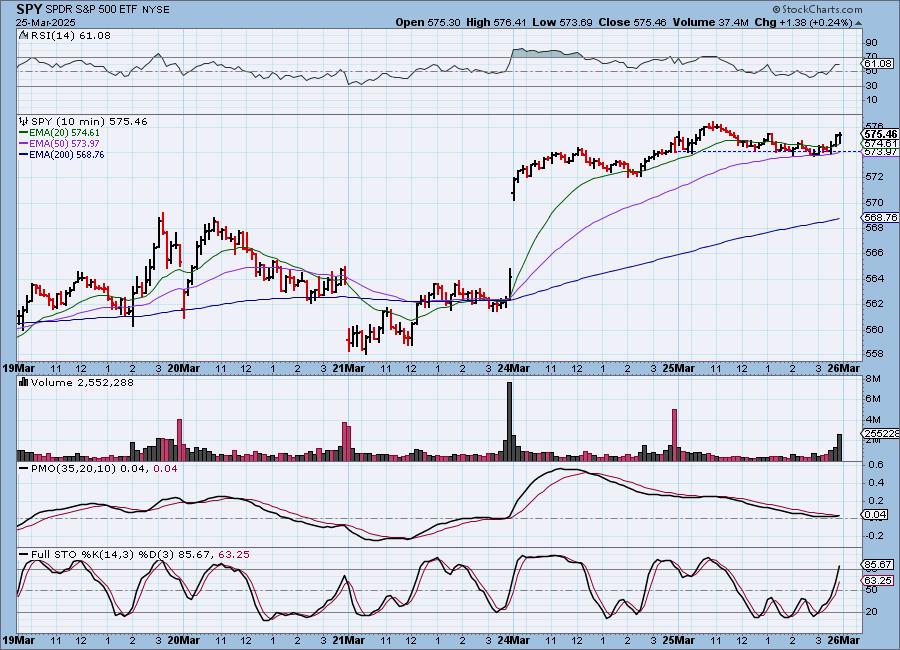
SPY 10-Minute Chart: We were unimpressed by today's price action. After such an explosive move yesterday we would've expected to see some followthrough. Instead we got churn.
SPY Daily Chart: The declining trend has been broken, but we think this could be an extension of the bear flag formation. We also have a price island and those can often times lead to island reversals. The PMO did give us a Crossover BUY Signal today.
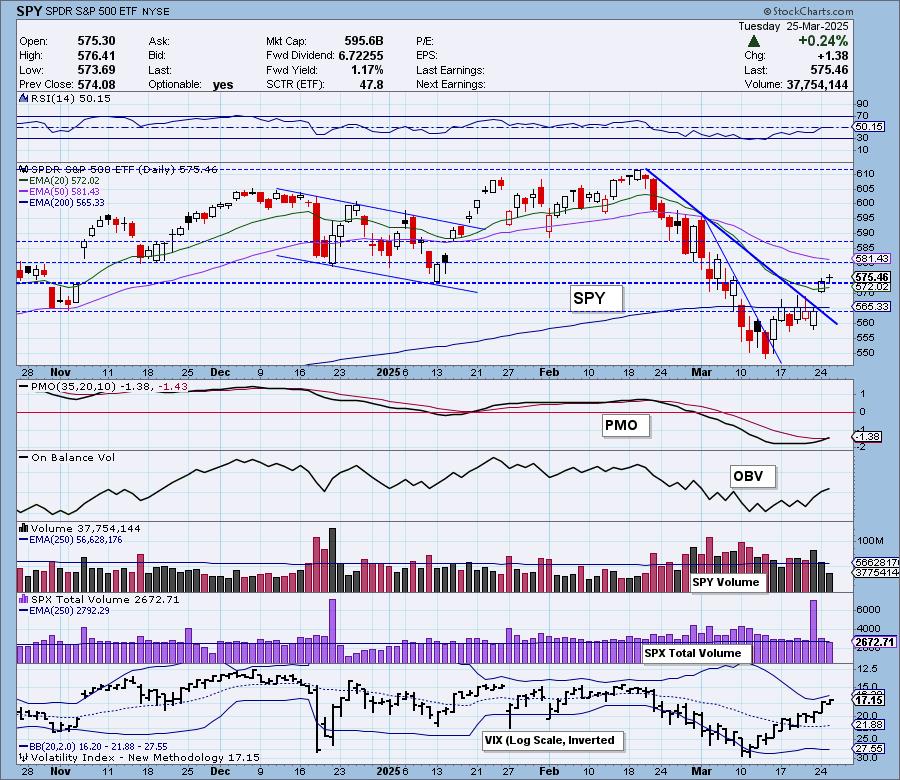
The VIX came close to puncturing its upper Bollinger Band today and that will often times lead to a downside reversal. This definitely needs to be monitored. Stochastics look extremely bullish as they rise vertically so there is internal strength visible. Note that mega-caps are outperforming equal-weight RSP. This condition is good for the market presently as most Magnificent Seven stocks are showing some recovery.

Here is the latest recording from 3/24. Click HERE to get to our video list.:
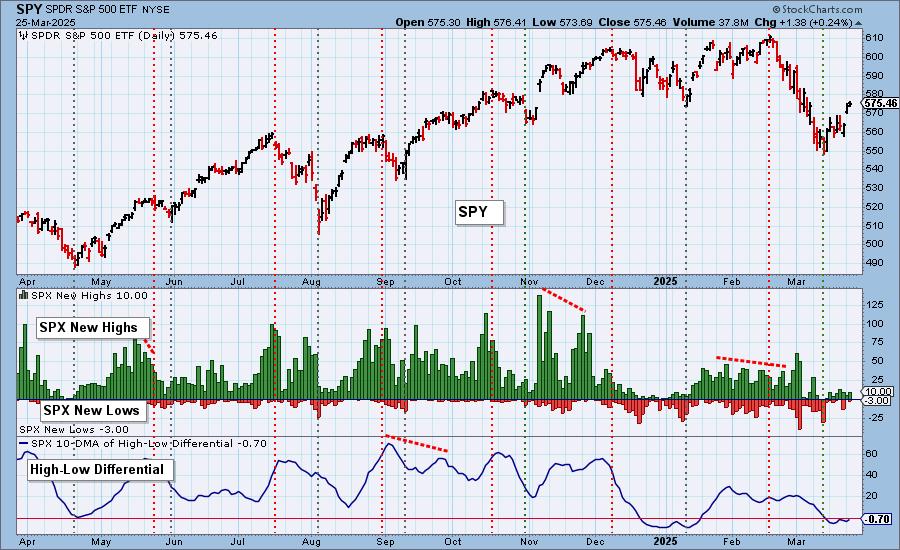
S&P 500 New 52-Week Highs/Lows: New Highs didn't do much and we did see some New Lows on the rally. Interestingly, the High-Low Differential bottomed after topping below the zero line yesterday which is somewhat encouraging.
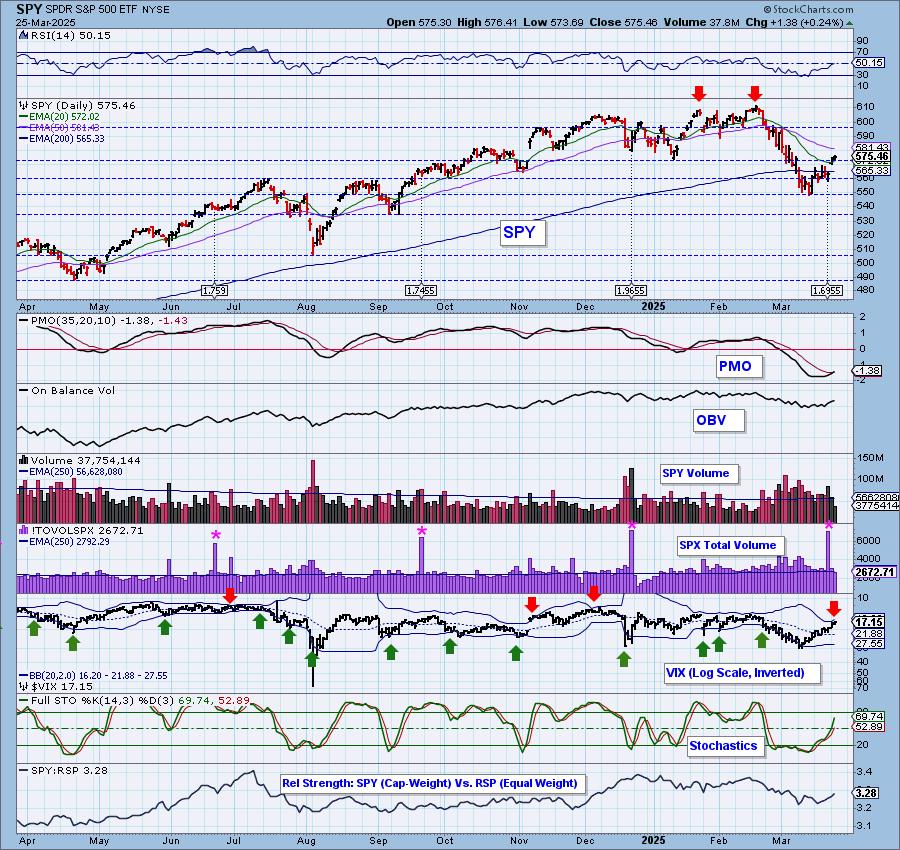
Climax* Analysis: There were no climax readings today.
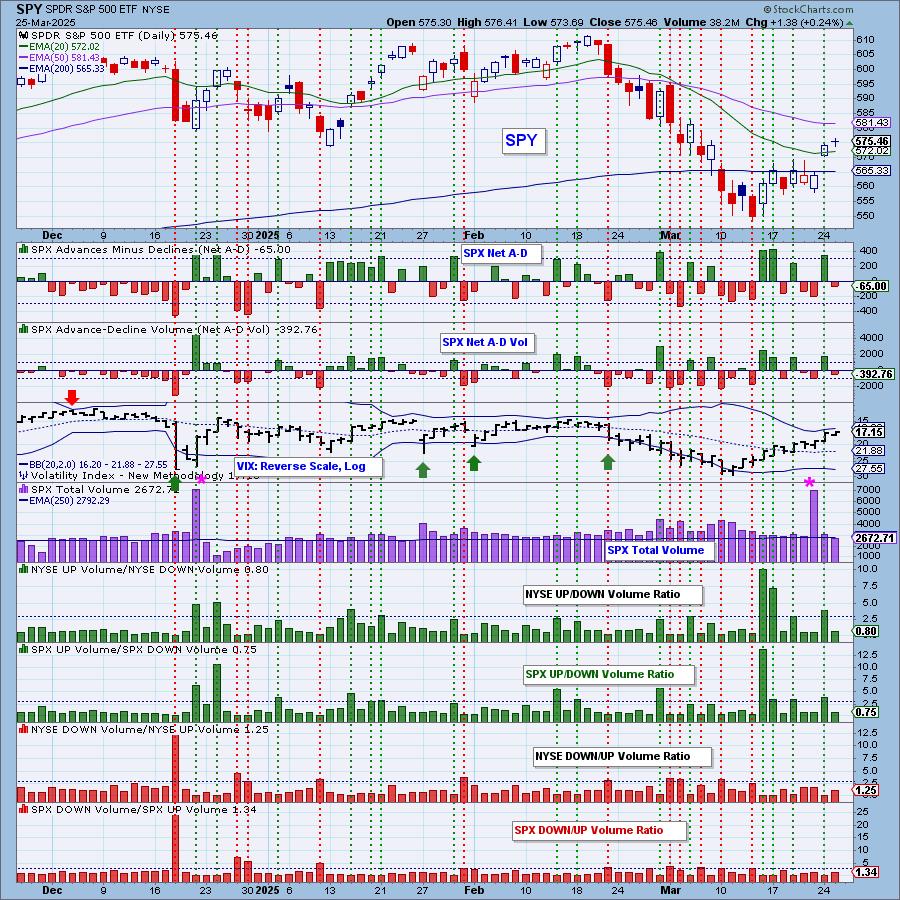
*A climax is a one-day event when market action generates very high readings in, primarily, breadth and volume indicators. We also include the VIX, watching for it to penetrate outside the Bollinger Band envelope. The vertical dotted lines mark climax days -- red for downside climaxes, and green for upside. Climaxes are at their core exhaustion events; however, at price pivots they may be initiating a change of trend.
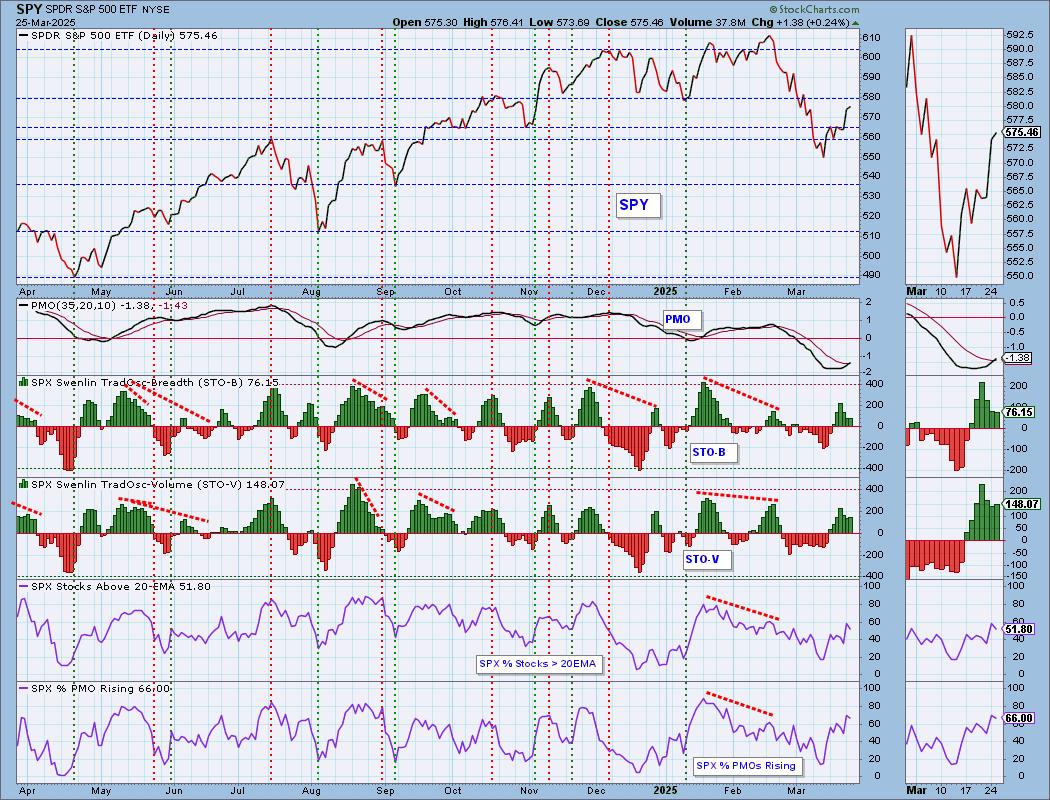
Short-Term Market Indicators: The short-term market trend is UP and the condition is NEUTRAL.
The Swenlin Trading Oscillators (STOs) are mixed as today the STO-V turned up while the STO-B continued to move lower. This isn't much of a vote of confidence. Participation slid somewhat and while %PMOs Rising fell today, we note that 2/3rds of the index show rising momentum and that is healthy.
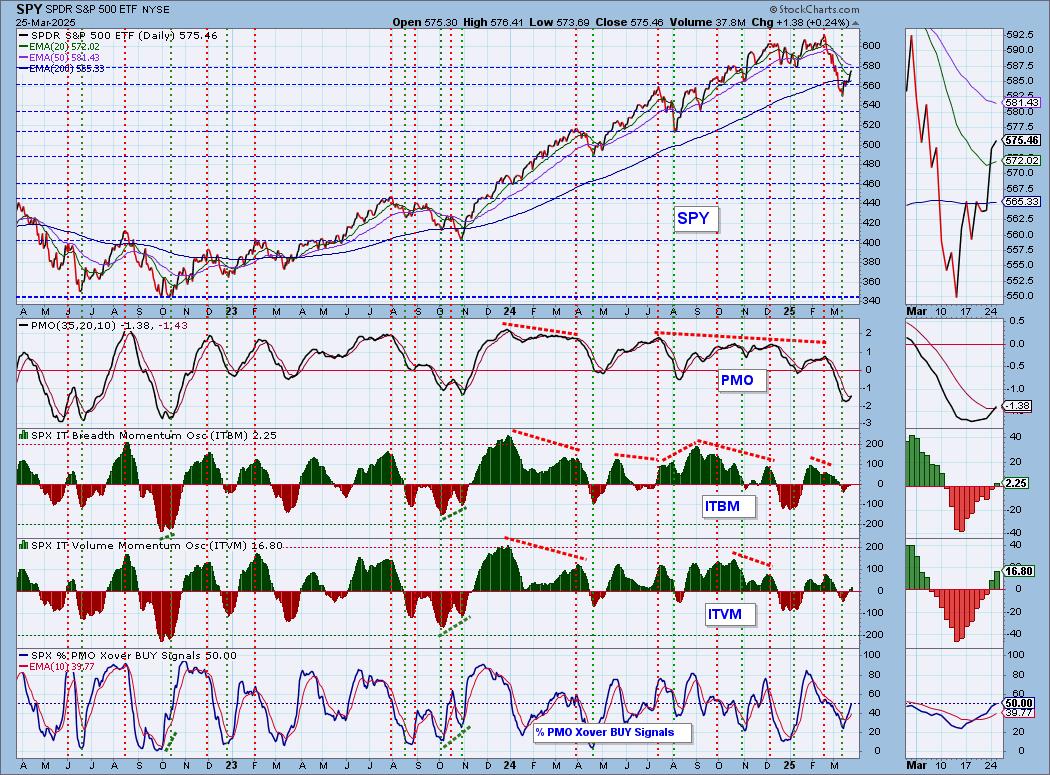
Intermediate-Term Market Indicators: The intermediate-term market trend is DOWN and the condition is NEUTRAL.
We're still listing the intermediate-term trend as DOWN given the rising bottoms trendline out of the November low was broken, however with price inching its way back up, we can draw less steep rising bottoms trendlines. We'll likely change the trend to UP shortly. The ITBM and ITVM both are rising which is bullish for the intermediate term. We now have half of the index holding PMO BUY Signals.
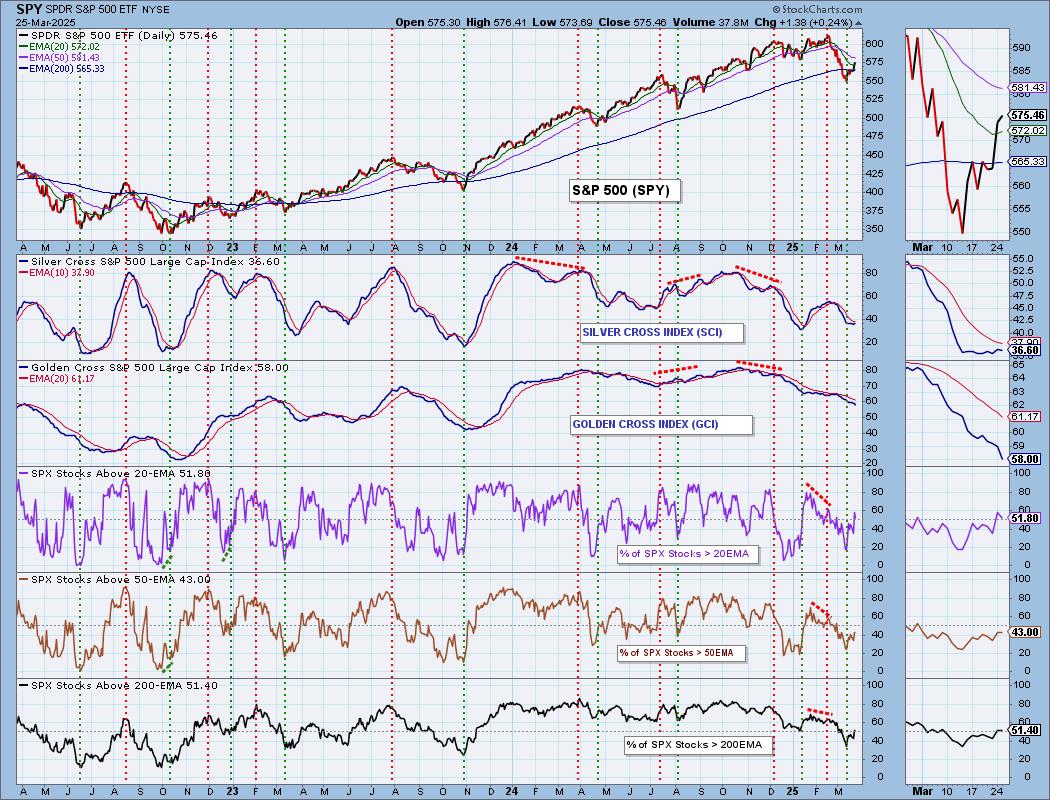
PARTICIPATION CHART (S&P 500): The following chart objectively shows the depth and trend of participation for the SPX in two time frames.
- Intermediate-Term - the Silver Cross Index (SCI) shows the percentage of SPX stocks on IT Trend Model BUY signals (20-EMA > 50-EMA). The opposite of the Silver Cross is a "Dark Cross" -- those stocks are, at the very least, in a correction.
- Long-Term - the Golden Cross Index (GCI) shows the percentage of SPX stocks on LT Trend Model BUY signals (50-EMA > 200-EMA). The opposite of a Golden Cross is the "Death Cross" -- those stocks are in a bear market.
The market bias is BEARISH in the intermediate and long terms.
Participation could be better. The Silver Cross Index is reading very low at 37%. It has the opportunity to turn back up given we have more stocks above their 50-day EMA than Silver Crosses. So far it has been flat. It is below its signal line so the IT Bias is BEARISH. The Golden Cross Index continues to move lower and should move lower in the future given less stocks are above their 200-day EMA versus Golden Crosses. It is below its signal line so the LT Bias remains BEARISH.
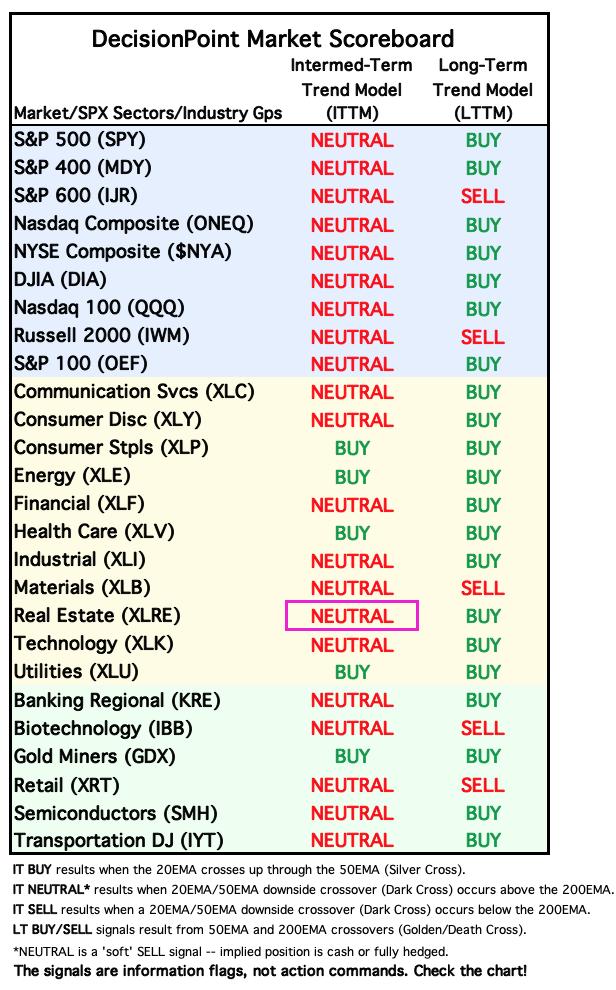
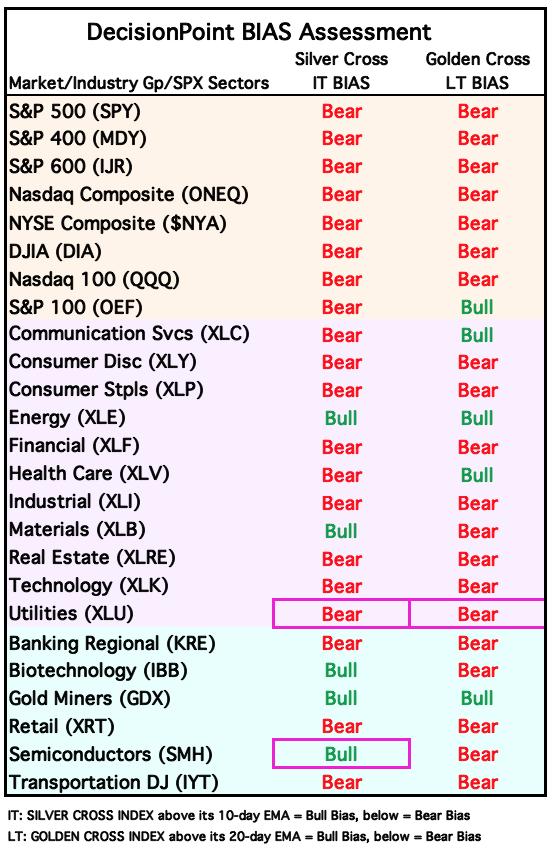
BIAS Assessment: The following table expresses the current BIAS of various price indexes based upon the relationship of the Silver Cross Index to its 10-day EMA (intermediate-term), and of the Golden Cross Index to its 20-day EMA (long-term). When the Index is above the EMA it is bullish, and it is bearish when the Index is below the EMA. The BIAS does not imply that any particular action should be taken. It is information to be used in the decision process.
The items with highlighted borders indicate that the BIAS changed today.
*****************************************************************************************************
CONCLUSION: Mega-caps are outperforming right now and that is keeping the market elevated. The relative strength line continues to rise against equal-weight RSP and this condition is typically good for the market. Yesterday's upside exhaustion climax didn't result in a decline, but price action was lackluster considering the thrust we saw yesterday. We still see a possible bear flag on the SPY meaning this could just turn out to be a bear market rally not a new move to all-time highs. Given tariffs are still to come and the word "recession" has found its way back into the conversation, we won't be surprised if this rally fails. We need a heavy dose of caution right now.
Erin is 40% long, 0% short. (This is intended as information, not a recommendation.)
*****************************************************************************************************
CALENDAR

Have you subscribed the DecisionPoint Diamonds yet? DP does the work for you by providing handpicked stocks/ETFs from exclusive DP scans! Add it with a discount! Contact support@decisionpoint.com for more information!
BITCOIN
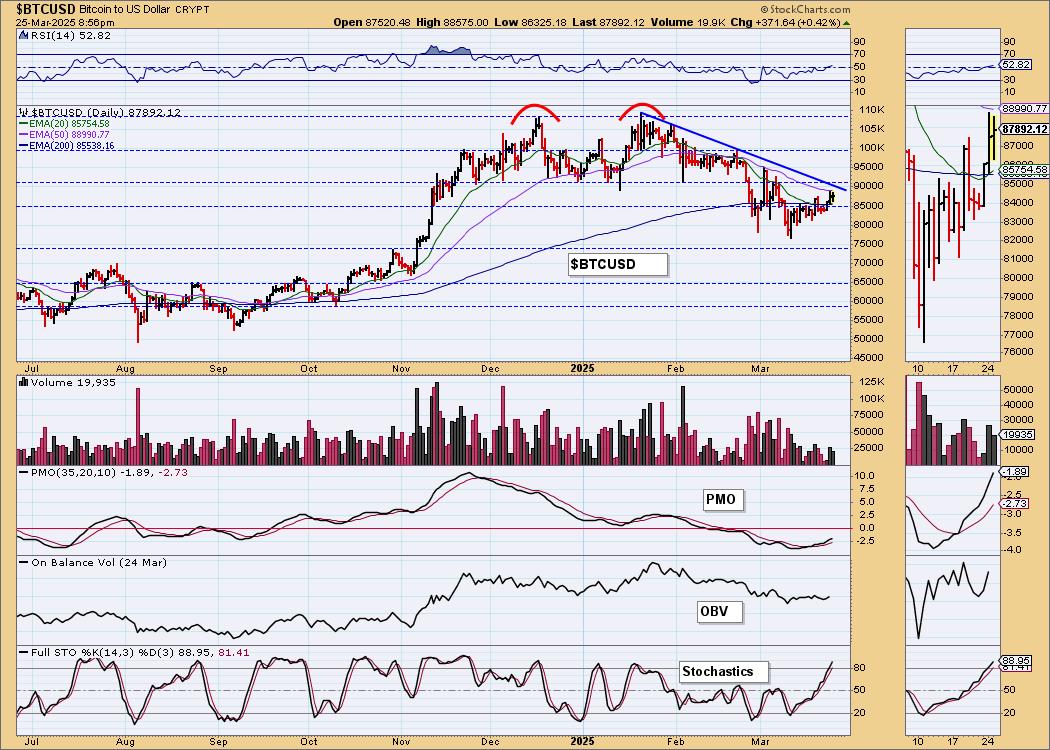
Yesterday's comments still apply:
"This looks like a pretty good rally for Bitcoin, but we are still waiting for the declining tops trendline to be broken. The 50-day EMA is also providing resistance. We like the rising PMO, but it is still negative and could just signal diminishing weakness which would mean another decline possible when the declining tops trendline is hit. Stochastics have moved above 80 so there is some internal strength there. We'll look for higher prices for now."
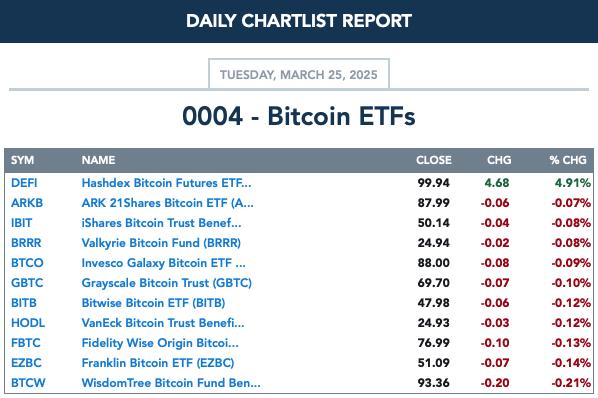
BITCOIN ETFs
INTEREST RATES
Long-term yields still hold rising trends that look bullish, while short-term rates are moving mostly sideways. Declining trends are currently winning but we are cautiously bullish on yields in the long term.
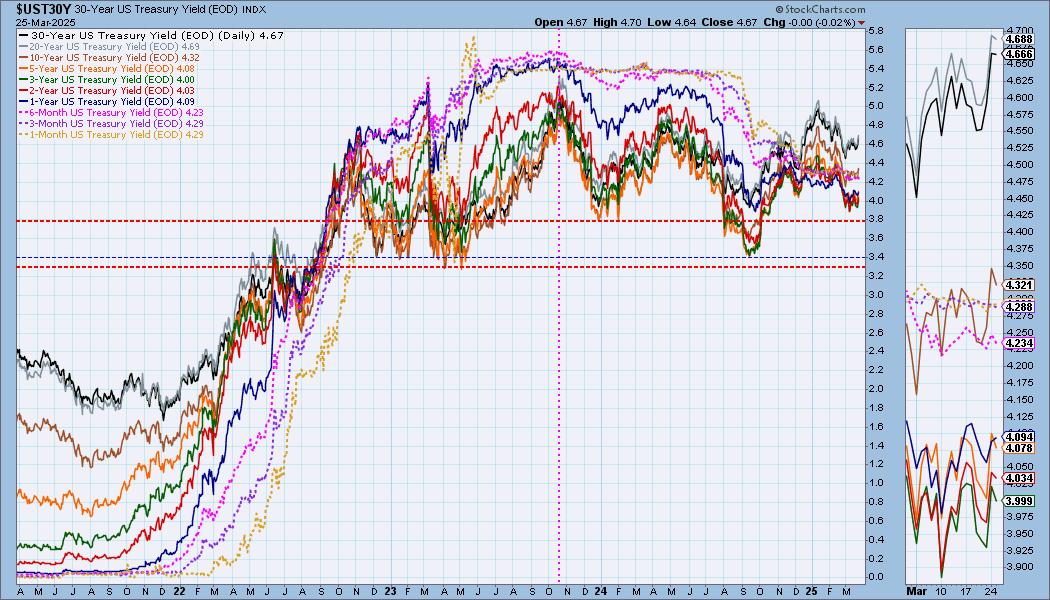
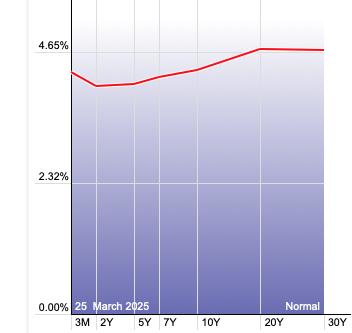
The Yield Curve Chart from StockCharts.com shows us the inversions taking place. The red line should move higher from left to right. Inversions are occurring where it moves downward.
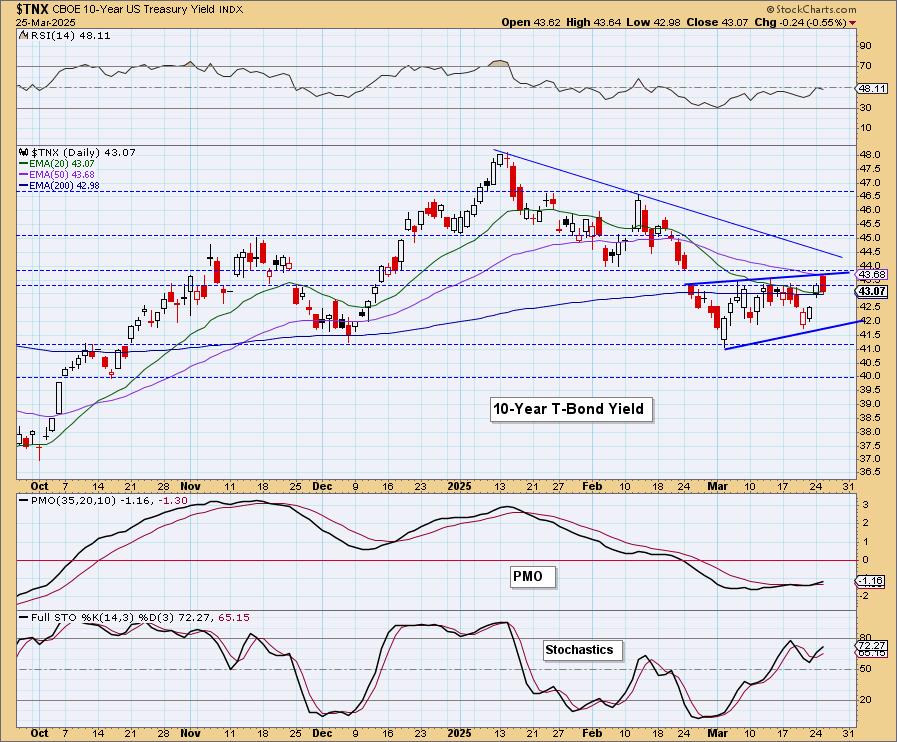
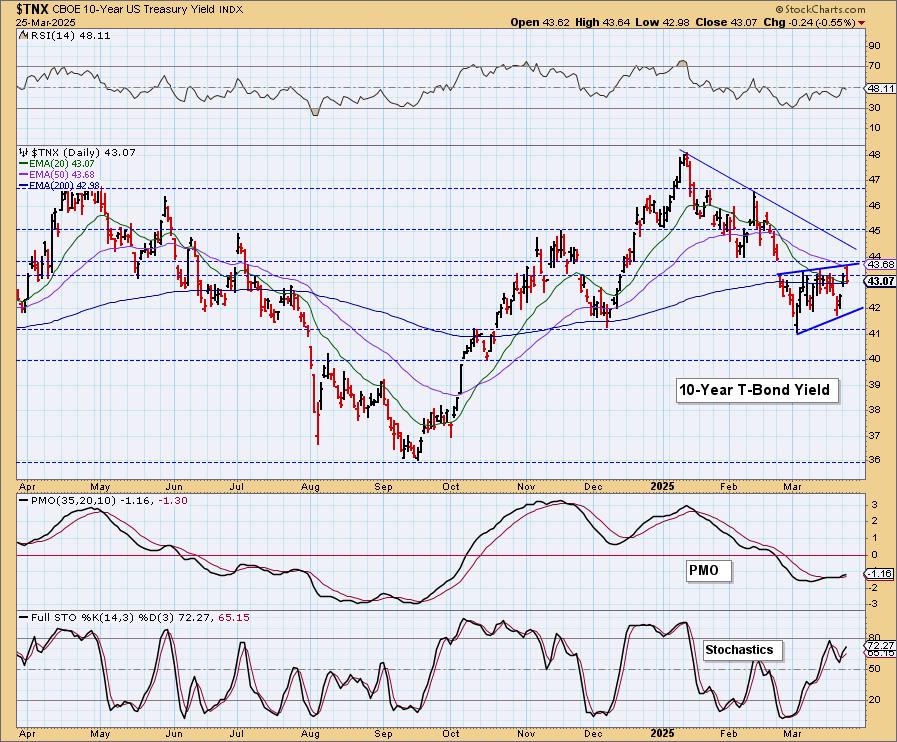
10-YEAR T-BOND YIELD
We've cleaned up the $TNX chart annotations. We see the intermediate-term declining trend still in force and now we have a bearish rising wedge that does imply we'll see a breakdown in the yield. For now the rising trend is intact and the PMO is rising so we'll see if we get an upside breakout from this pattern. Stochastics also suggest we could see a breakout.
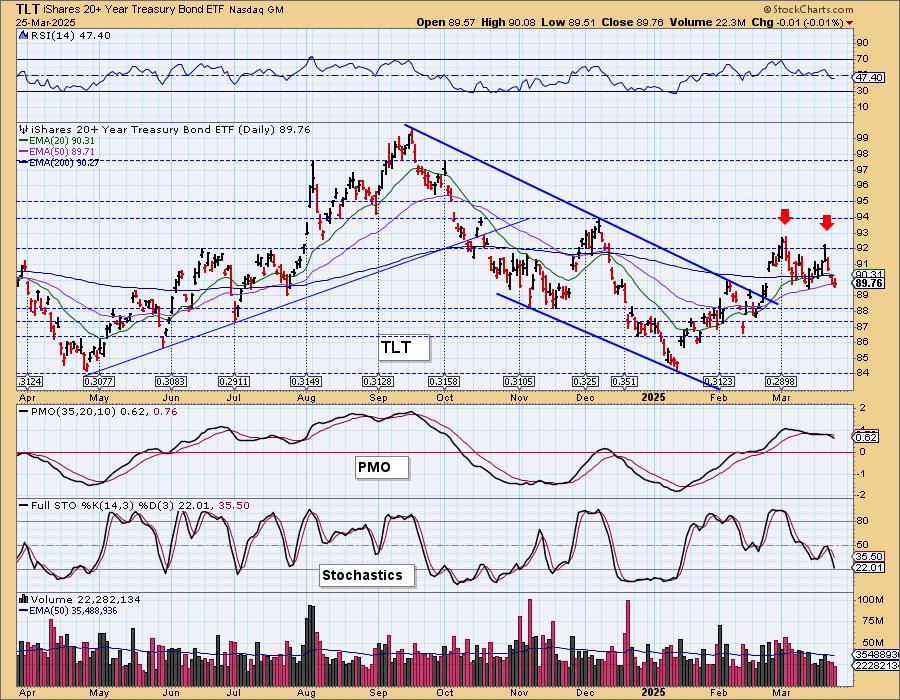
BONDS (TLT)
IT Trend Model: BUY as of 2/25/2025
LT Trend Model: SELL as of 12/13/2024
TLT Daily Chart: Yesterday's comments still apply:
"TLT was looking very good out of the bullish cup with handle but things are beginning to fall apart and we notice that we have a small double top on the right edge of the chart. The PMO has turned lower and Stochastics are falling in negative territory. The 50-day EMA is still holding as support, but we get the sense that Bonds will be heading lower and yields will be heading higher."
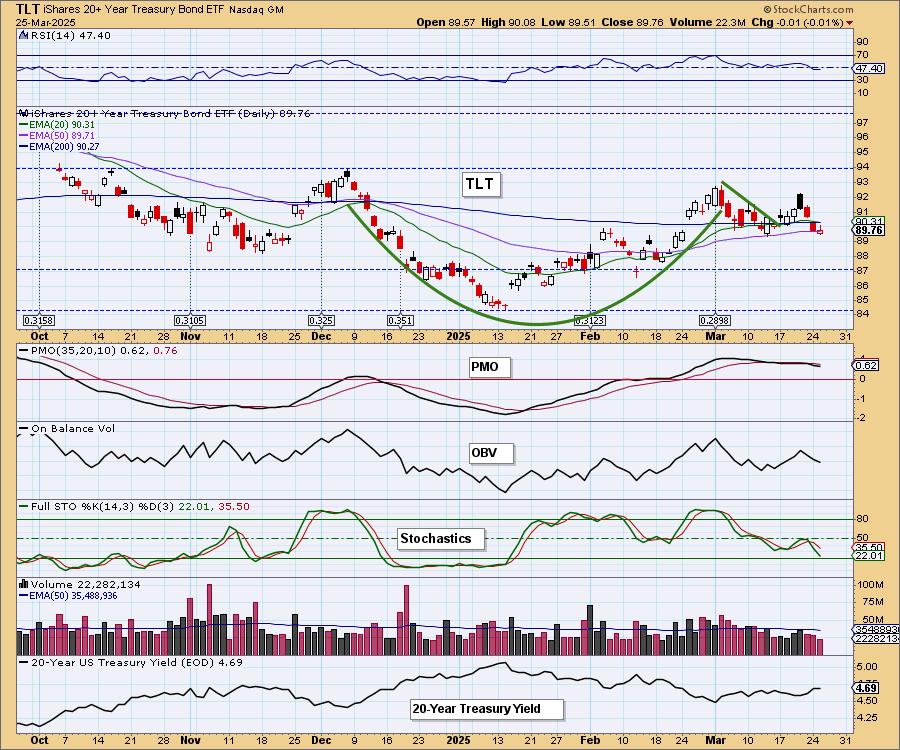
Here's the double top annotated.
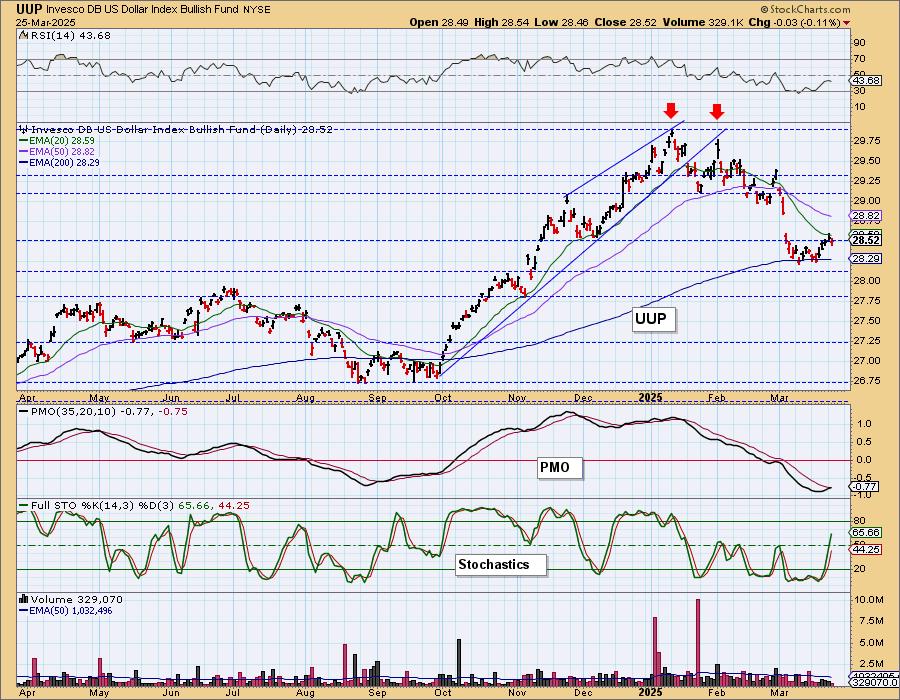
DOLLAR (UUP)
IT Trend Model: NEUTRAL as of 3/5/2025
LT Trend Model: BUY as of 5/25/2023
UUP Daily Chart: The Dollar hit gap resistance and was turned away. We still see that small double bottom reversal pattern that would suggest a breakout ahead. The PMO is nearing a Crossover BUY Signal, but it is still very negative so we could just have diminishing weakness and not new strength. It's early, but given rising Stochastics we are looking for the Dollar to rally.
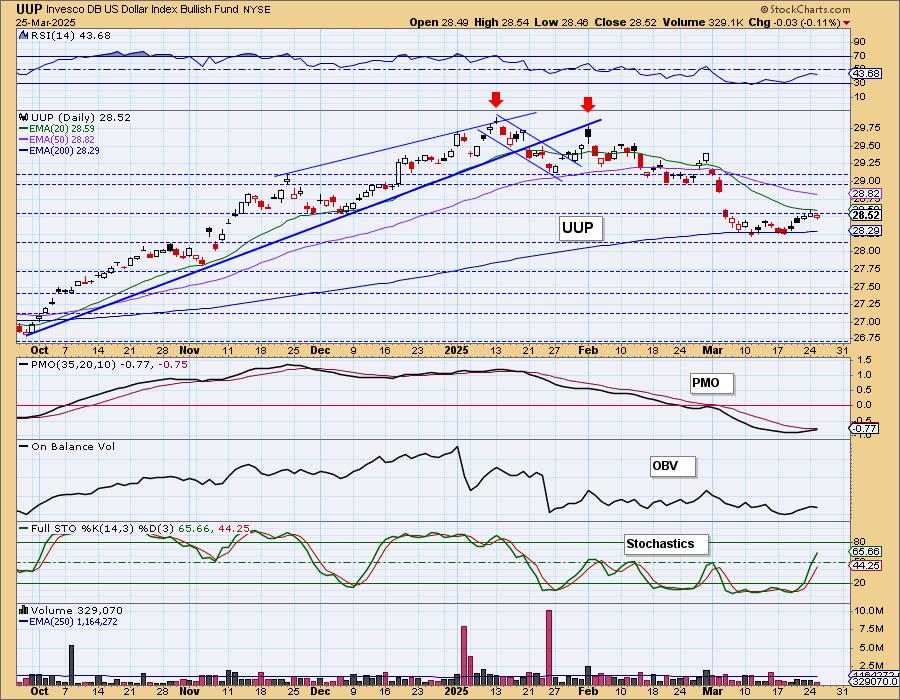
We can see the small double bottom formation that has developed.
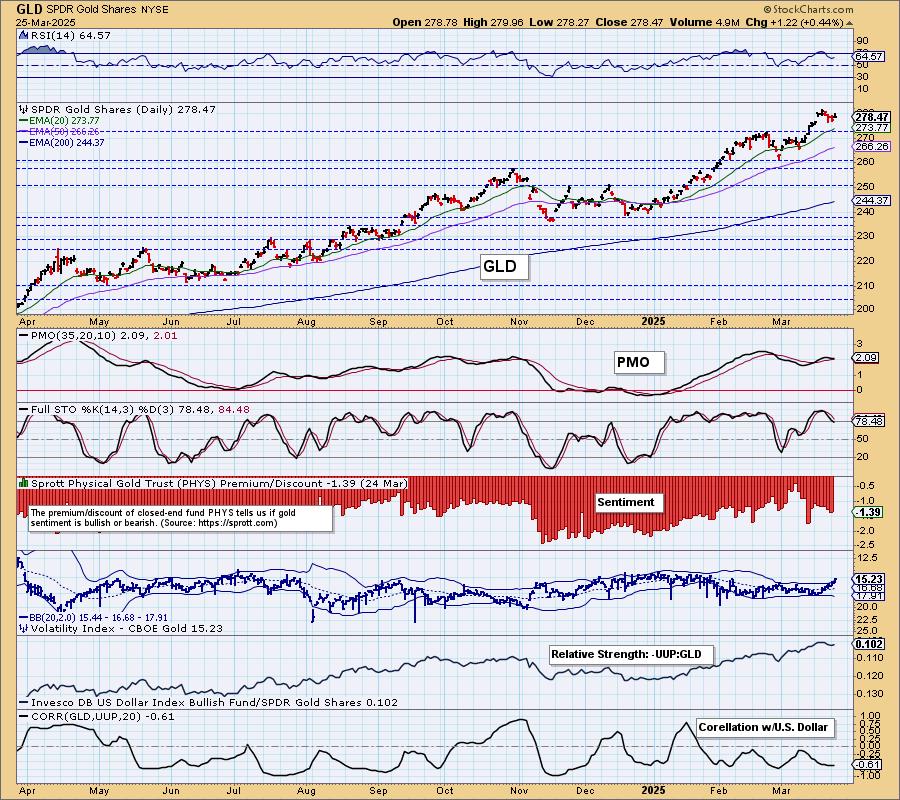
GOLD
IT Trend Model: BUY as of 1/10/2025
LT Trend Model: BUY as of 10/20/2023
GLD Daily Chart: Gold has formed a bull flag and we did see a tiny breakout today. We still see Gold as needing more pause or pullback right now. The PMO is declining toward a SELL Signal. We also note that the Gold Volatility Index ($GVZ) has punctured the upper Bollinger Band. That condition will often lead to price declines. Look for lower prices in the short term or sideways churn. The long-term picture is still very bullish for Gold.
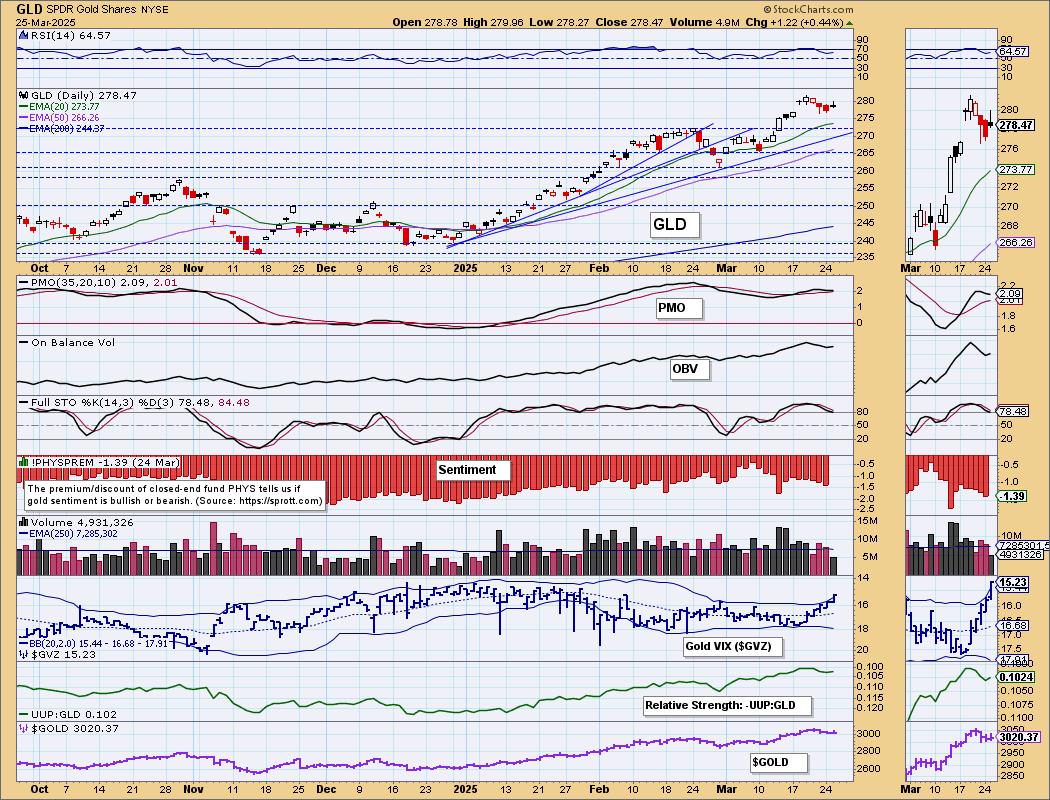
Discounts have gotten higher meaning investors are more bearish on Gold right now. That would play right into a decline for Gold.
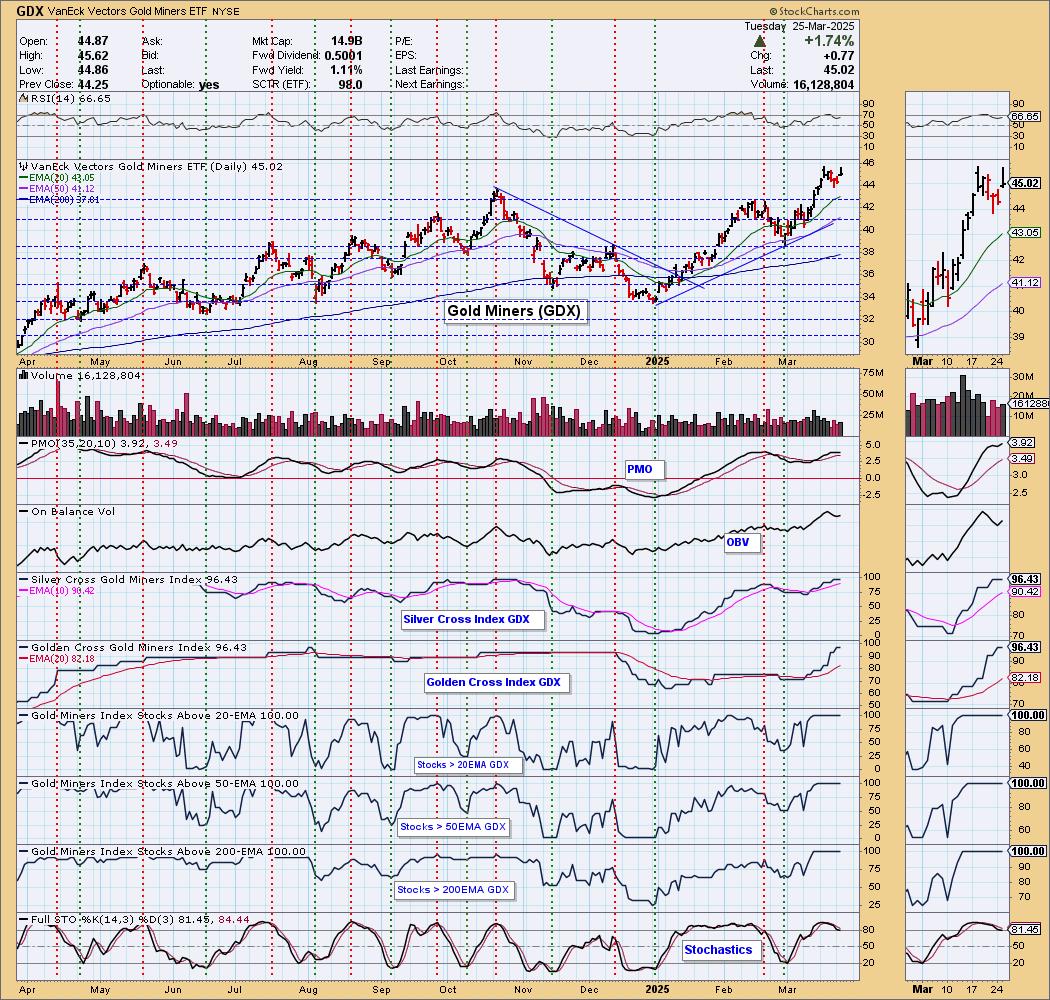
GOLD MINERS (GDX) Daily Chart: Gold Miners had a great day but formed a bearish shooting star on today's OHLC bar. The long wick is the problem for today's bar. As with Gold this does look like a bull flag in the making, but we expect the flag will continue to form on more pullback out of overbought conditions. Participation is incredibly strong so at this point we don't expect to see a huge decline. There is incredible internal strength here.
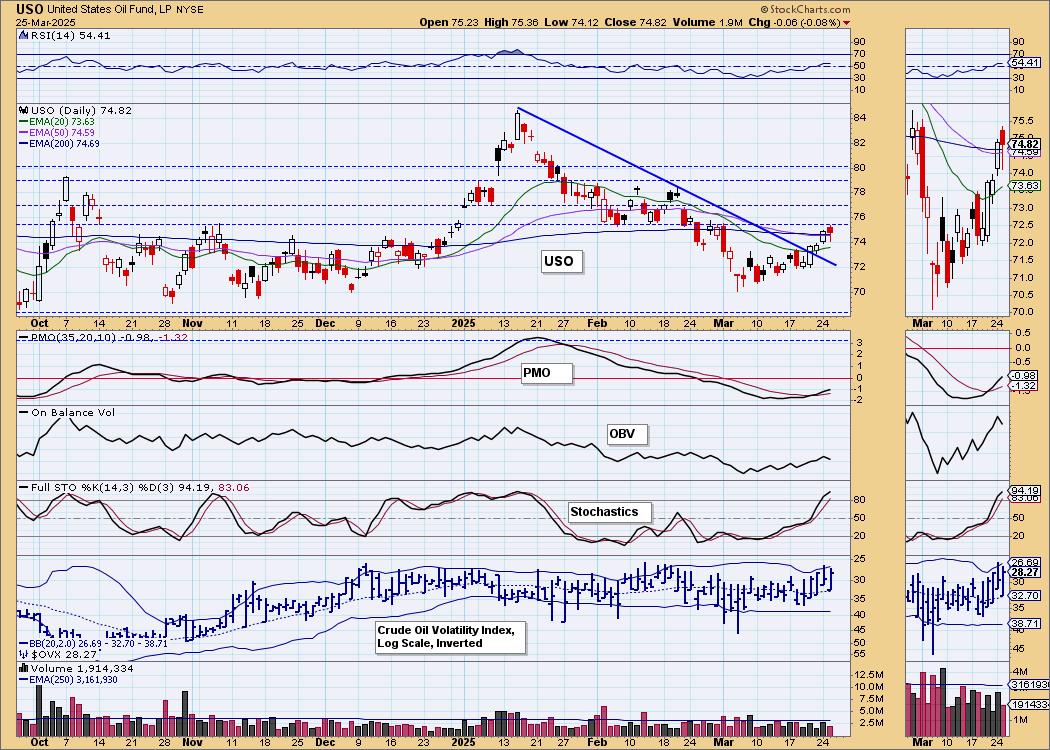
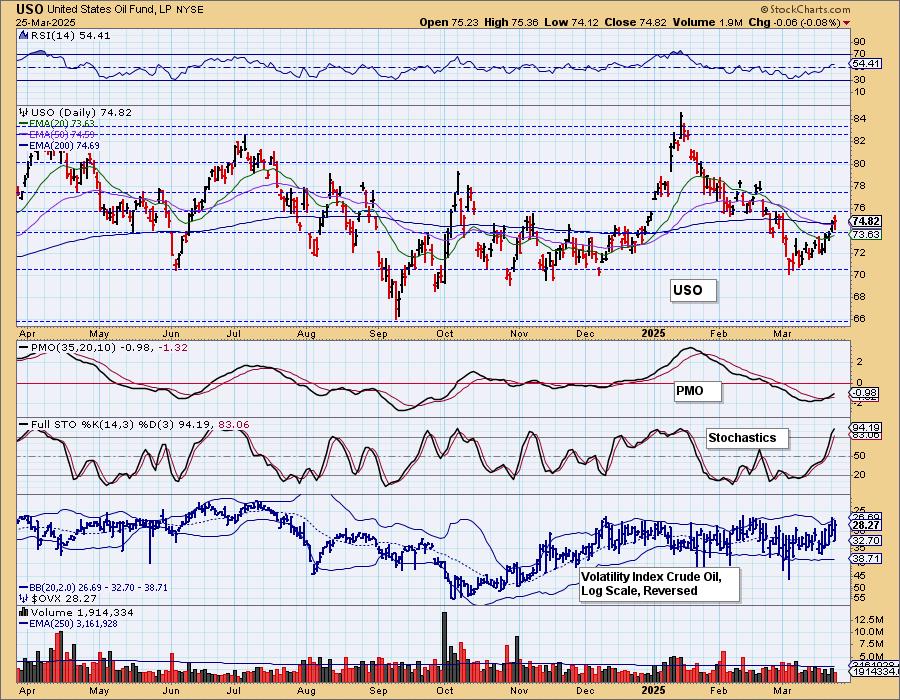
CRUDE OIL (USO)
IT Trend Model: NEUTRAL as of 2/27/2025
LT Trend Model: SELL as of 3/18/2025
USO Daily Chart: Crude Oil was down on the day, but did set a higher high and a higher low. Overhead resistance has now been met. It made it above the 200-day EMA and the PMO is rising nicely with Stochastics above 80. We think we could see some more upside movement out of Crude. We'll know more when we see how it deals with current horizontal resistance, but for now we are cautiously bullish.
Good Luck & Good Trading!
Erin Swenlin and Carl Swenlin
Technical Analysis is a windsock, not a crystal ball. --Carl Swenlin
(c) Copyright 2025 DecisionPoint.com
Disclaimer: This blog is for educational purposes only and should not be construed as financial advice. The ideas and strategies should never be used without first assessing your own personal and financial situation, or without consulting a financial professional. Any opinions expressed herein are solely those of the author, and do not in any way represent the views or opinions of any other person or entity.
DecisionPoint is not a registered investment advisor. Investment and trading decisions are solely your responsibility. DecisionPoint newsletters, blogs or website materials should NOT be interpreted as a recommendation or solicitation to buy or sell any security or to take any specific action.
NOTE: The signal status reported herein is based upon mechanical trading model signals, specifically, the DecisionPoint Trend Model. They define the implied bias of the price index based upon moving average relationships, but they do not necessarily call for a specific action. They are information flags that should prompt chart review. Further, they do not call for continuous buying or selling during the life of the signal. For example, a BUY signal will probably (but not necessarily) return the best results if action is taken soon after the signal is generated. Additional opportunities for buying may be found as price zigzags higher, but the trader must look for optimum entry points. Conversely, exit points to preserve gains (or minimize losses) may be evident before the model mechanically closes the signal.
Helpful DecisionPoint Links:
DecisionPoint Alert Chart List
DecisionPoint Golden Cross/Silver Cross Index Chart List
DecisionPoint Sector Chart List
Price Momentum Oscillator (PMO)