
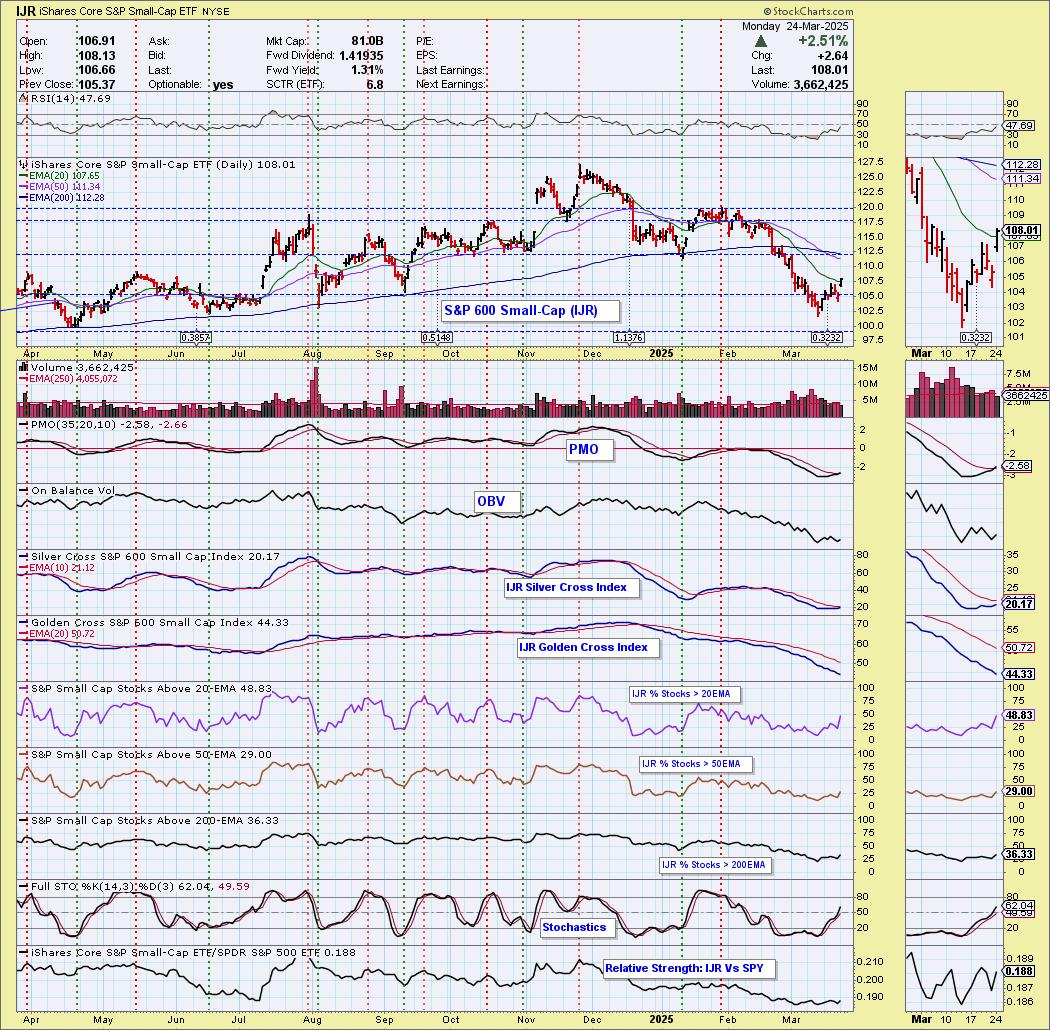
It wasn't the SPY or the Nasdaq that had the best finish, of all the indexes we follow the Small-Caps SP600 (IJR) had the best rally finishing up over 2.5%. This actually made quite a difference on %Stocks > 20EMA which moved up sharply. Stochastics are rising vertically now and there is a new PMO Crossover BUY Signal. Overhead resistance is nearing at the 200-day EMA but this looks like we will get some upside followthrough.
The DecisionPoint Alert Weekly Wrap presents an end-of-week assessment of the trend and condition of the Stock Market, the U.S. Dollar, Gold, Crude Oil, and Bonds. The DecisionPoint Alert daily report (Monday through Thursday) is abbreviated and gives updates on the Weekly Wrap assessments.
Watch the latest episode of DecisionPoint on our YouTube channel here!
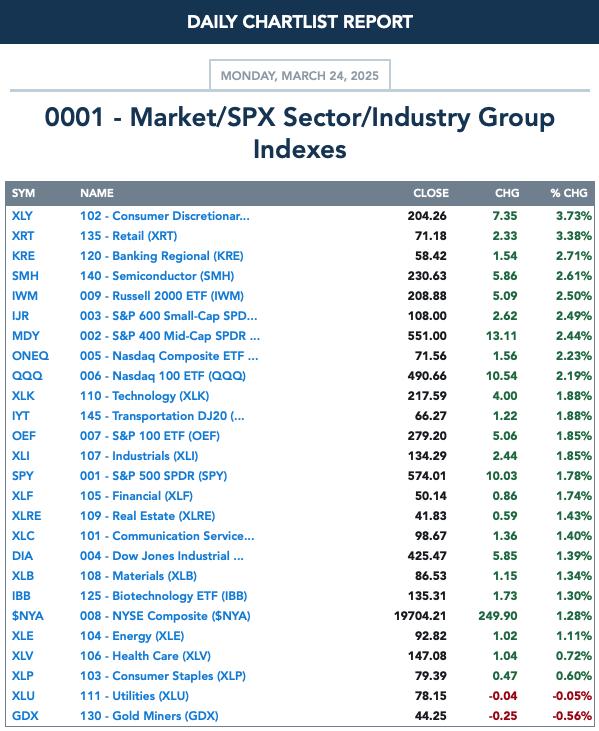
MARKET/INDUSTRY GROUP/SECTOR INDEXES
CLICK HERE for Carl's annotated Market Index, Sector, and Industry Group charts.
THE MARKET (S&P 500)
IT Trend Model: NEUTRAL as of 3/4/2025
LT Trend Model: BUY as of 3/29/2023
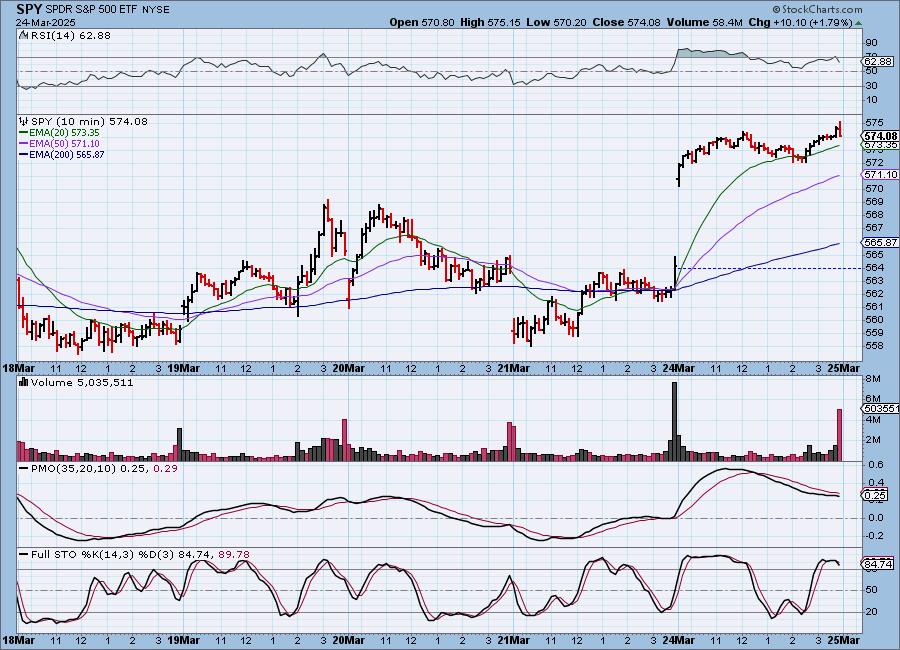
SPY 10-Minute Chart: It was determined over the weekend that the upcoming tariffs were narrowing and negotiations are going strong to avoid many of them. This was welcomed by the market which saw a gap up on the open and higher prices to finish the day. The 10-minute PMO doesn't look particularly bullish and Stochastics have turned down.
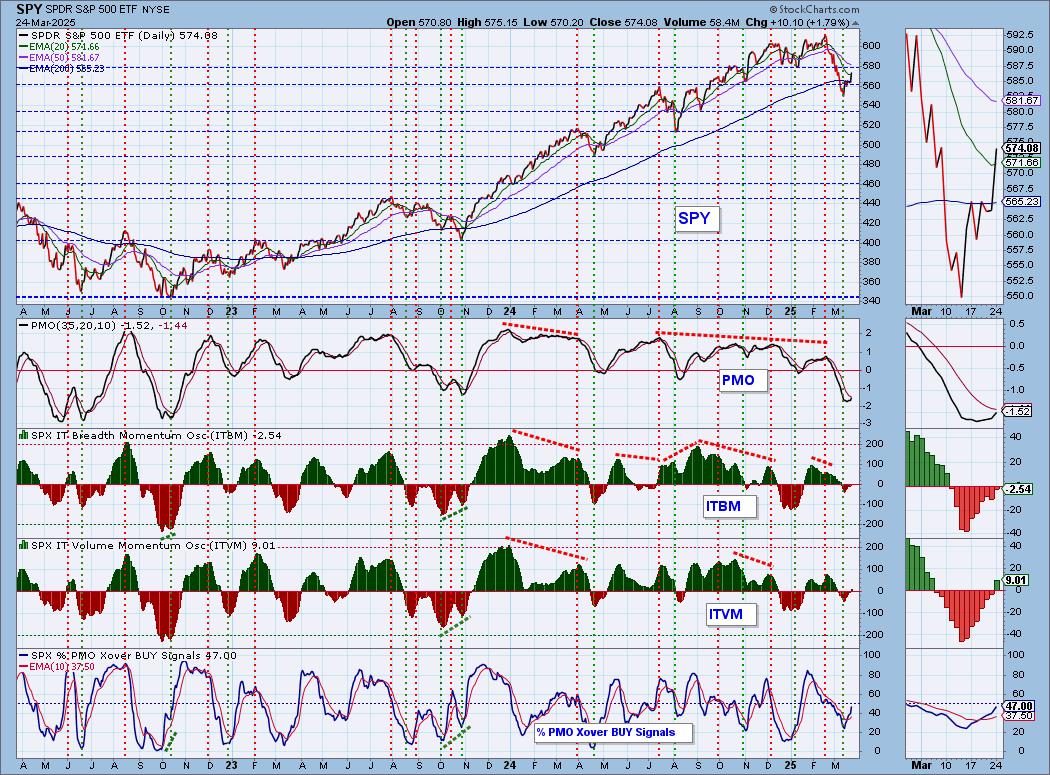
SPY Daily Chart: We saw a solid breakout from the recent declining tops trendline. Price rallied to overhead resistance at the January low. The PMO is rising again and is nearing a Crossover BUY Signal. We aren't ready to call the bear flag busted as this could just be extension of the flag.
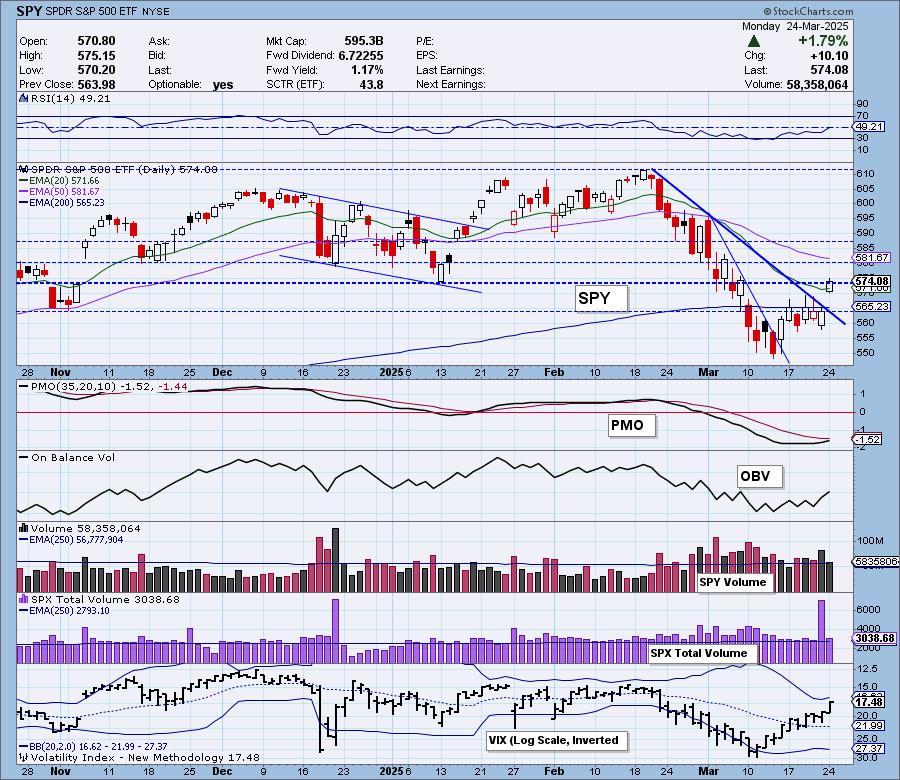
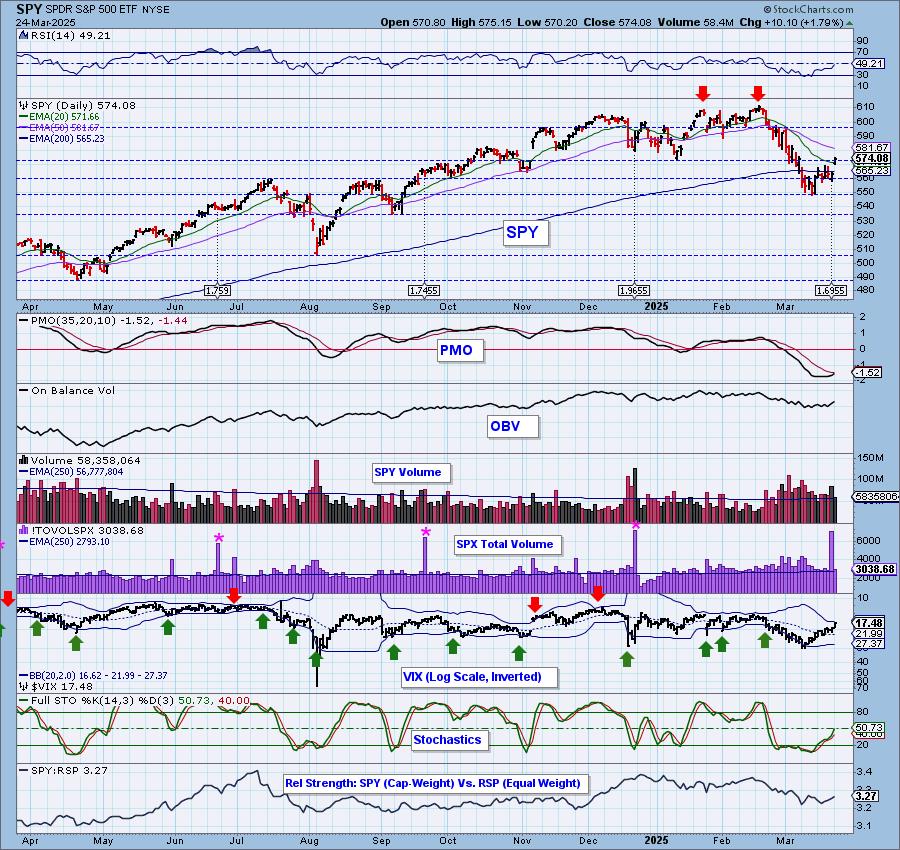
The VIX is getting close to its upper Bollinger Band on the inverted scale. This is not welcome as punctures of the upper Band often lead to declines. Still we must say that it looks healthy above its moving average. Stochastics are rising vertically and implying more upside ahead.

Here is the latest recording from 3/24. Click HERE to get to our video list.:
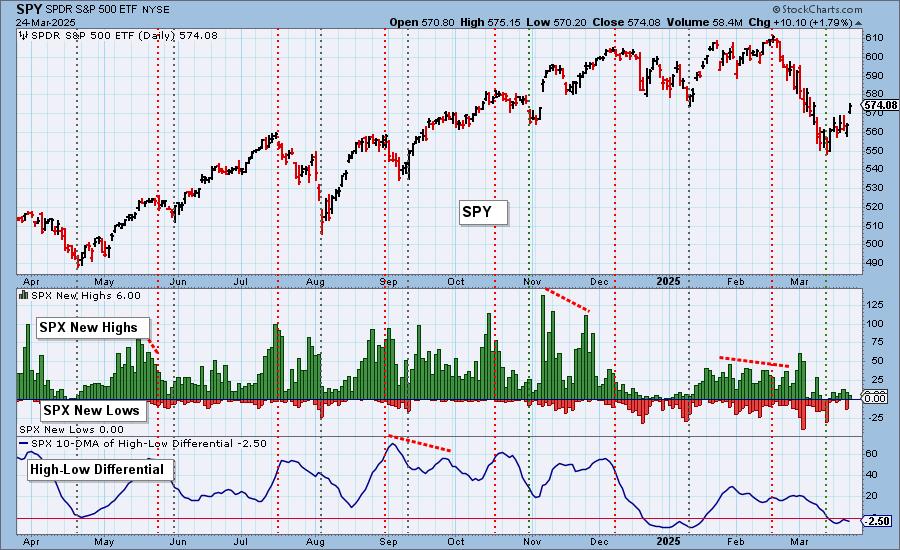
S&P 500 New 52-Week Highs/Lows: New Highs contracted on the rally which isn't good, but at the same time we saw no New Lows. Unfortunately, the High-Low Differential topped beneath the zero line which is especially bearish.
Climax* Analysis: There were unanimous climax readings on the four relevant indicators, so we have another upside exhaustion climax. SPX Total Volume was only slightly above the one-year daily average volume (the fourth consecutive upside climax with average volume), which makes us think bear market rally.
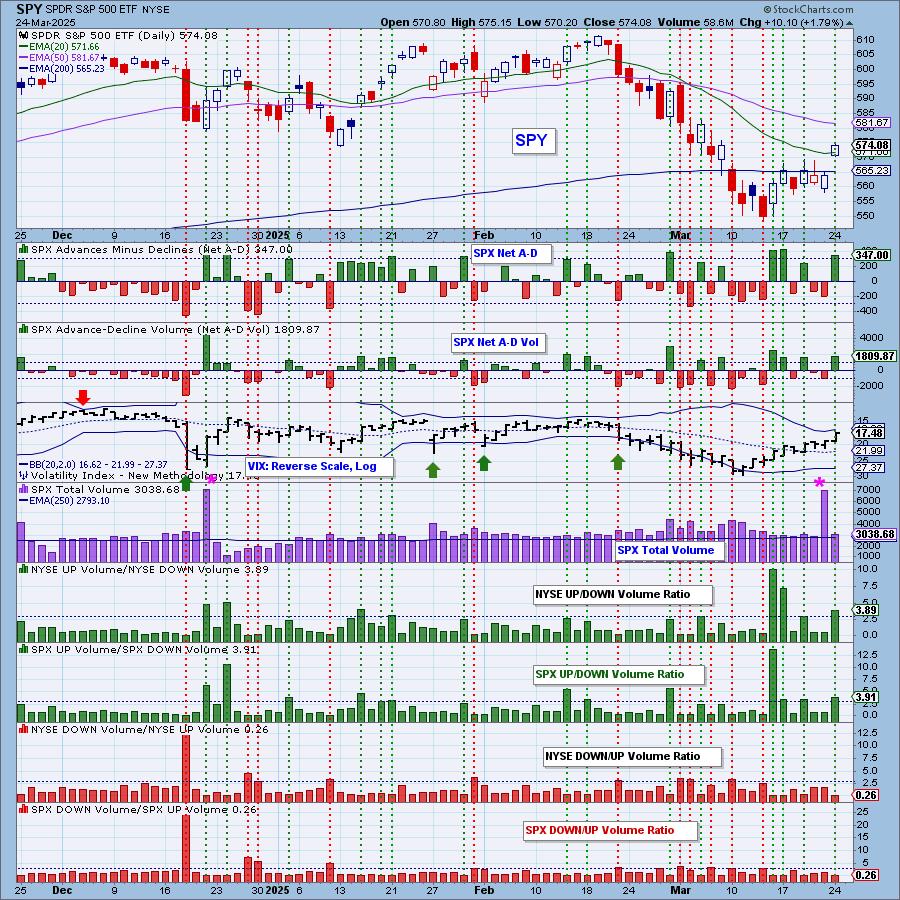
*A climax is a one-day event when market action generates very high readings in, primarily, breadth and volume indicators. We also include the VIX, watching for it to penetrate outside the Bollinger Band envelope. The vertical dotted lines mark climax days -- red for downside climaxes, and green for upside. Climaxes are at their core exhaustion events; however, at price pivots they may be initiating a change of trend.
Short-Term Market Indicators: The short-term market trend is UP and the condition is NEUTRAL.
The Swenlin Trading Oscillators (STOs) are back in neutral territory as they declined again today which doesn't bode well for a rally continuation. At the same time we did see a large number of stocks move above their 20-day EMAs and we have far more rising PMOs now. Both of those indicators are above our bullish 50% threshold.
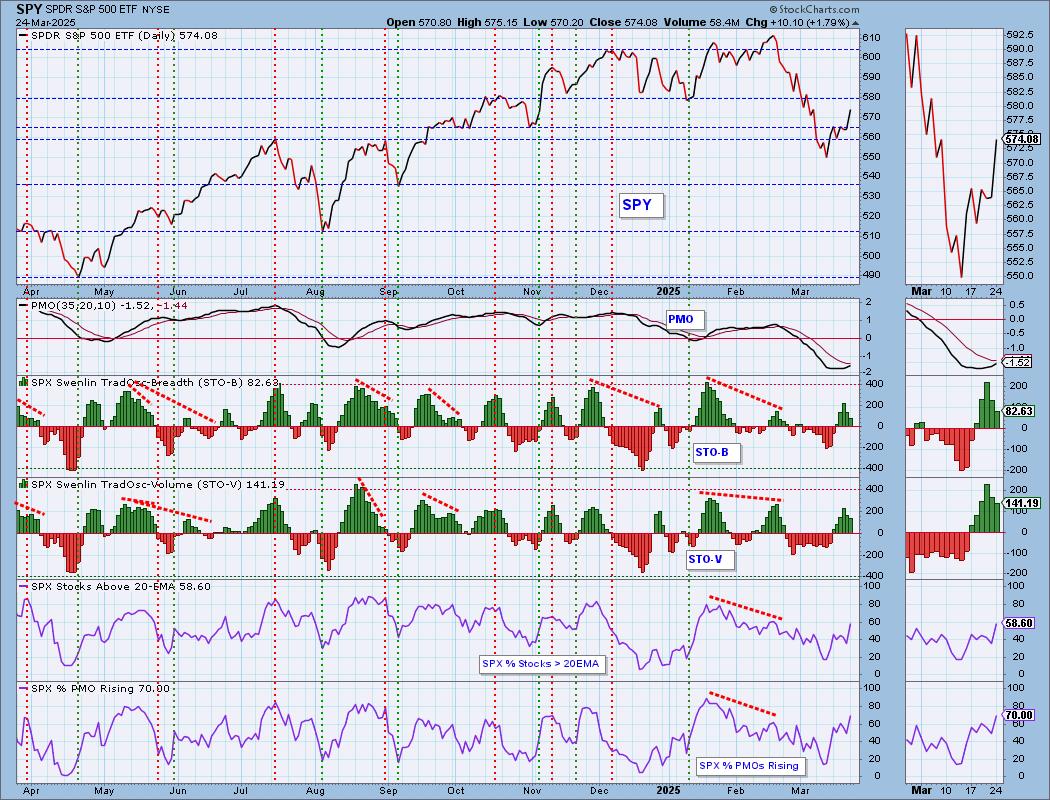
Intermediate-Term Market Indicators: The intermediate-term market trend is DOWN and the condition is NEUTRAL.
STOs may be falling, but fortunately the ITBM and ITVM are still rising with the ITVM hitting positive territory today. %PMO Xover BUY Signals are still expanding and are almost above the bullish 50% threshold. This chart gives us some hope that this isn't a bear market rally and could mean more upside instead.
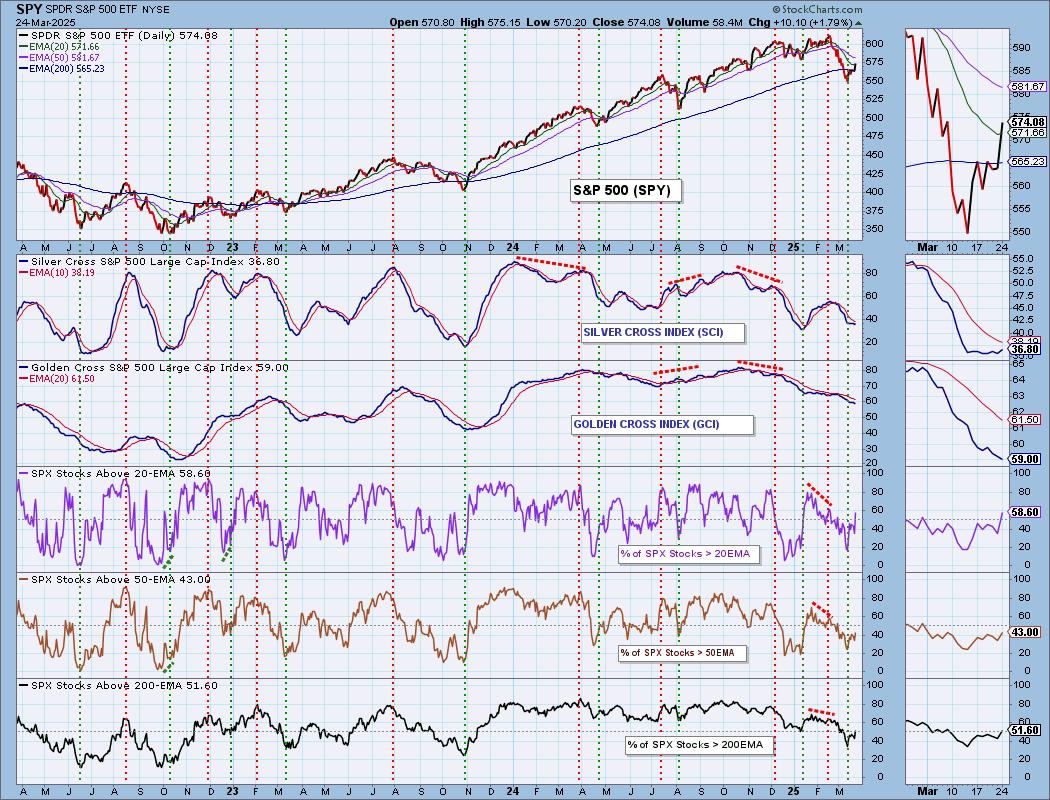
PARTICIPATION CHART (S&P 500): The following chart objectively shows the depth and trend of participation for the SPX in two time frames.
- Intermediate-Term - the Silver Cross Index (SCI) shows the percentage of SPX stocks on IT Trend Model BUY signals (20-EMA > 50-EMA). The opposite of the Silver Cross is a "Dark Cross" -- those stocks are, at the very least, in a correction.
- Long-Term - the Golden Cross Index (GCI) shows the percentage of SPX stocks on LT Trend Model BUY signals (50-EMA > 200-EMA). The opposite of a Golden Cross is the "Death Cross" -- those stocks are in a bear market.
The market bias is BEARISH in the intermediate and long terms.
As noted earlier participation shot higher as far as stocks above their 20-day EMAs. We also saw expansion on other participation indicators as well. The Silver Cross Index has turned back up but because it is below its signal line, the IT Bias is still BEARISH. The Golden Cross Index is in decline and given there are fewer stocks above their 200-day EMA than have Golden Crosses, that indicator will likely continue to move lower. The Golden Cross Index is below its signal line so the LT Bias is BEARISH.
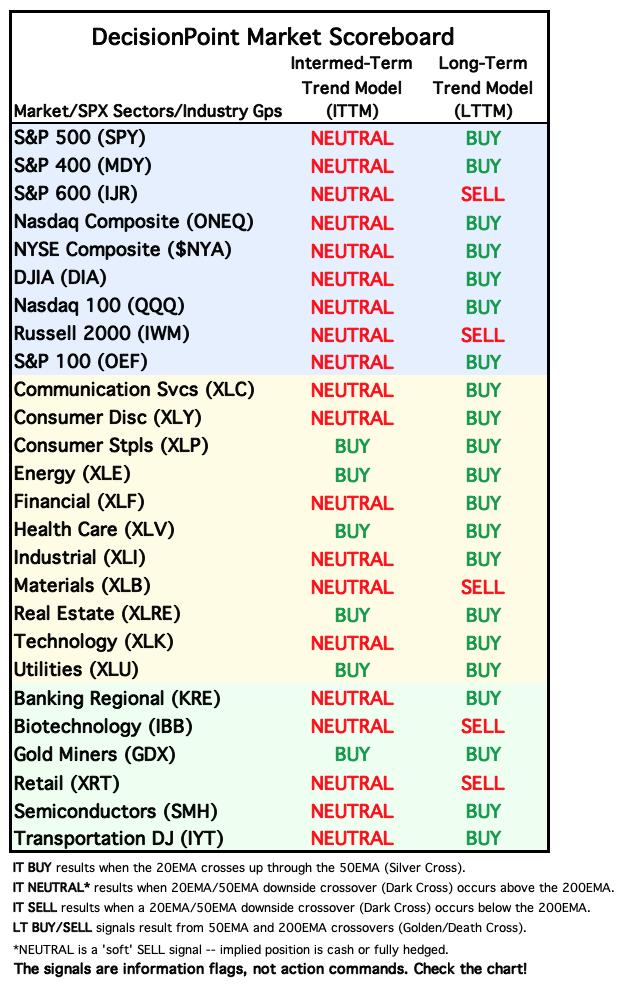
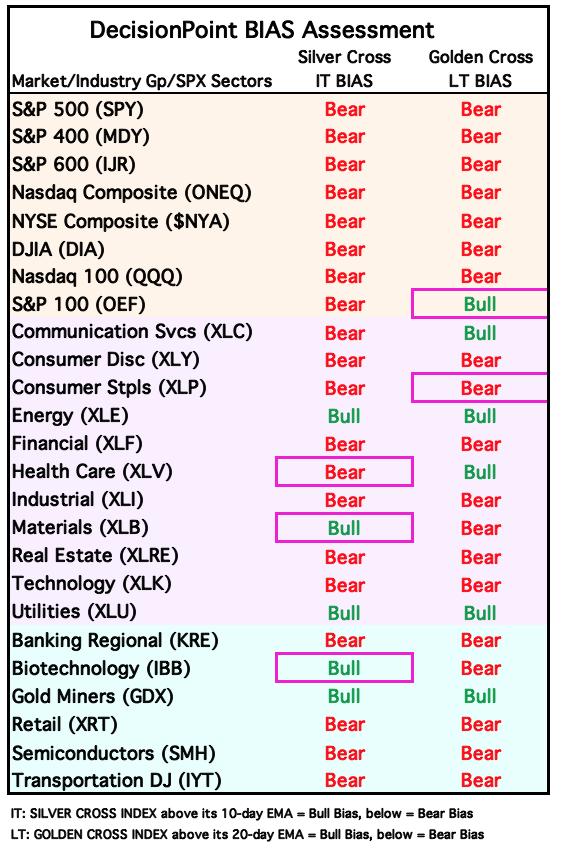
BIAS Assessment: The following table expresses the current BIAS of various price indexes based upon the relationship of the Silver Cross Index to its 10-day EMA (intermediate-term), and of the Golden Cross Index to its 20-day EMA (long-term). When the Index is above the EMA it is bullish, and it is bearish when the Index is below the EMA. The BIAS does not imply that any particular action should be taken. It is information to be used in the decision process.
The items with highlighted borders indicate that the BIAS changed today.
*****************************************************************************************************
CONCLUSION: The market rallied strongly today with all sectors except Utilities seeing expansion. Surprisingly today's rally did not move the STOs higher, they are still declining and the High-Low Differential has topped beneath the zero line. Today saw an upside exhaustion climax that could mean a pullback ahead. While the intermediate-term indicators still look bullish, we aren't comfortable with declining STOs. The 10-minute bar chart PMO and Stochastics look somewhat bearish going into tomorrow's trading. This looks like a good bottom that could see more upside, but we do need to be cautious as bear market rallies often look good before failure. If you are expanding exposure into this rally, be sure and set those stops in case this is a bear market.
Erin is 45% long, 0% short. (This is intended as information, not a recommendation.)
*****************************************************************************************************
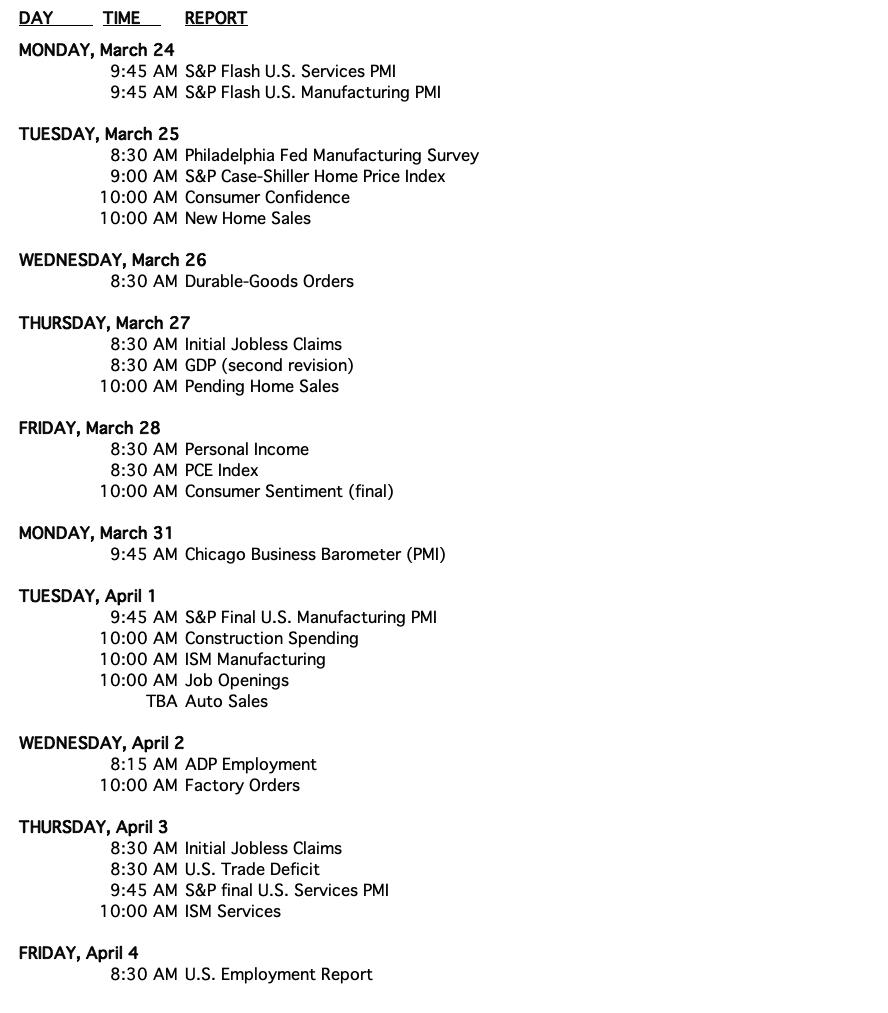
CALENDAR
Have you subscribed the DecisionPoint Diamonds yet? DP does the work for you by providing handpicked stocks/ETFs from exclusive DP scans! Add it with a discount! Contact support@decisionpoint.com for more information!
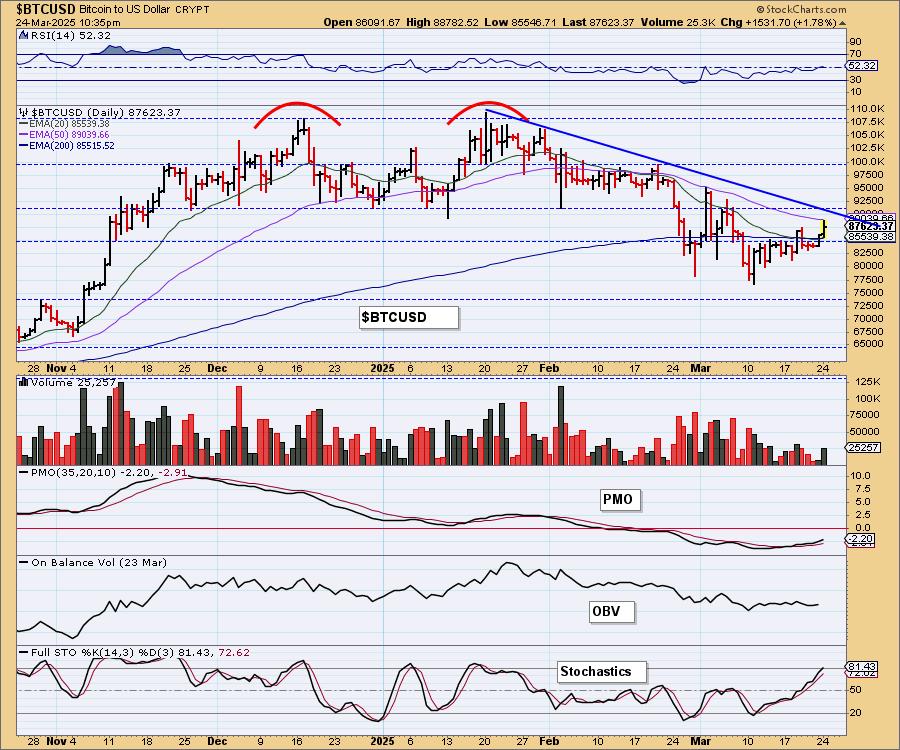
BITCOIN
This looks like a pretty good rally for Bitcoin, but we are still waiting for the declining tops trendline to be broken. The 50-day EMA is also providing resistance. We like the rising PMO, but it is still negative and could just signal diminishing weakness which would mean another decline possibly when the declining tops trendline is hit. Stochastics have moved above 80 so there is some internal strength there. We'll look for higher prices for now.
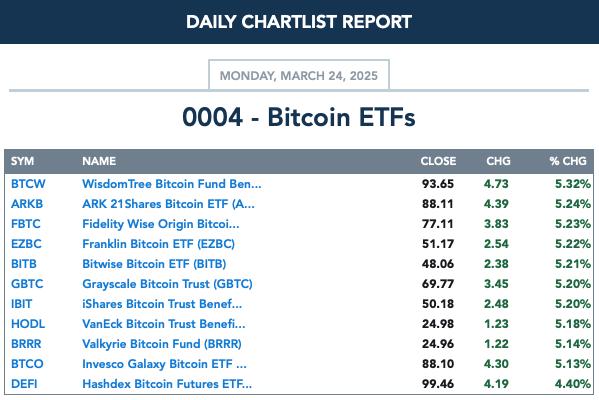
BITCOIN ETFs
INTEREST RATES
We keep thinking that interest rates are destined to fall and yet they are starting to build on some rising trends. Long-term yields look more bullish. Declining trends out of this year's highs are still intact for now.
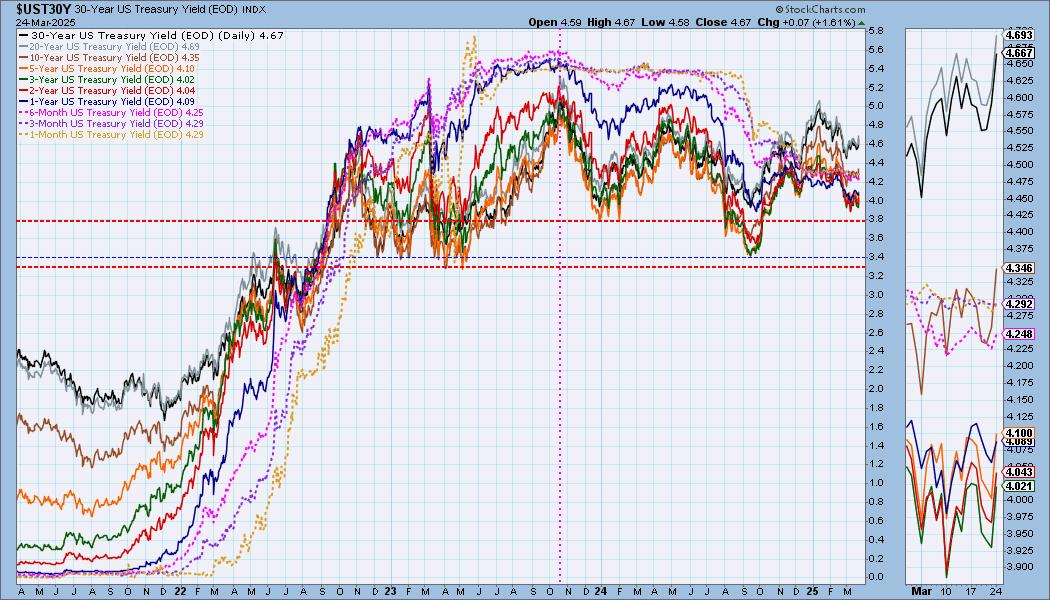
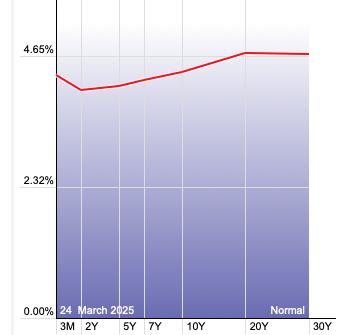
The Yield Curve Chart from StockCharts.com shows us the inversions taking place. The red line should move higher from left to right. Inversions are occurring where it moves downward.
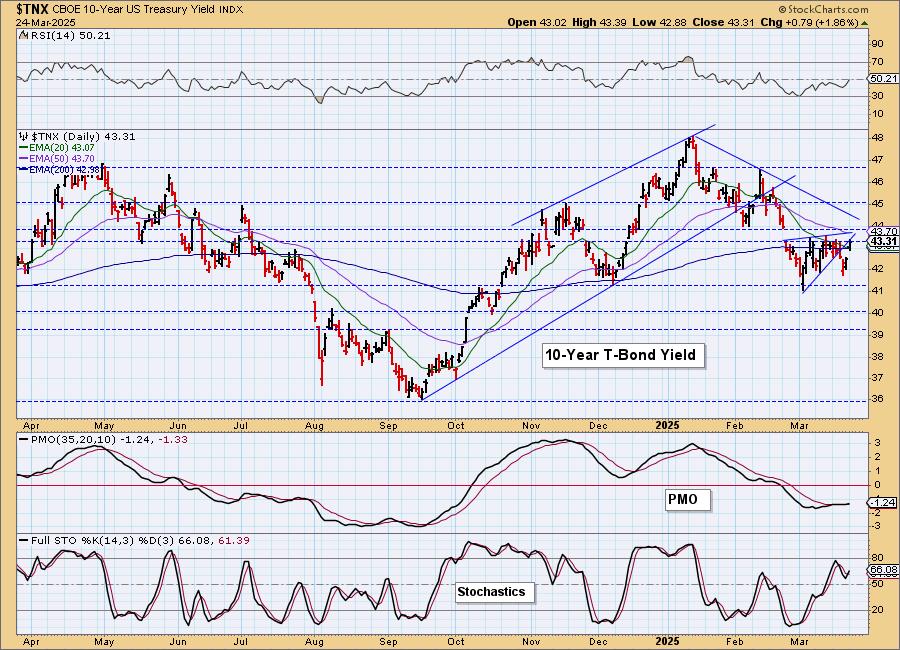
10-YEAR T-BOND YIELD
$TNX is rising again, but is essentially in a congestion zone, stuck under resistance. The PMO is flat, but on a Crossover BUY Signal and Stochastics have ticked back up. For now we think it will bounce around sideways a bit longer as it finds its way.
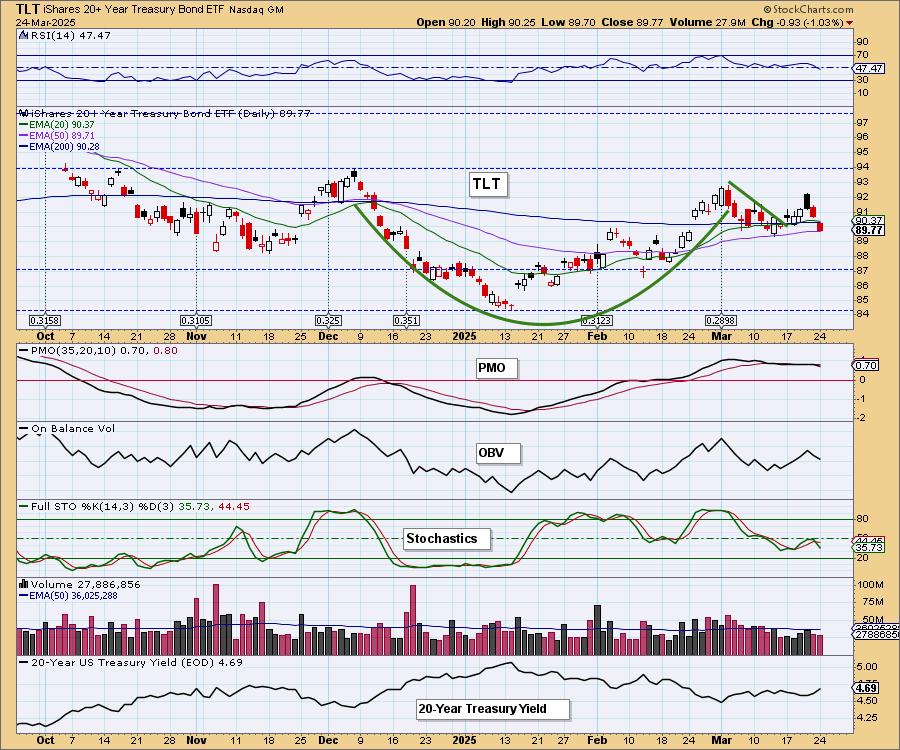
BONDS (TLT)
IT Trend Model: BUY as of 2/25/2025
LT Trend Model: SELL as of 12/13/2024
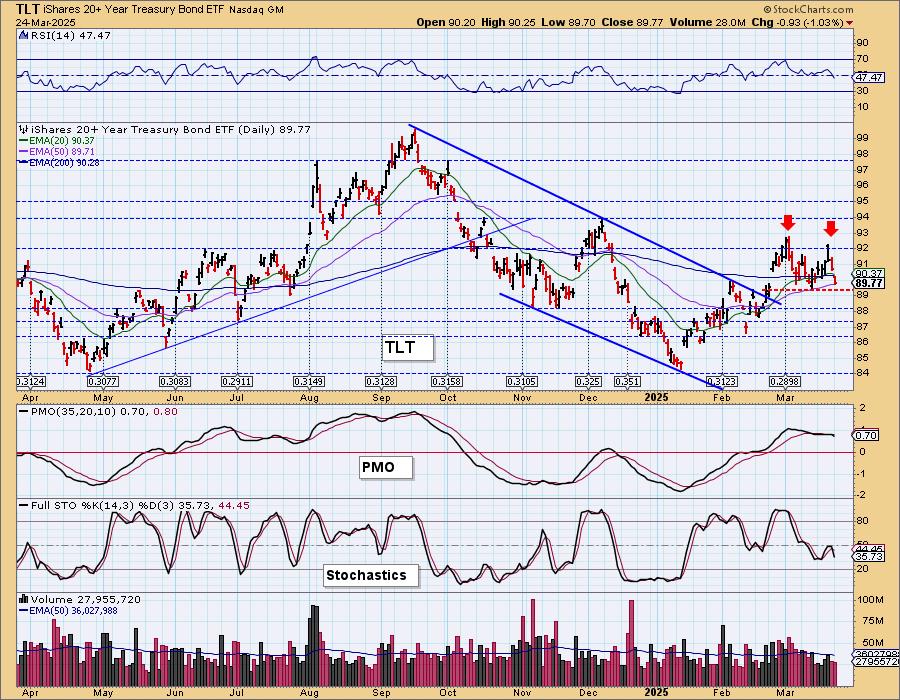
TLT Daily Chart: TLT was looking very good out of the bullish cup with handle but things are beginning to fall apart and we notice that we have a small double top on the right edge of the chart. The PMO has turned lower and Stochastics are falling in negative territory. The 50-day EMA is still holding as support, but we get the sense that Bonds will be heading lower and yields will be heading higher.
Here's the double top annotated. The confirmation line of the pattern is in red.
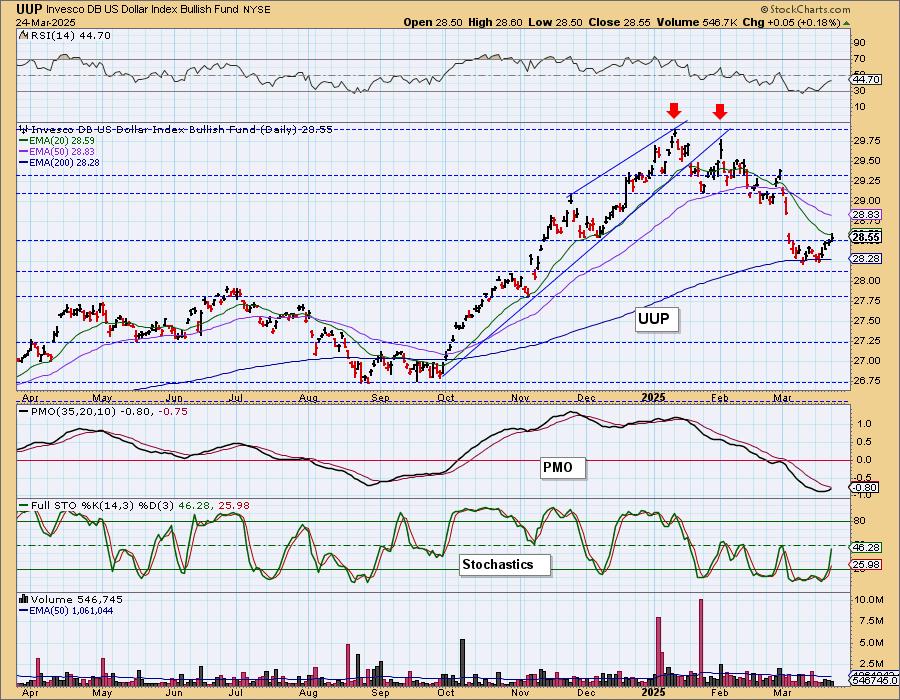
DOLLAR (UUP)
IT Trend Model: NEUTRAL as of 3/5/2025
LT Trend Model: BUY as of 5/25/2023
UUP Daily Chart: The Dollar is slowly making its way higher, but is coming upon gap resistance. We think it will resolve with a breakout given the rising PMO and Stochastics. This is a good place to get a reversal, right on the 200-day EMA.
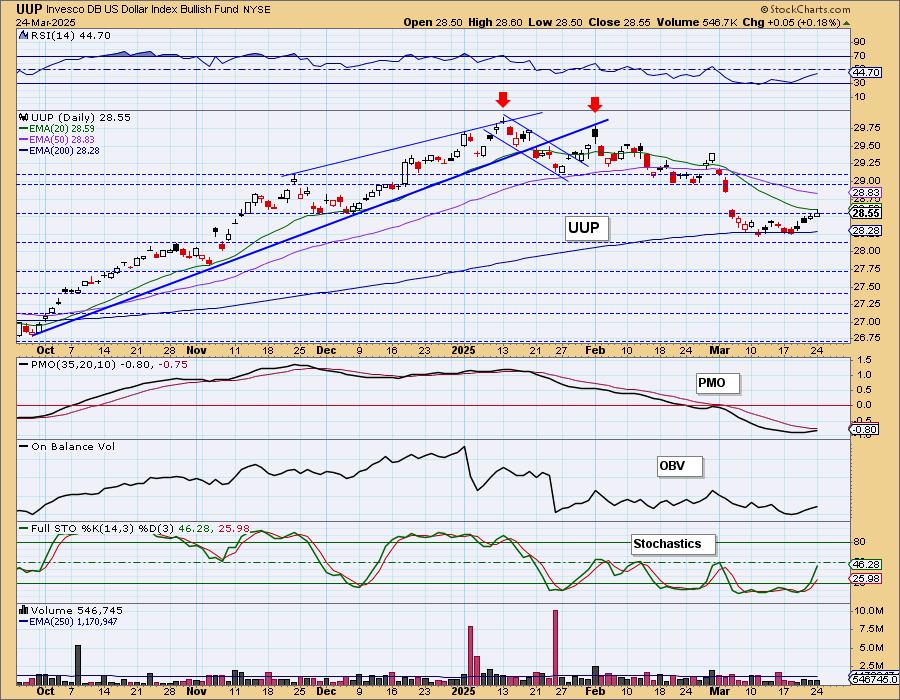
We can see a small double bottom formation has developed.
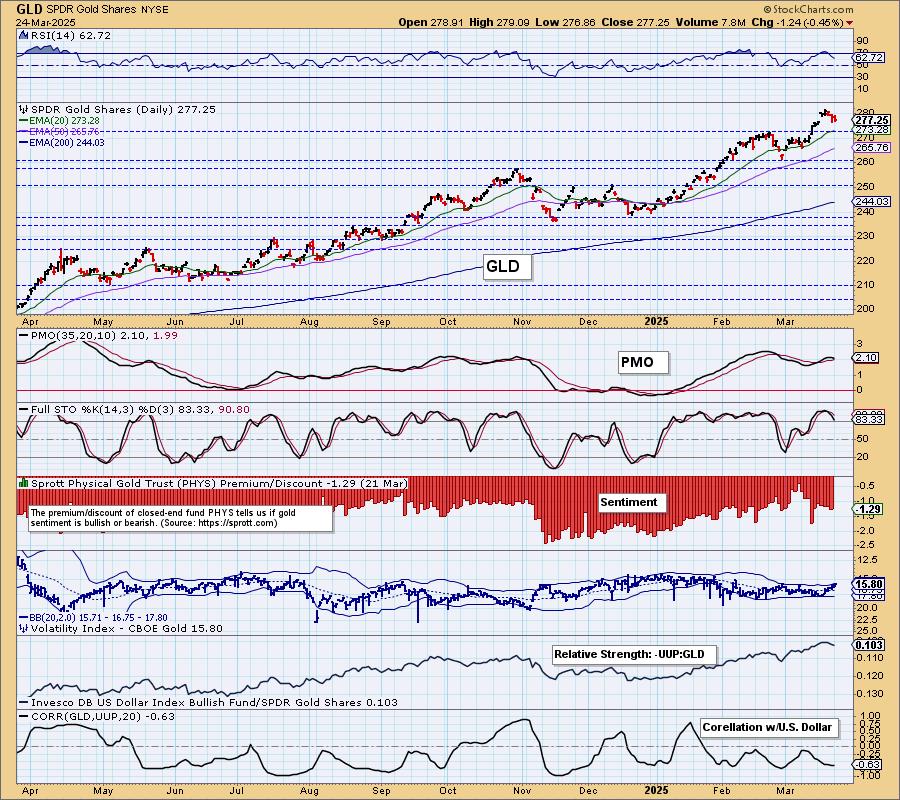
GOLD
IT Trend Model: BUY as of 1/10/2025
LT Trend Model: BUY as of 10/20/2023
GLD Daily Chart: Gold is pulling back and with the Dollar looking as though it will continue to rally, we think Gold will fall a bit further. We think we'll see the pullback take price back to support. The PMO and Stochastics have topped. The good news is that the RSI is no longer overbought.
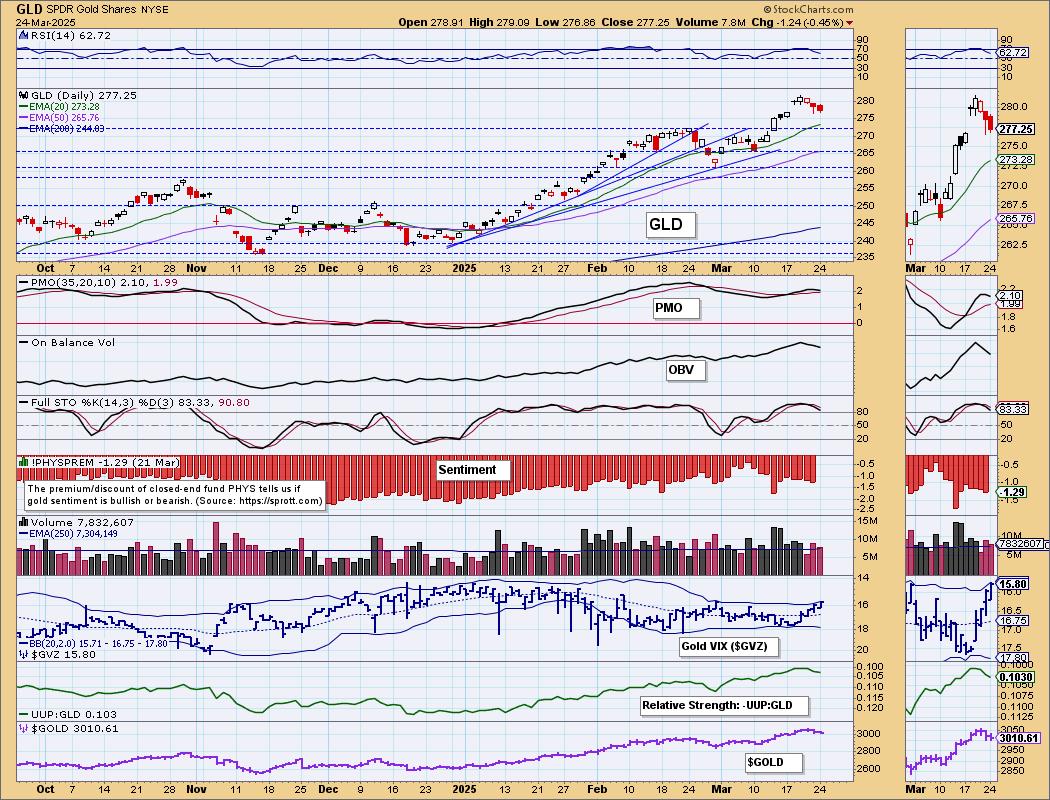
We can see that Gold's relative strength is fading right now. The correlation with the Dollar is in its usual inverse position so a bullish Dollar is not good for Gold.
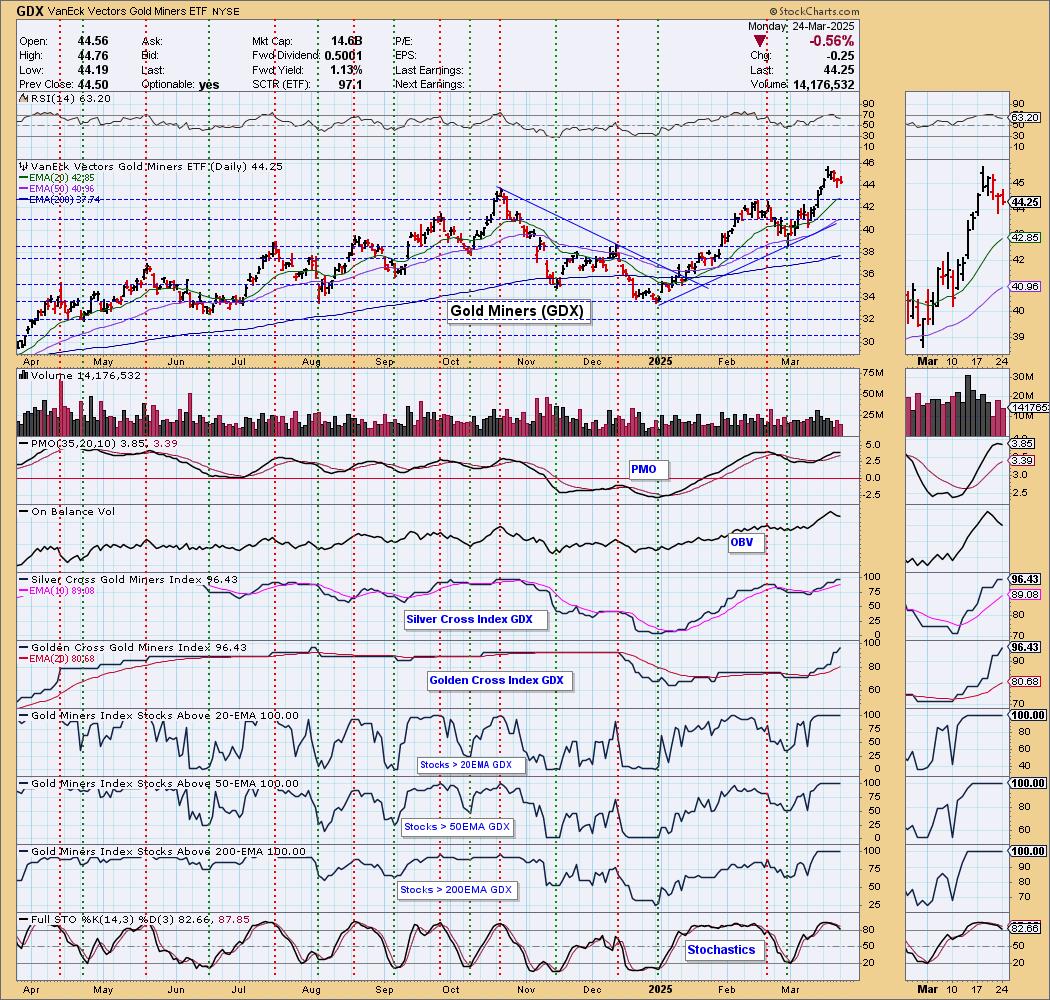
GOLD MINERS (GDX) Daily Chart: Gold Miners are also in pullback mode given Gold's pause. Just like Gold, we expect near-term support to eventually be tested. Participation is still incredibly strong here so a pullback would offer an opportunity to get in if you haven't already.
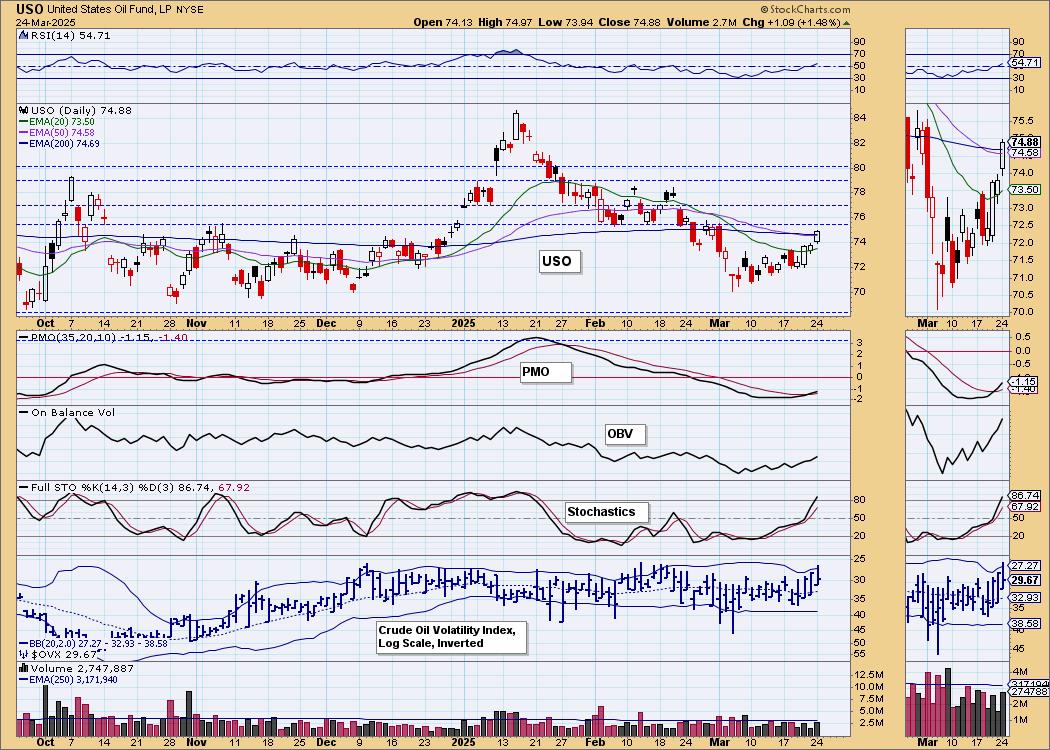
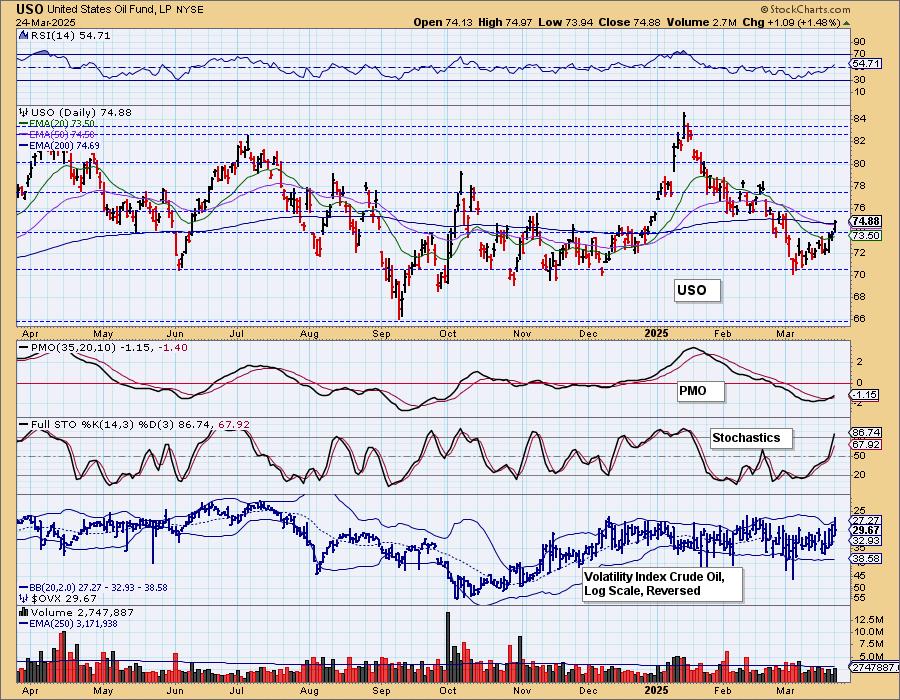
CRUDE OIL (USO)
IT Trend Model: NEUTRAL as of 2/27/2025
LT Trend Model: SELL as of 3/18/2025
USO Daily Chart: Crude Oil is making its way higher and has broken its declining trend. Today saw an impressive breakout above the 50/200-day EMAs. If price can stay here, the earlier Death Cross of the 50/200-day EMAs could go away with a new Golden Cross. Price is coming off the bottom of a trading range and right now it does appear that it will at least get back up to 78 or 79. We are still waiting to see what happens with "drill, baby, drill" as the administration is likely to put downside pressure on Oil prices soon.
Good Luck & Good Trading!
Erin Swenlin and Carl Swenlin
Technical Analysis is a windsock, not a crystal ball. --Carl Swenlin
(c) Copyright 2025 DecisionPoint.com
Disclaimer: This blog is for educational purposes only and should not be construed as financial advice. The ideas and strategies should never be used without first assessing your own personal and financial situation, or without consulting a financial professional. Any opinions expressed herein are solely those of the author, and do not in any way represent the views or opinions of any other person or entity.
DecisionPoint is not a registered investment advisor. Investment and trading decisions are solely your responsibility. DecisionPoint newsletters, blogs or website materials should NOT be interpreted as a recommendation or solicitation to buy or sell any security or to take any specific action.
NOTE: The signal status reported herein is based upon mechanical trading model signals, specifically, the DecisionPoint Trend Model. They define the implied bias of the price index based upon moving average relationships, but they do not necessarily call for a specific action. They are information flags that should prompt chart review. Further, they do not call for continuous buying or selling during the life of the signal. For example, a BUY signal will probably (but not necessarily) return the best results if action is taken soon after the signal is generated. Additional opportunities for buying may be found as price zigzags higher, but the trader must look for optimum entry points. Conversely, exit points to preserve gains (or minimize losses) may be evident before the model mechanically closes the signal.
Helpful DecisionPoint Links:
DecisionPoint Alert Chart List
DecisionPoint Golden Cross/Silver Cross Index Chart List
DecisionPoint Sector Chart List
Price Momentum Oscillator (PMO)