
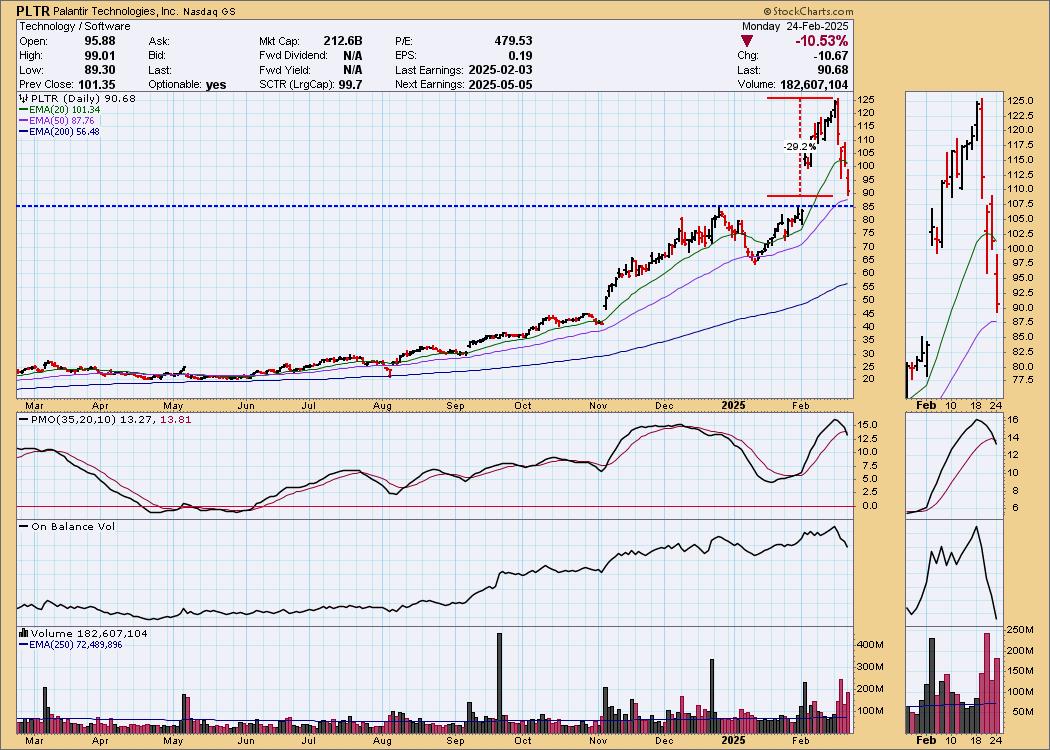
At the beginning of last week everyone wanted to own Palantir (PLTR), but since then it has corrected nearly -30% from its all-time high. As we always say, vertical price moves beg for correction. Support at 85 looks pretty good.
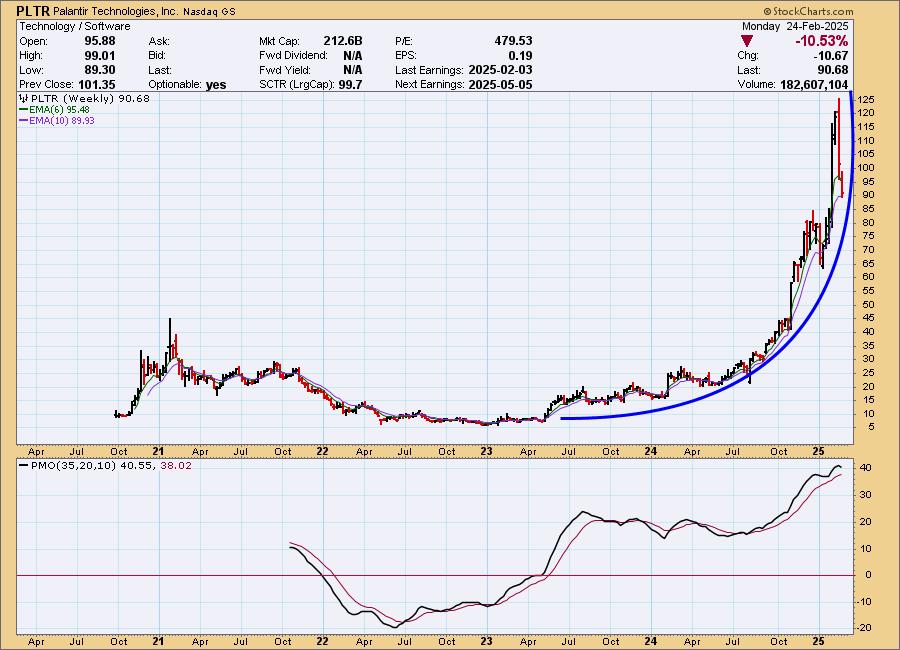
The weekly chart shows a particularly steep parabolic advance. This correction doesn't necessarily mean that we'll see a parabolic crash, but extra caution is indicated given the weekly PMO has topped.
The DecisionPoint Alert Weekly Wrap presents an end-of-week assessment of the trend and condition of the Stock Market, the U.S. Dollar, Gold, Crude Oil, and Bonds. The DecisionPoint Alert daily report (Monday through Thursday) is abbreviated and gives updates on the Weekly Wrap assessments.
Watch the latest episode of DecisionPoint on our YouTube channel here!
MARKET/INDUSTRY GROUP/SECTOR INDEXES
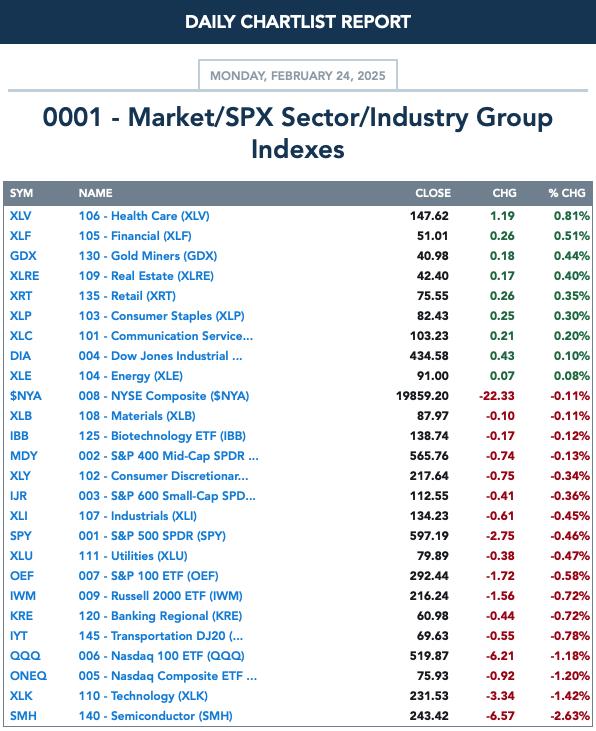
CLICK HERE for Carl's annotated Market Index, Sector, and Industry Group charts.
THE MARKET (S&P 500)
IT Trend Model: BUY as of 8/14/2024
LT Trend Model: BUY as of 3/29/2023
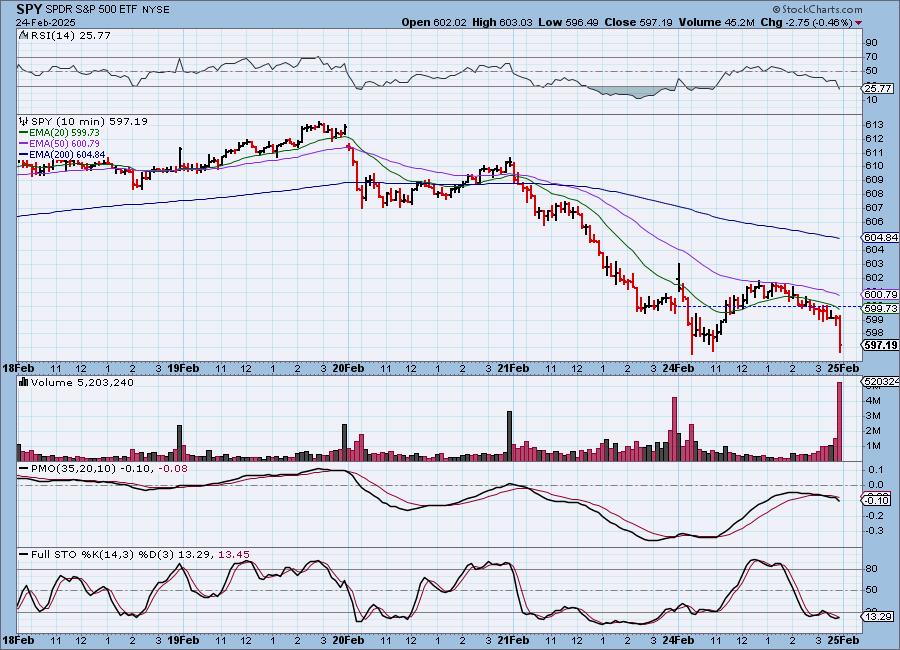
SPY 10-Minute Chart: The market opened lower to start the day, but then managed to claw back those losses, trading positive midday. However, after that a declining trend began that extends the current declining trend. Price finished close to its lows for the day.
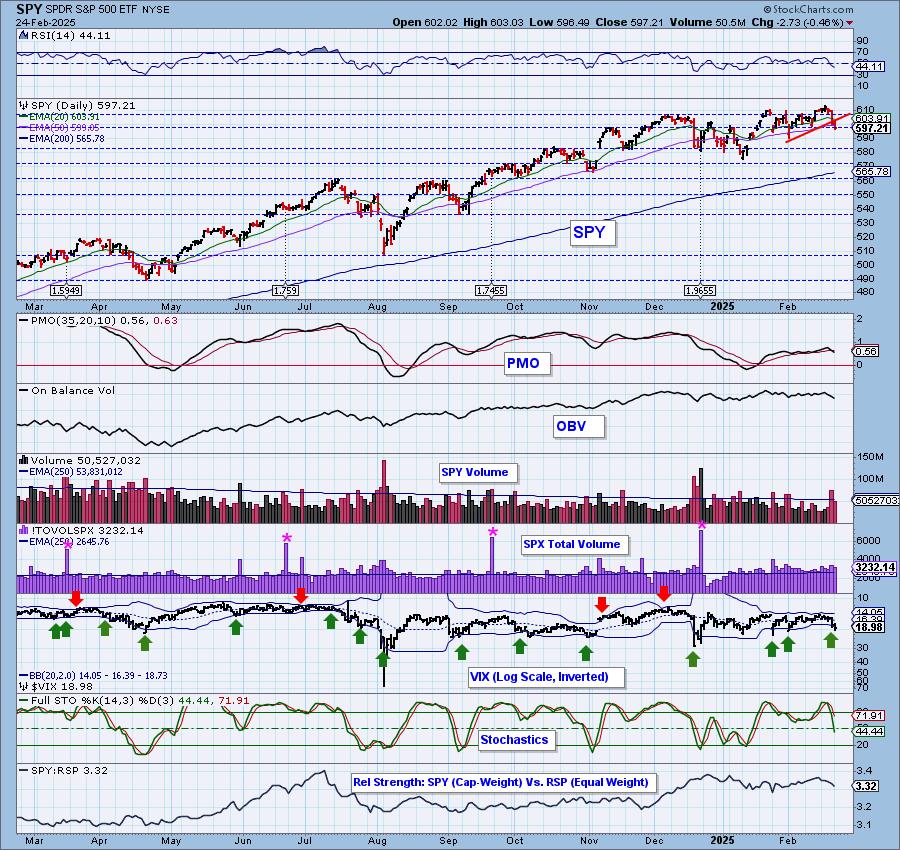
SPY Daily Chart: The market has pulled back harshly since hitting all-time highs. Today the 50-day EMA was compromised leading us to believe that a test of 590 is inevitable. We have a new PMO Crossover SELL Signal that punctuated today's decline.
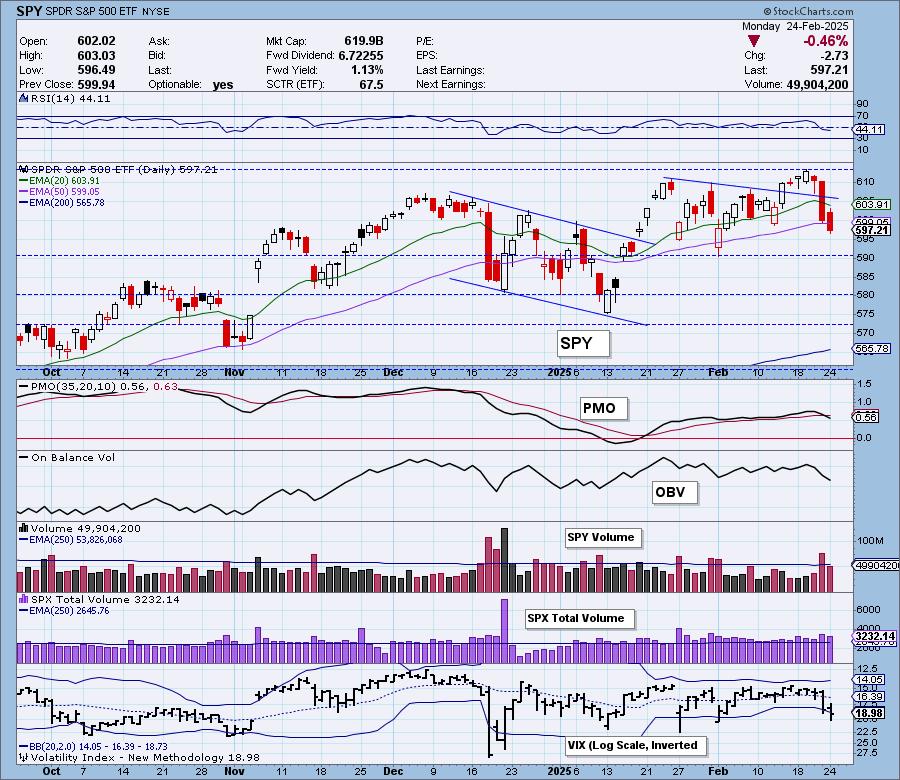
The short-term rising trend has now been compromised as well as horizontal support. The VIX penetrated the lower Bollinger Band on the inverted scale and that can many times lead to an upside reversal or at least a softening of the decline. Stochastics are falling vertically so overall we do detect internal weakness. The relative strength line to equal-weight RSP continues to fall, telling us that mega-caps are weak right now.

Here is the latest recording from 2/24. Click HERE to get to our video list.:
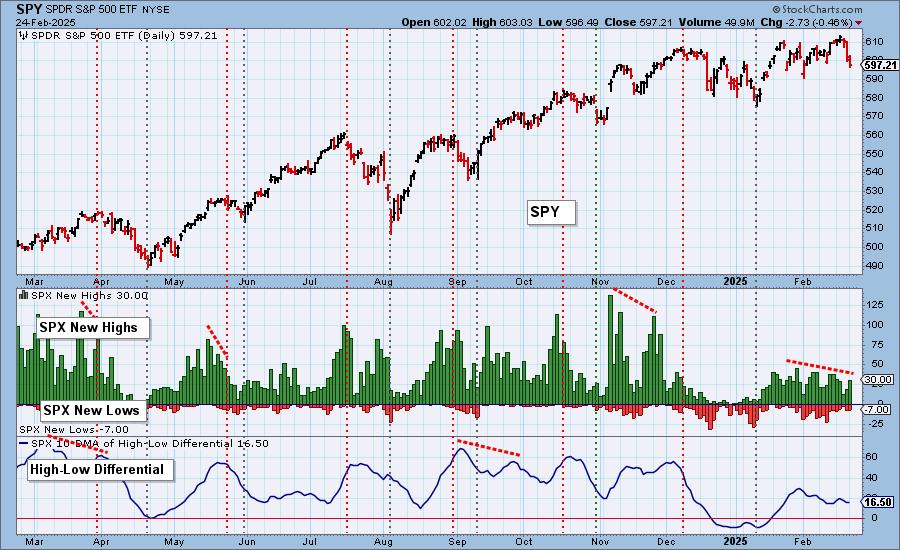
S&P 500 New 52-Week Highs/Lows: New Highs expanded, but remember these readings are intraday. We see the highest reading for the day at the finish. We suspect many of those New Highs disappeared by day's end. The High-Low Differential is in a declining trend suggesting more weakness ahead.
Climax* Analysis: There were no climax readings today.
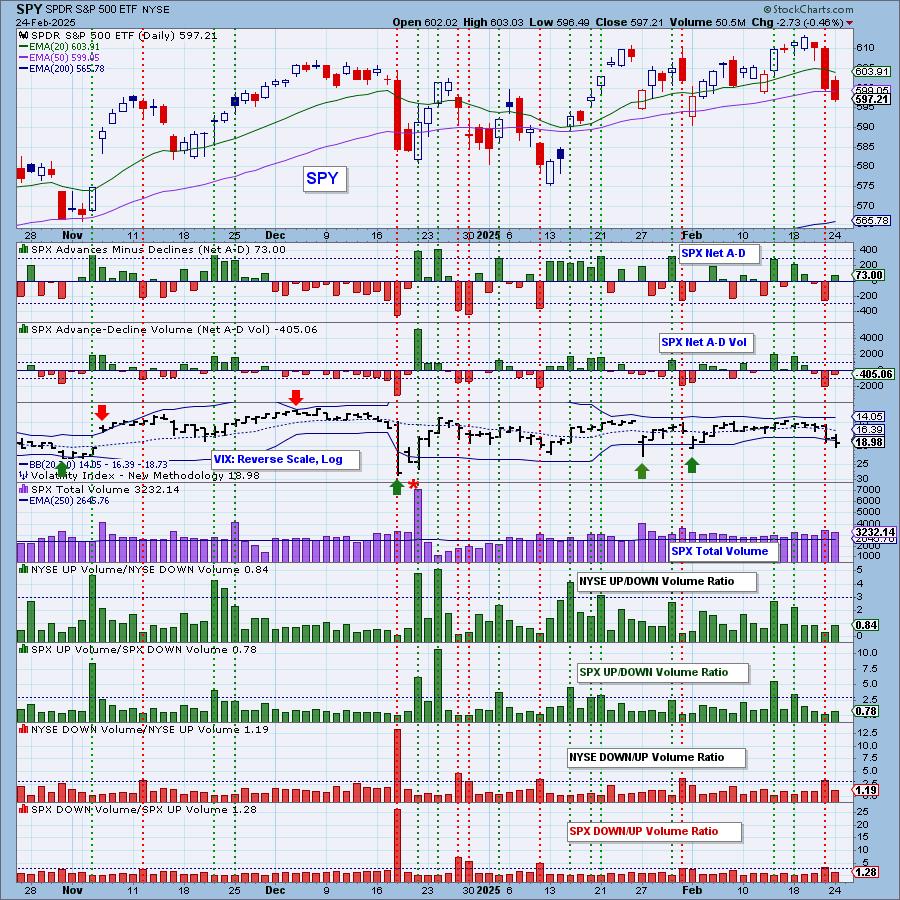
*A climax is a one-day event when market action generates very high readings in, primarily, breadth and volume indicators. We also include the VIX, watching for it to penetrate outside the Bollinger Band envelope. The vertical dotted lines mark climax days -- red for downside climaxes, and green for upside. Climaxes are at their core exhaustion events; however, at price pivots they may be initiating a change of trend.
Short-Term Market Indicators: The short-term market trend is DOWN and the condition is NEUTRAL.
Given the rising trend was broken today, we are listing the short-term market trend as "down". Both the Swenlin Trading Oscillators (STOs) continued to make their way lower. We did a slight expansion in participation and a few more rising PMOs which is positive. However, the chart is now showing four negative divergences with price.
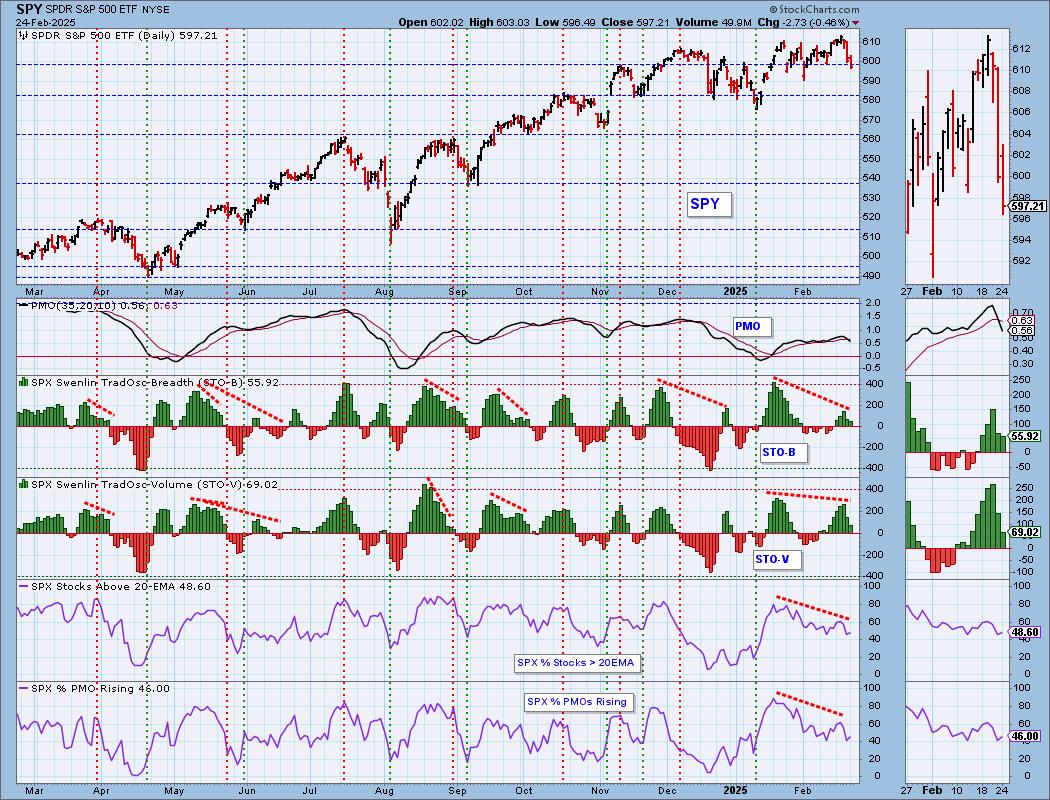
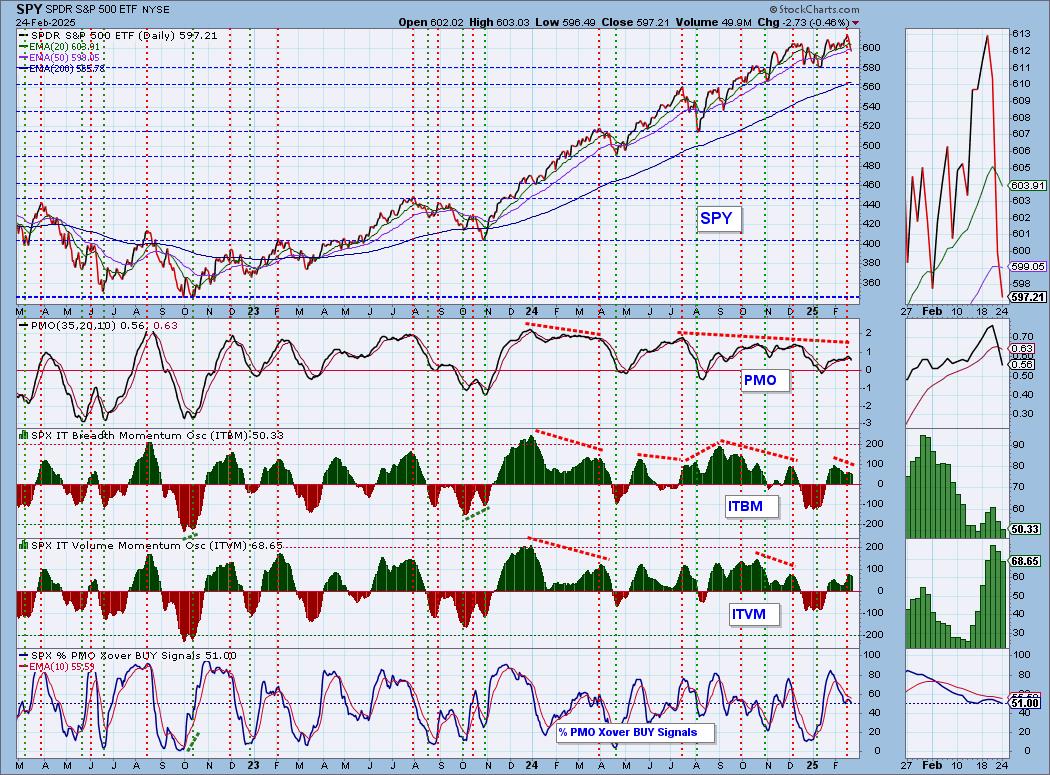
Intermediate-Term Market Indicators: The intermediate-term market trend is UP and the condition is NEUTRAL.
As with the STOs, the ITBM and ITVM are in neutral territory. We can see that both moved lower again today. We have a negative divergence visible on the ITBM. %PMO Xover BUY Signals has topped beneath its signal line.
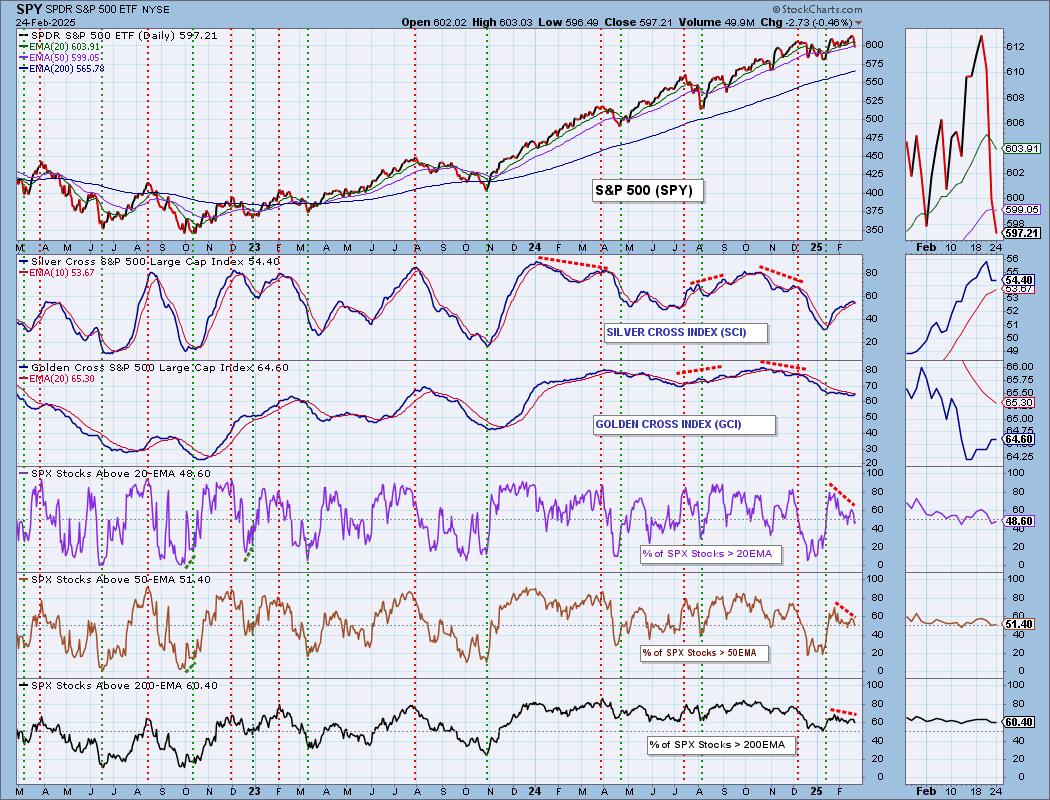
PARTICIPATION CHART (S&P 500): The following chart objectively shows the depth and trend of participation for the SPX in two time frames.
- Intermediate-Term - the Silver Cross Index (SCI) shows the percentage of SPX stocks on IT Trend Model BUY signals (20-EMA > 50-EMA). The opposite of the Silver Cross is a "Dark Cross" -- those stocks are, at the very least, in a correction.
- Long-Term - the Golden Cross Index (GCI) shows the percentage of SPX stocks on LT Trend Model BUY signals (50-EMA > 200-EMA). The opposite of a Golden Cross is the "Death Cross" -- those stocks are in a bear market.
The negative divergences on participation readings is stark. We have rising price tops, but participation continues to trend lower. %Stocks > 20EMA is now below our bullish 50% threshold and %Stocks > 50EMA isn't far behind. The Silver Cross Index has topped and it did lose some ground today. It is above its signal line so the IT Bias is BULLISH for now. Considering we hit all-time highs, the Silver Cross Index should be reading much higher than 54%. The Golden Cross Index is angling up, but it won't be for very much longer since we have fewer stocks above their 200-day EMA than stocks with Golden Crosses. The Golden Cross Index is below its signal line so the LT Bias is BEARISH despite a modestly bullish 65% reading.
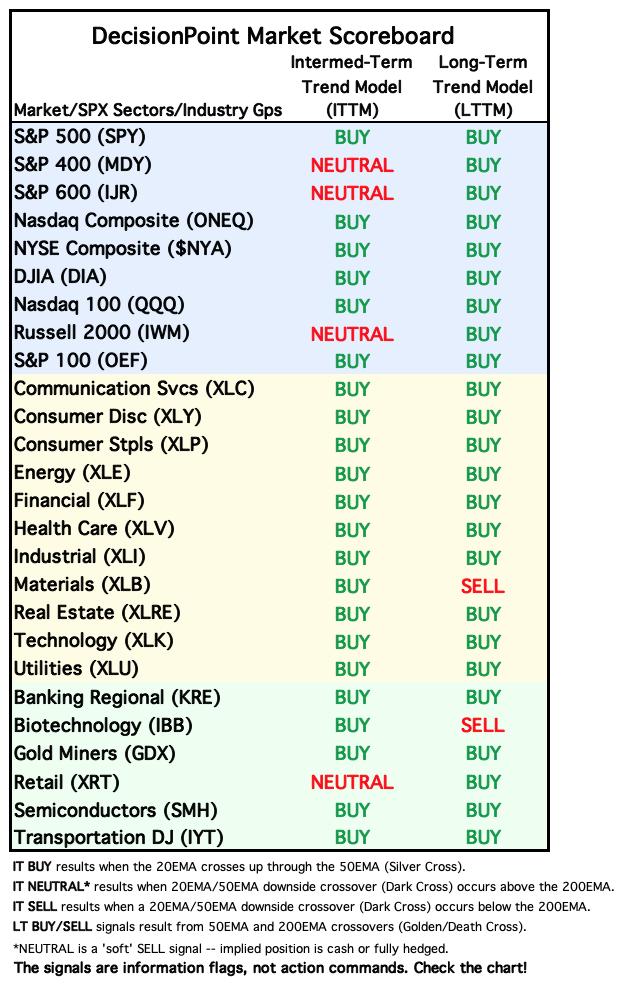
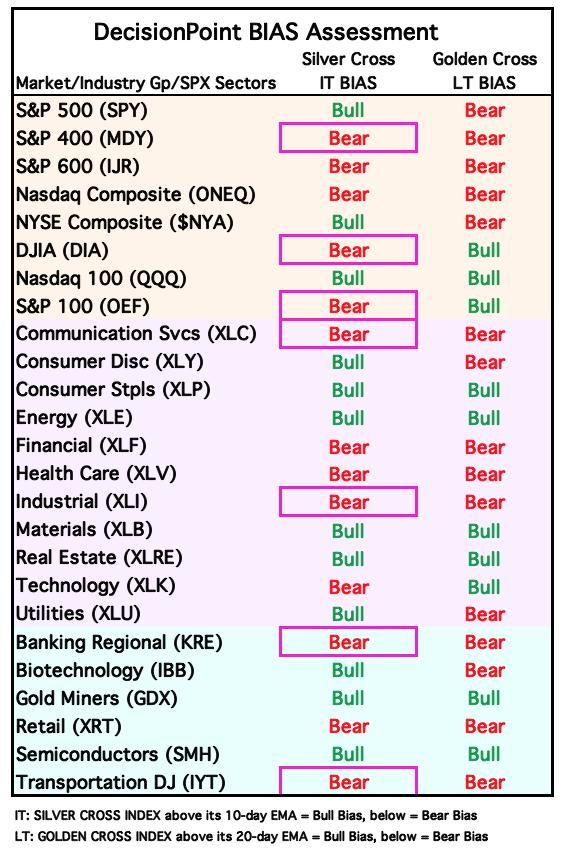
BIAS Assessment: The following table expresses the current BIAS of various price indexes based upon the relationship of the Silver Cross Index to its 10-day EMA (intermediate-term), and of the Golden Cross Index to its 20-day EMA (long-term). When the Index is above the EMA it is bullish, and it is bearish when the Index is below the EMA. The BIAS does not imply that any particular action should be taken. It is information to be used in the decision process.
The items with highlighted borders indicate that the BIAS changed today.
*****************************************************************************************************
CONCLUSION: The Bias Table above is our short-term barometer. Today we saw many new "Bear" readings in the intermediate term. This is a sign of market weakness seeping in. The theme today would be negative divergences. We've seen quite a few pop up on our indicator charts. The STOs and ITBM/ITVM are confirming this market decline with a decline of their own. Mega-caps continue to show weakness based on relative strength to equal-weight RSP. We noted today in the free DecisionPoint Trading Room that defensive sectors are leading right now. This typically occurs at major market tops and we believe we are there. Honor your stops.
Erin is 10% long, 0% short. (This is intended as information, not a recommendation.)
*****************************************************************************************************
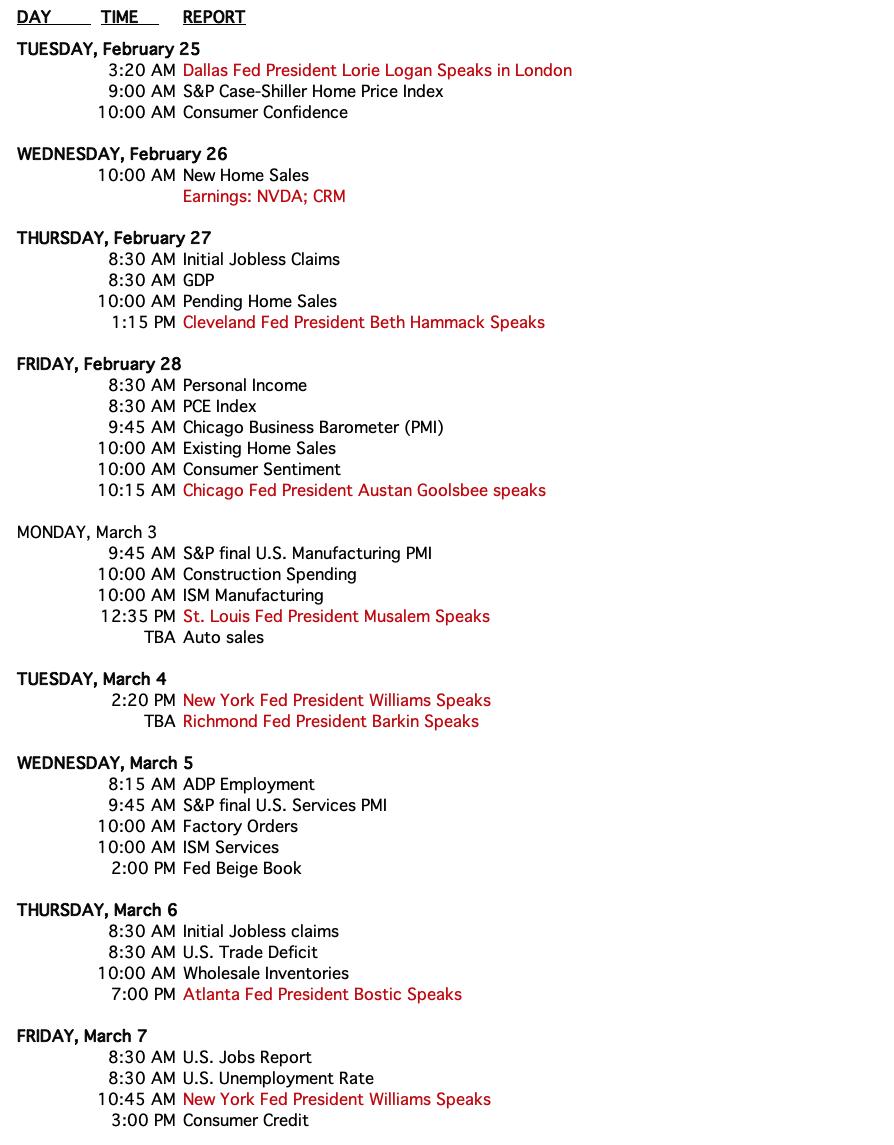
CALENDAR
Have you subscribed the DecisionPoint Diamonds yet? DP does the work for you by providing handpicked stocks/ETFs from exclusive DP scans! Add it with a discount! Contact support@decisionpoint.com for more information!
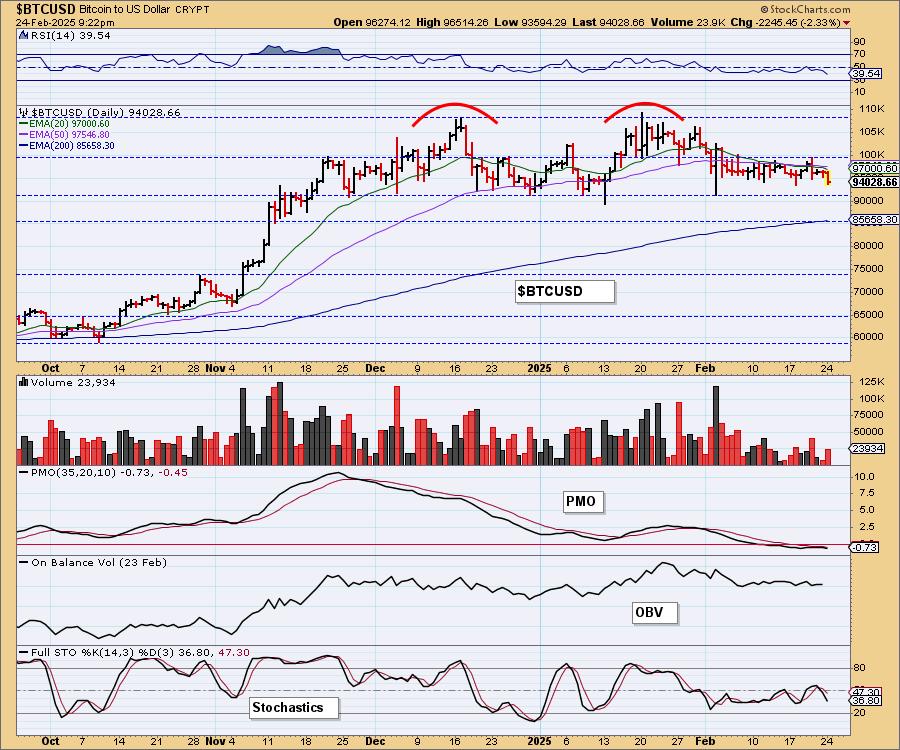
BITCOIN
We continue to monitor the large bearish double top on Bitcoin. It had appeared that it was breaking the declining trend out of the second top, but instead price essentially moved sideways not up. The PMO has topped beneath the signal line so we think support is very vulnerable right now. Stochastics are also a problem. We wouldn't be surprised to see more sideways trading as Bitcoin appears loathe to break down.
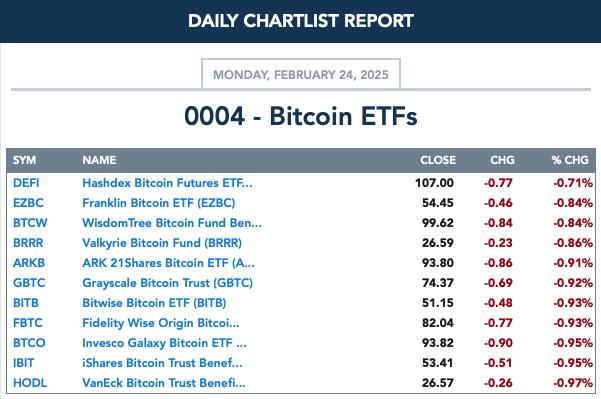
BITCOIN ETFs
INTEREST RATES
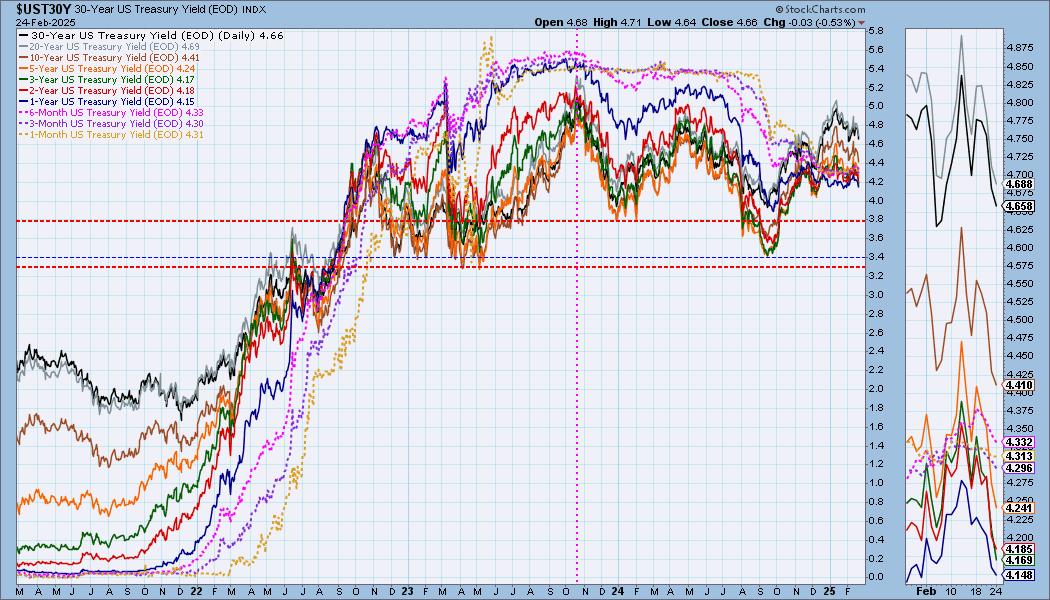
The declining trends continue for long-term rates. Short-term rates are topping as well, but are moving more sideways than down. The inversion between the 20-year and 30-year rates continues.
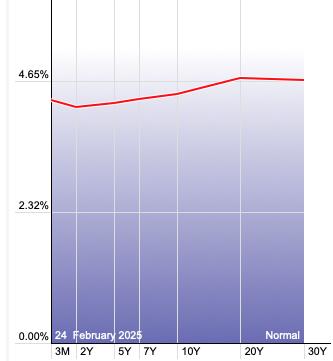
The Yield Curve Chart from StockCharts.com shows us the inversions taking place. The red line should move higher from left to right. Inversions are occurring where it moves downward.
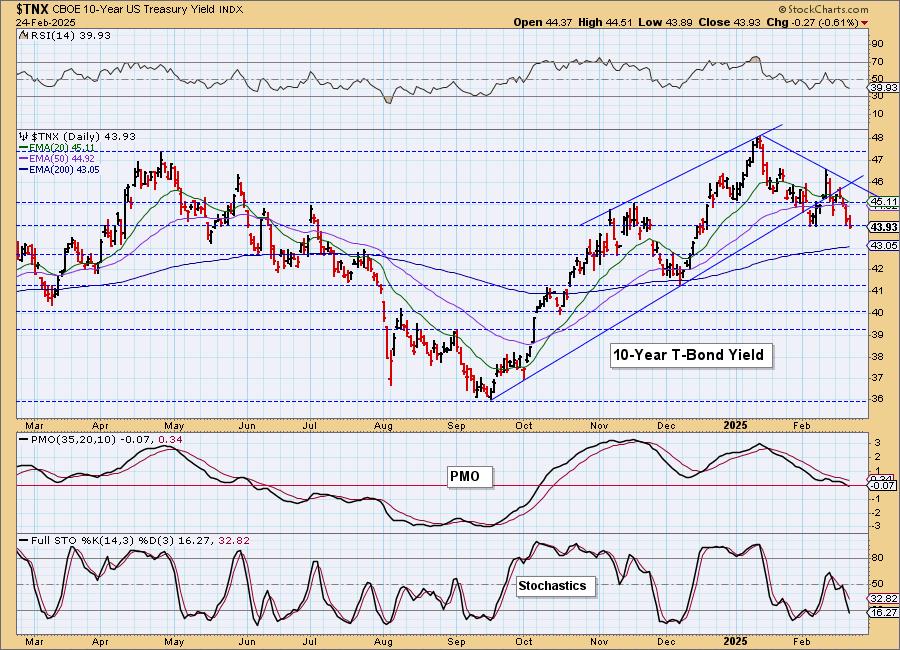
10-YEAR T-BOND YIELD
$TNX broke down below support. The PMO has now entered negative territory. Stochastics just dropped below 20. We should look for the 200-day EMA to be tested. 4.3% could be a good support level, but with indicators so bearish, we shouldn't count on it holding that level.
BONDS (TLT)
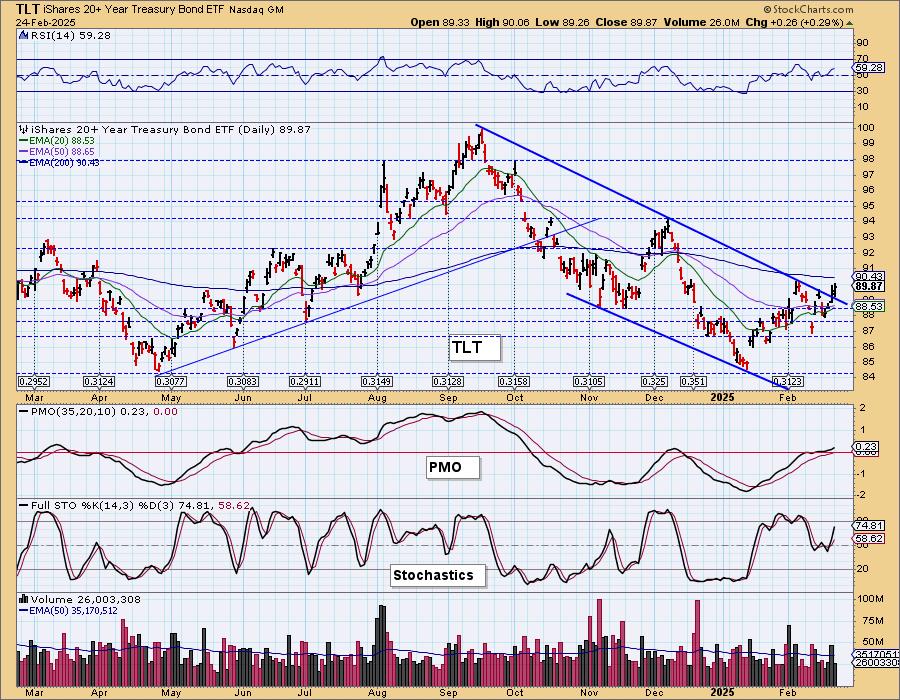
IT Trend Model: NEUTRAL as of 11/10/2024
LT Trend Model: SELL as of 12/13/2024
TLT Daily Chart: Bonds are in a rising trend and with yields looking bearish, we do expect Bond funds to rise. The indicators are behind this with a positive RSI, rising PMO on a Crossover BUY Signal and rising Stochastics in positive territory. The 200-day EMA is arriving as overhead resistance.
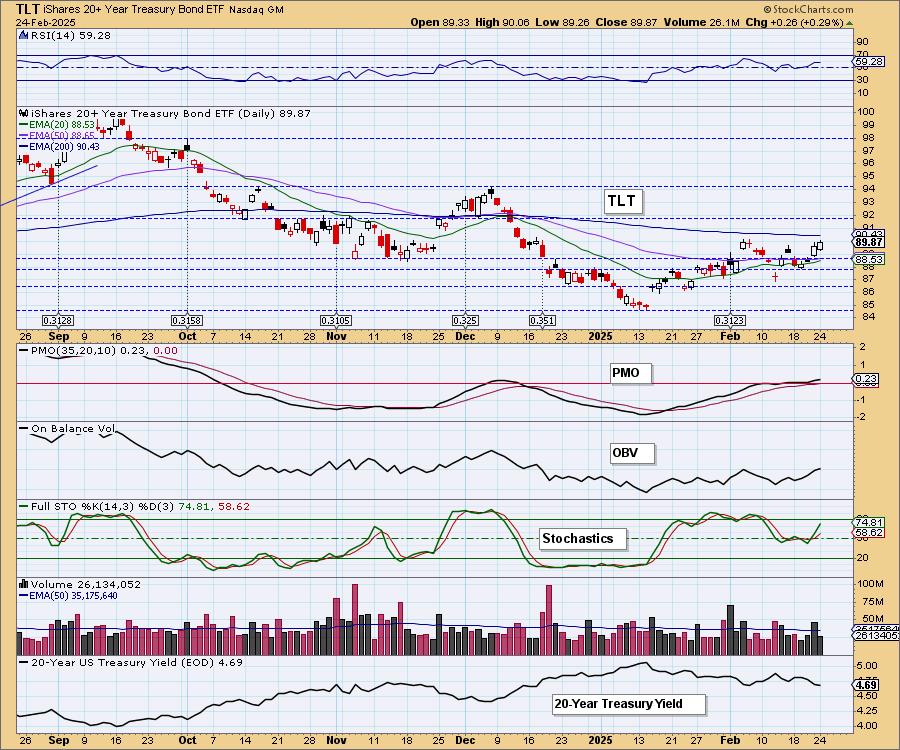
We now have a breakout from the longer-term declining trend channel which does imply more upside to go.
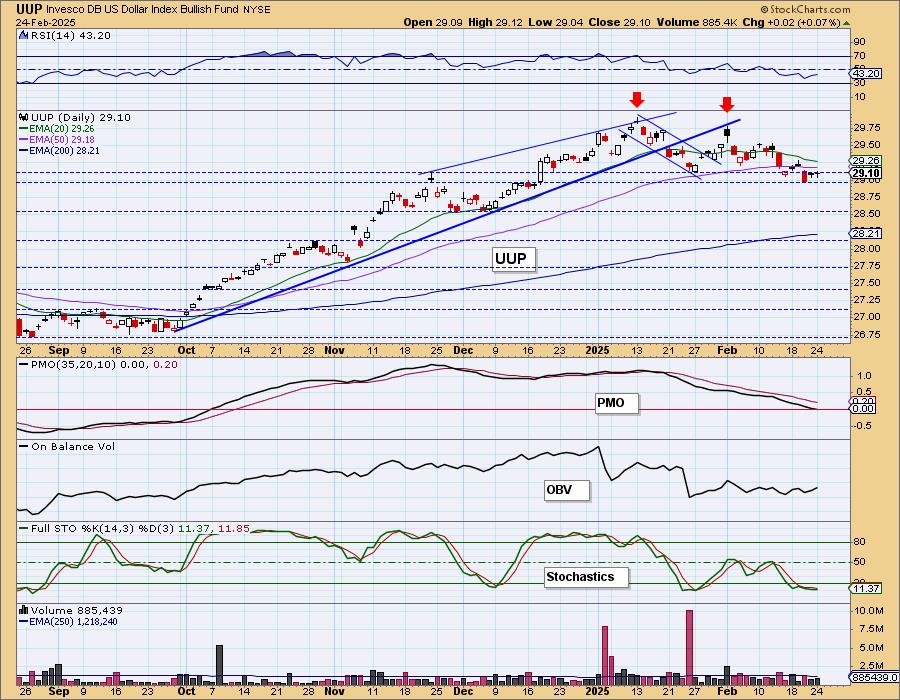
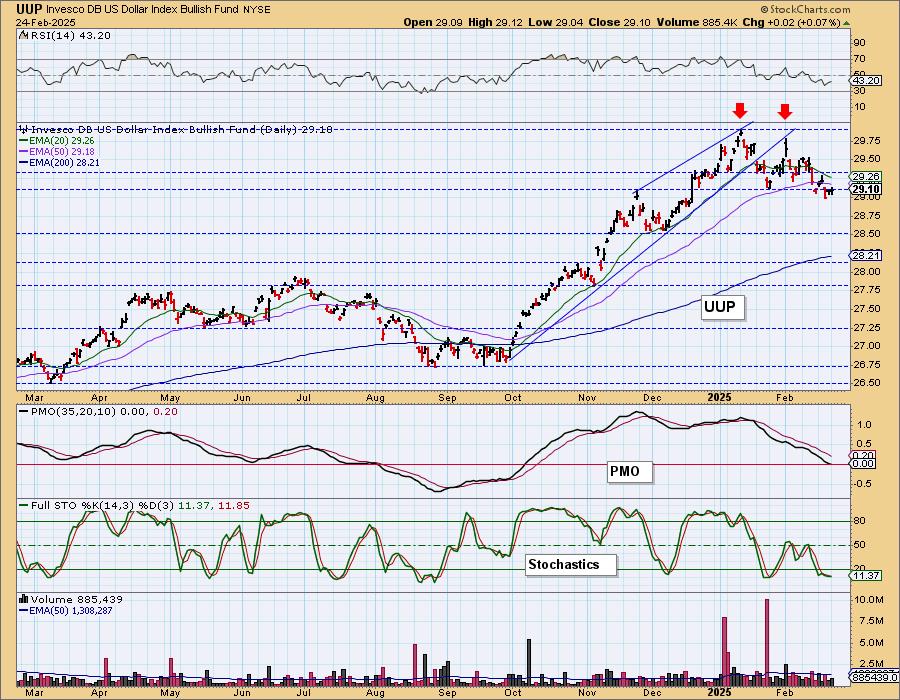
DOLLAR (UUP)
IT Trend Model: BUY as of 10/9/2024
LT Trend Model: BUY as of 5/25/2023
UUP Daily Chart: As with Bitcoin, we are monitoring a large bearish double top on the Dollar chart. So far it is holding the current support zone, but technically the confirmation line of the pattern has been compromised. We are looking for a drop down to the 200-day EMA based on this pattern.
GOLD
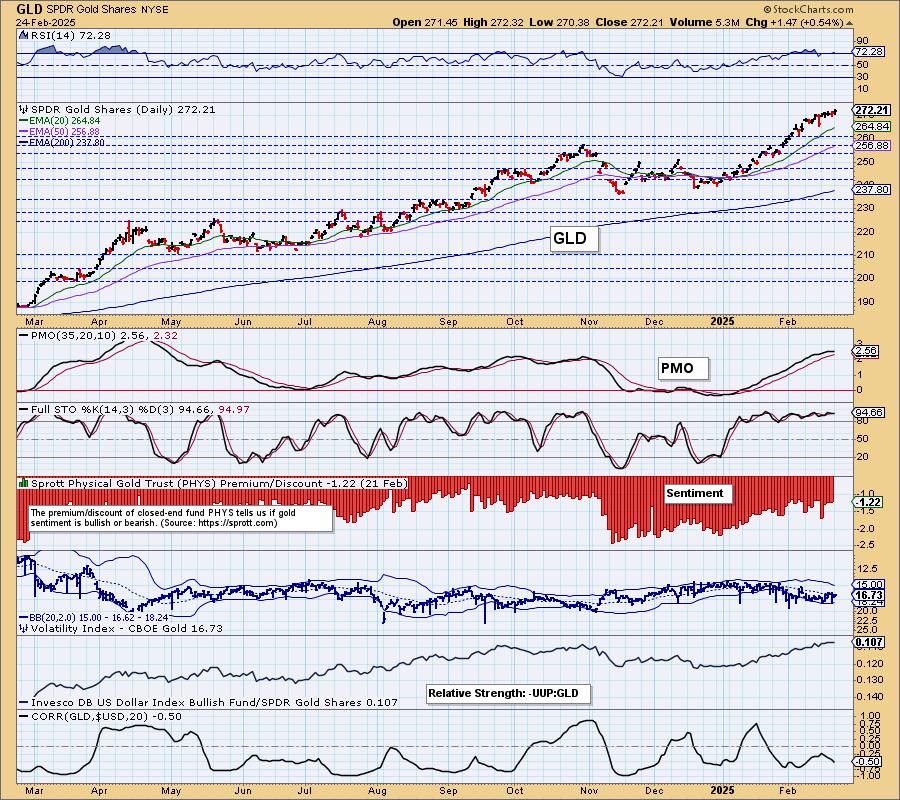
IT Trend Model: BUY as of 1/10/2025
LT Trend Model: BUY as of 10/20/2023
GLD Daily Chart: Gold continues to make its way higher setting all-time highs along the way. We have a steeper short-term rising trendline and an overbought RSI. Both suggest Gold will cool soon. Working in its favor will be a weak Dollar so we aren't expecting a deep decline, more like a pause that would bring price closer to the longer-term rising trendline.
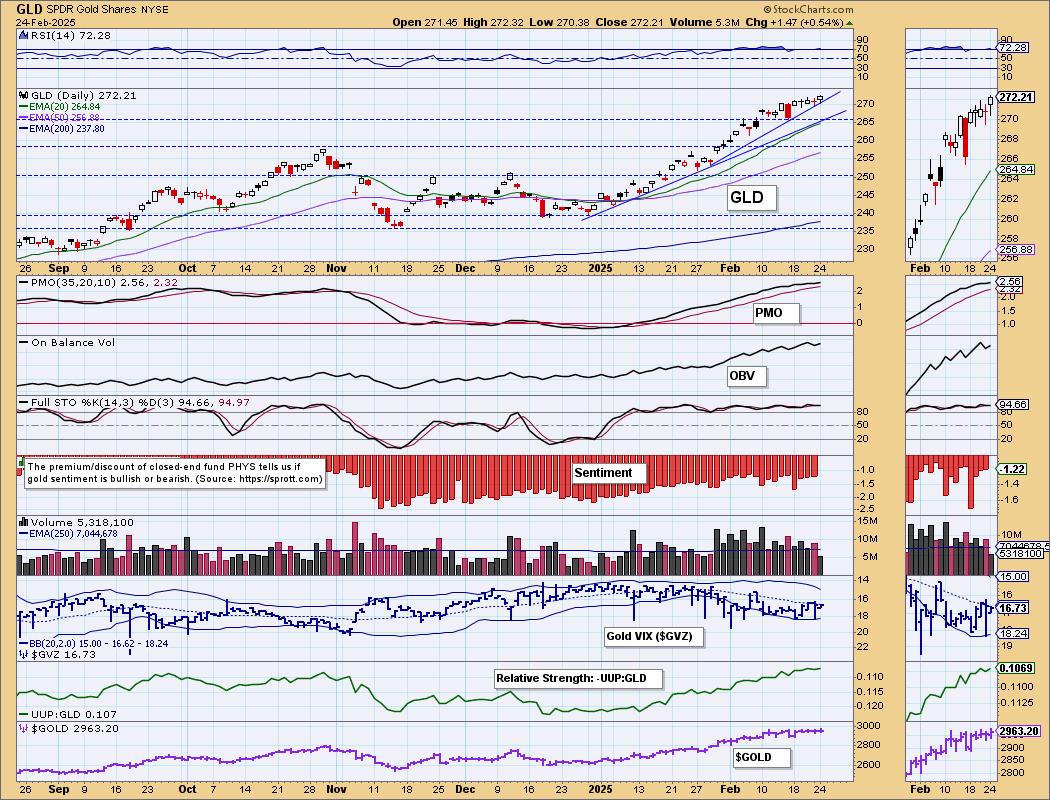
Relative strength against the Dollar is angling higher and higher as Gold breaks its inverse relationship with the Dollar. All things being equal, Gold should rise when the Dollar moves lower and vice versa. Right now Gold is managing to rally even on days that the Dollar rallies. Excellent internal strength.
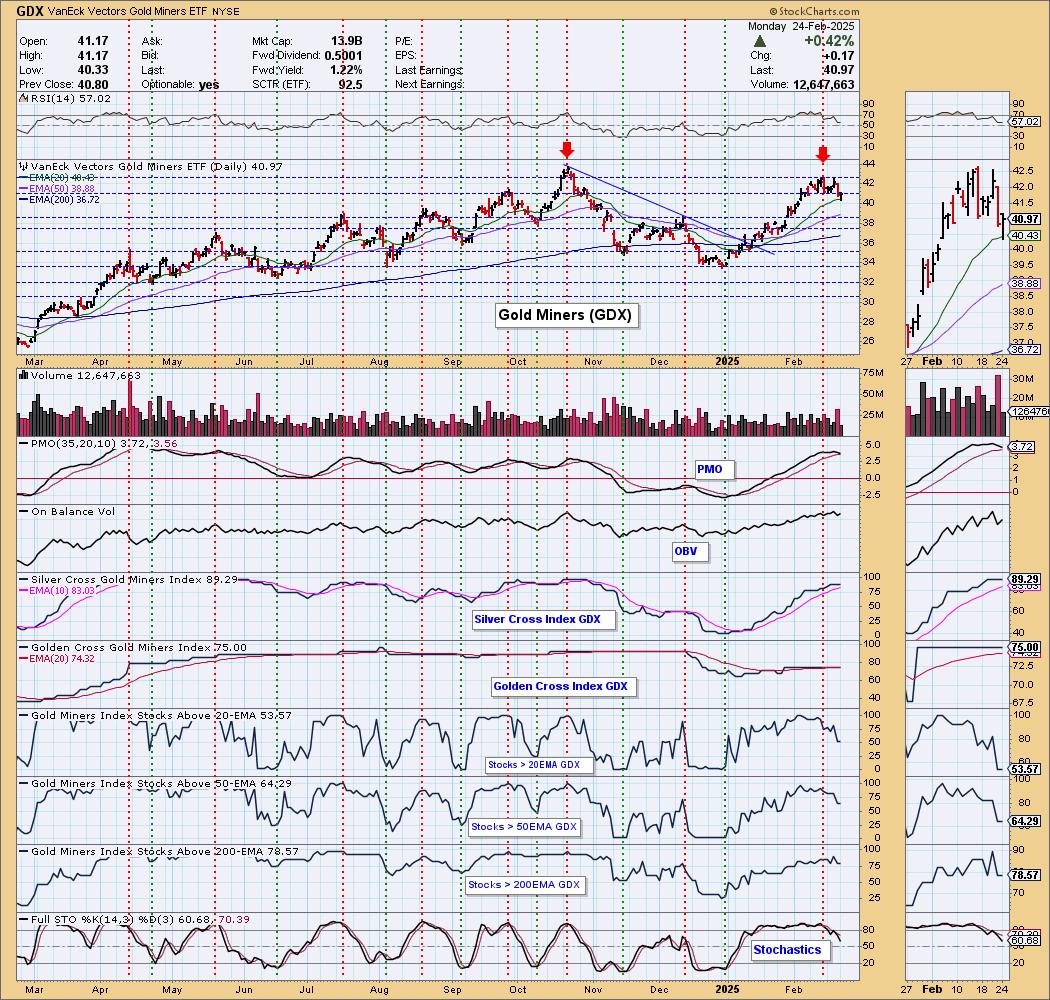
GOLD MINERS (GDX) Daily Chart: We now have a double top developing on Gold Miners. Typically they will rise with Gold prices, but right now they look very toppy. Gold is overdue for a pause or pullback and that will not be good for GDX which is already showing weakness. Note that participation has begun to slide lower. The PMO and Stochastics have topped so we will look for more downside from this group.
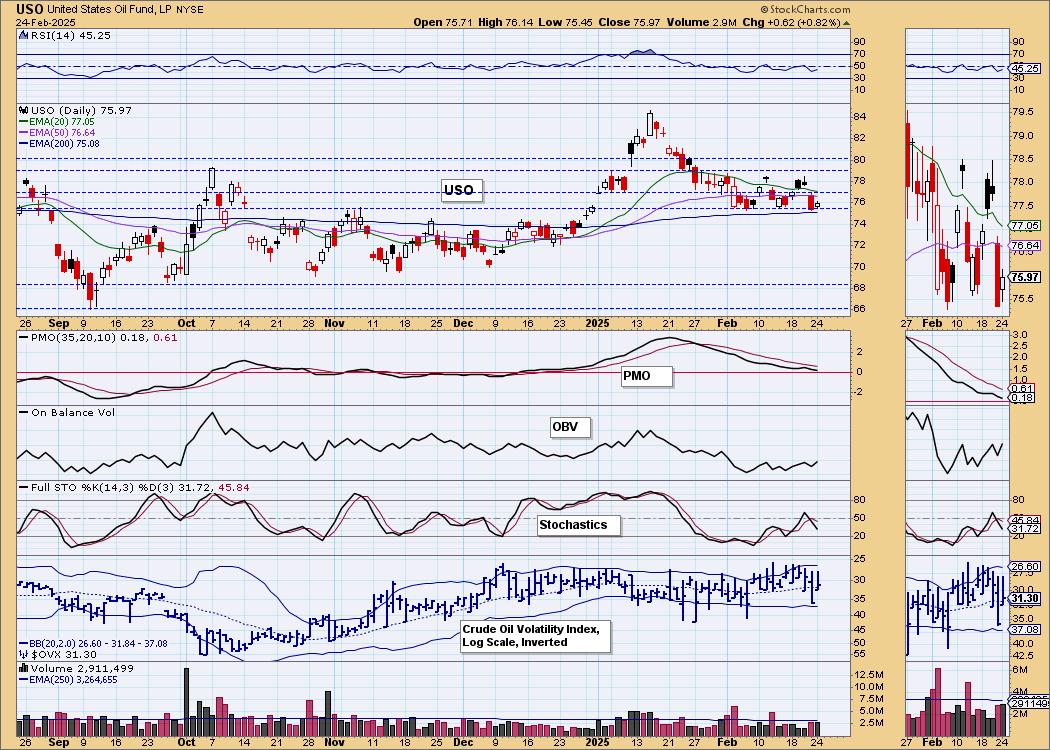
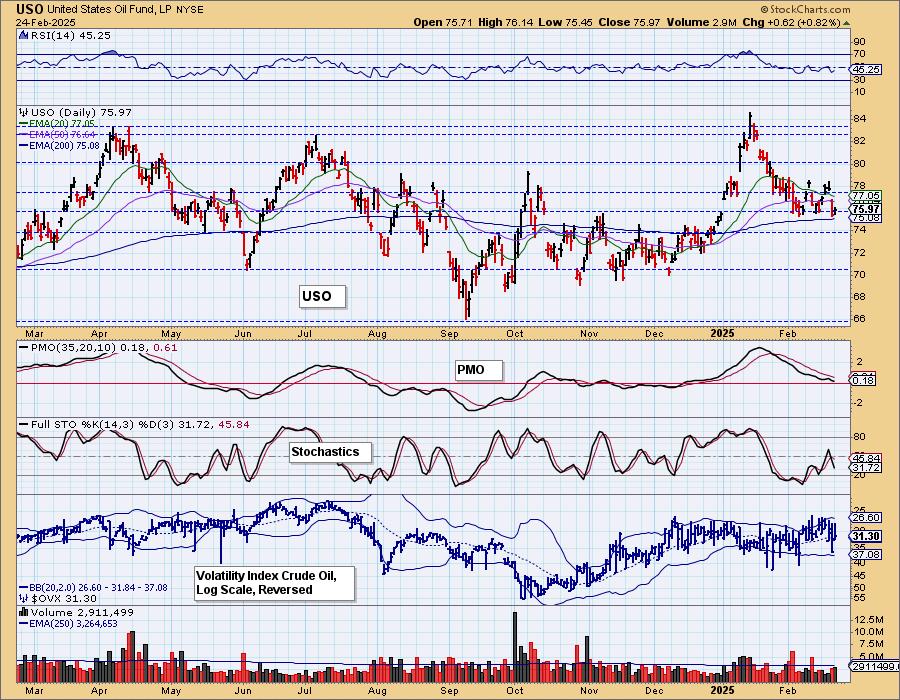
CRUDE OIL (USO)
IT Trend Model: BUY as of 12/24/2024
LT Trend Model: BUY as of 1/10/2025
USO Daily Chart: Crude Oil is in a holding pattern. It is holding above horizontal support and the 200-day EMA. It is holding up rather well given the PMO has been declining for some time. As the market figures out what to do with the administration's "drill, baby, drill" stance, we could see more sideways movement, but ultimately higher production would bring prices lower. We think this support level is very weak.
Good Luck & Good Trading!
Erin Swenlin and Carl Swenlin
Technical Analysis is a windsock, not a crystal ball. --Carl Swenlin
(c) Copyright 2025 DecisionPoint.com
Disclaimer: This blog is for educational purposes only and should not be construed as financial advice. The ideas and strategies should never be used without first assessing your own personal and financial situation, or without consulting a financial professional. Any opinions expressed herein are solely those of the author, and do not in any way represent the views or opinions of any other person or entity.
DecisionPoint is not a registered investment advisor. Investment and trading decisions are solely your responsibility. DecisionPoint newsletters, blogs or website materials should NOT be interpreted as a recommendation or solicitation to buy or sell any security or to take any specific action.
NOTE: The signal status reported herein is based upon mechanical trading model signals, specifically, the DecisionPoint Trend Model. They define the implied bias of the price index based upon moving average relationships, but they do not necessarily call for a specific action. They are information flags that should prompt chart review. Further, they do not call for continuous buying or selling during the life of the signal. For example, a BUY signal will probably (but not necessarily) return the best results if action is taken soon after the signal is generated. Additional opportunities for buying may be found as price zigzags higher, but the trader must look for optimum entry points. Conversely, exit points to preserve gains (or minimize losses) may be evident before the model mechanically closes the signal.
Helpful DecisionPoint Links:
DecisionPoint Alert Chart List
DecisionPoint Golden Cross/Silver Cross Index Chart List
DecisionPoint Sector Chart List
Price Momentum Oscillator (PMO)