
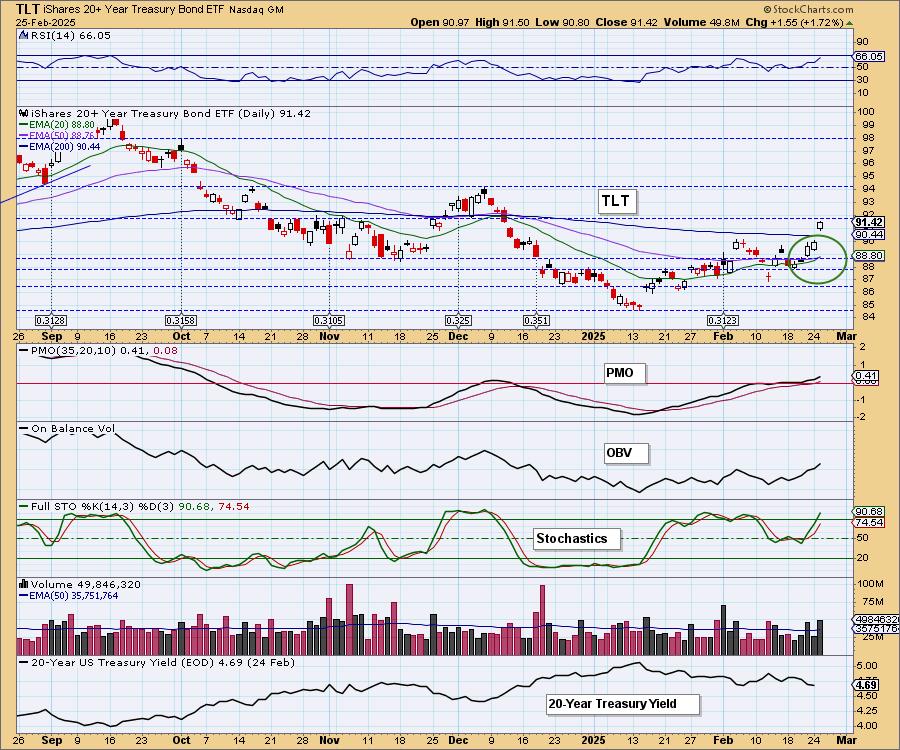
Today the 20+ Year Treasury Bond ETF (TLT) 20-day EMA crossed up through the 50-day EMA (Silver Cross), generating an IT Trend Model BUY Signal. See more commentary in the BOND section below.
The DecisionPoint Alert Weekly Wrap presents an end-of-week assessment of the trend and condition of the Stock Market, the U.S. Dollar, Gold, Crude Oil, and Bonds. The DecisionPoint Alert daily report (Monday through Thursday) is abbreviated and gives updates on the Weekly Wrap assessments.
Watch the latest episode of DecisionPoint on our YouTube channel here!
MARKET/INDUSTRY GROUP/SECTOR INDEXES
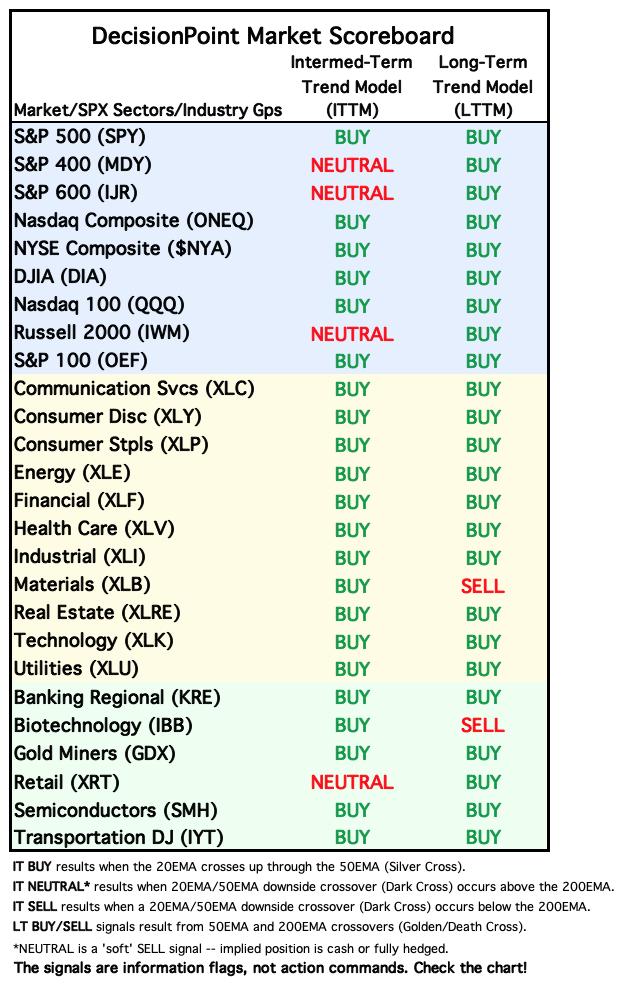
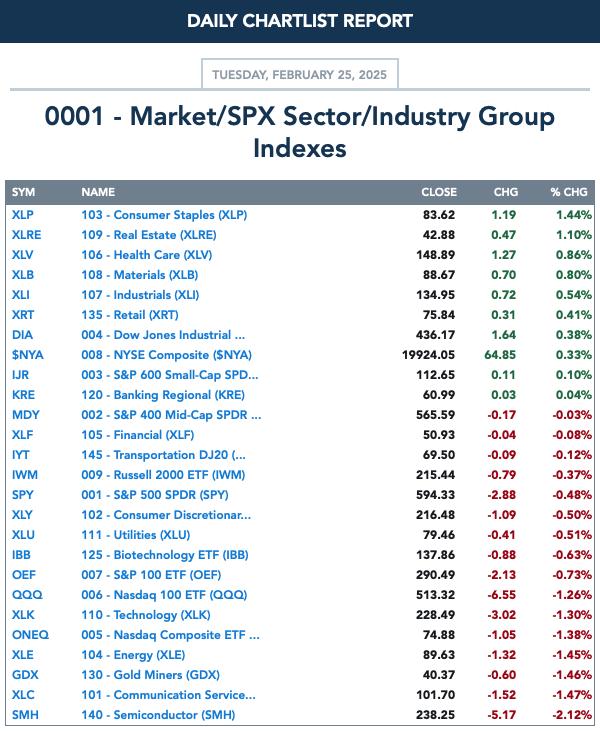
CLICK HERE for Carl's annotated Market Index, Sector, and Industry Group charts.
THE MARKET (S&P 500)
IT Trend Model: BUY as of 8/14/2024
LT Trend Model: BUY as of 3/29/2023
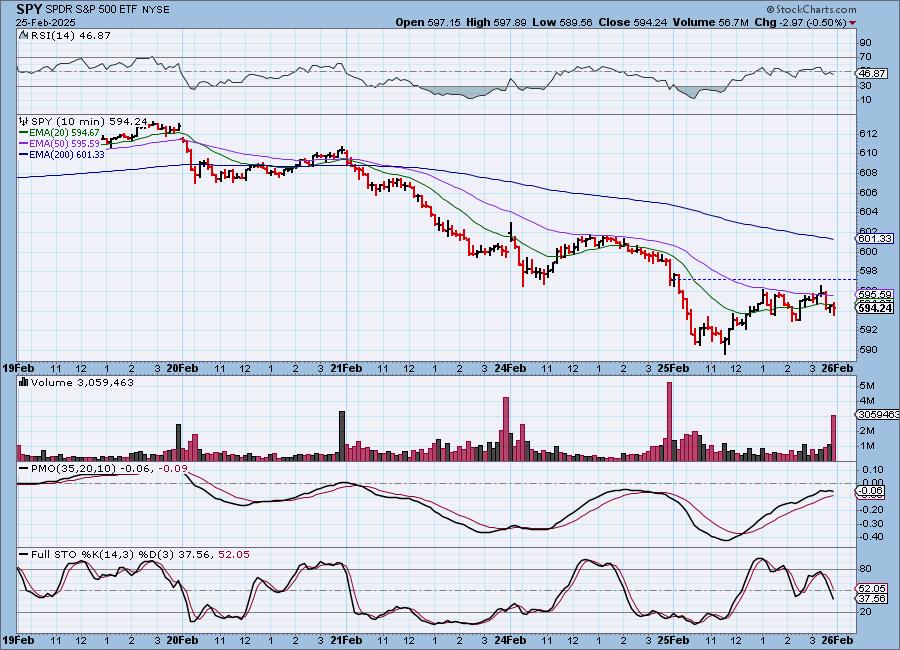
SPY 10-Minute Chart: The decline continued in the morning, but price started to make its way higher at lunch to reduce the morning losses. We do have a double top formation and the 10-minute PMO has topped.
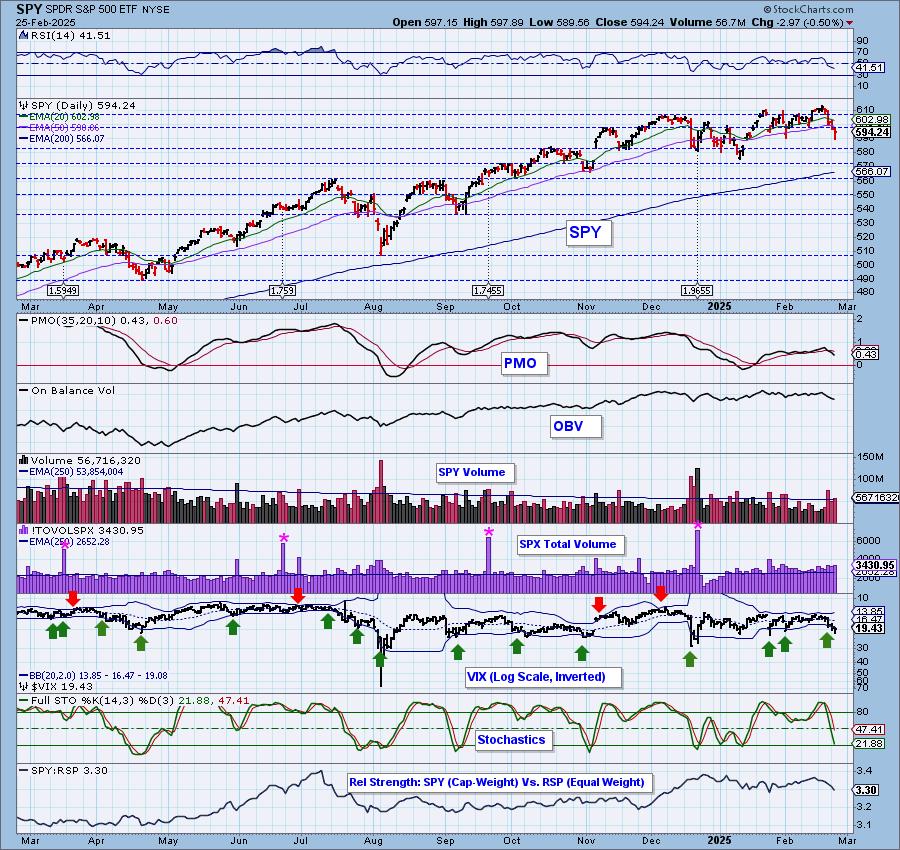
SPY Daily Chart: Price has now reached horizontal support after breaking below the 50-day EMA. This could be an area to expect a small bounce. The PMO is still very negative as it drops on its Crossover SELL Signal. The RSI is also negative now.
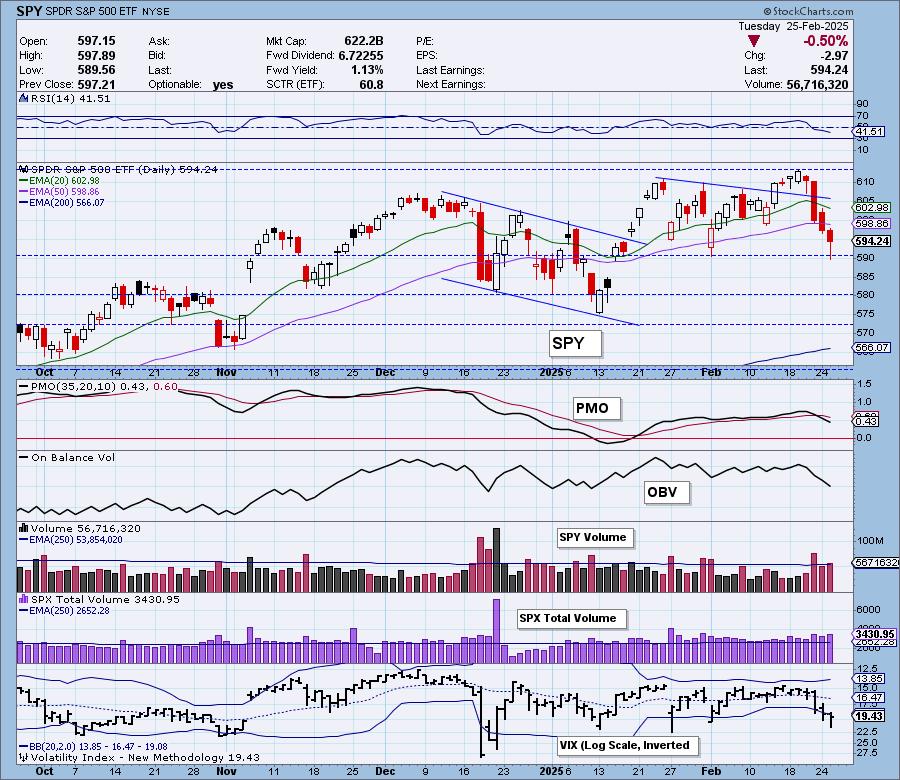
The VIX Bollinger Bands are finally expanding as more investors get nervous about current market conditions. It penetrated the lower Band again setting up for a small bounce possibly off this level of support. Stochastics are highly negative as they near 20. Mega-caps continue to be a drag as we see the dropping relative strength line to equal-weight RSP.

Here is the latest recording from 2/24. Click HERE to get to our video list.:
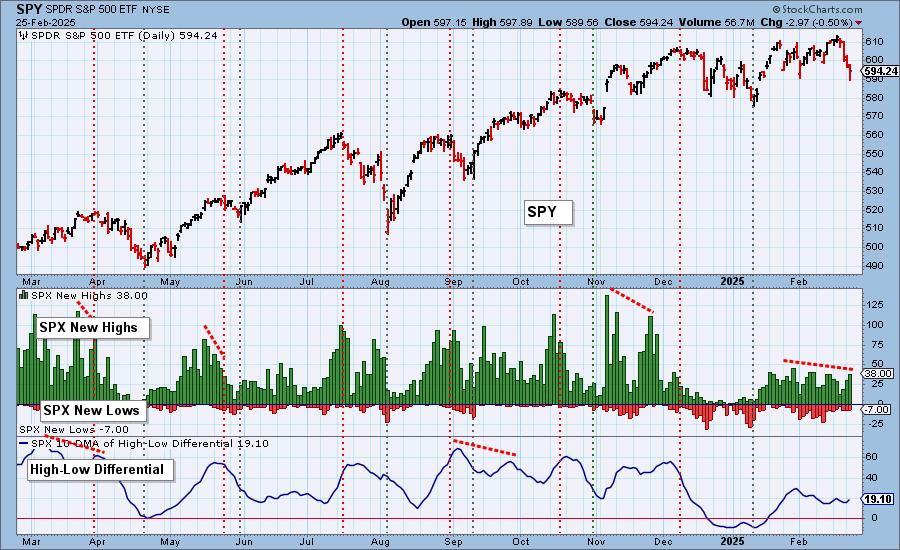
S&P 500 New 52-Week Highs/Lows: New Highs expanded again today and New Lows held steady. In a bullish turn of events, the High-Low Differential turned back up today above the zero line. Unfortunately it isn't all good news, there is a clear negative divergence between New Highs and price tops.
Climax* Analysis: There were no climax readings today. We do note that Net A-D was positive on a down day.
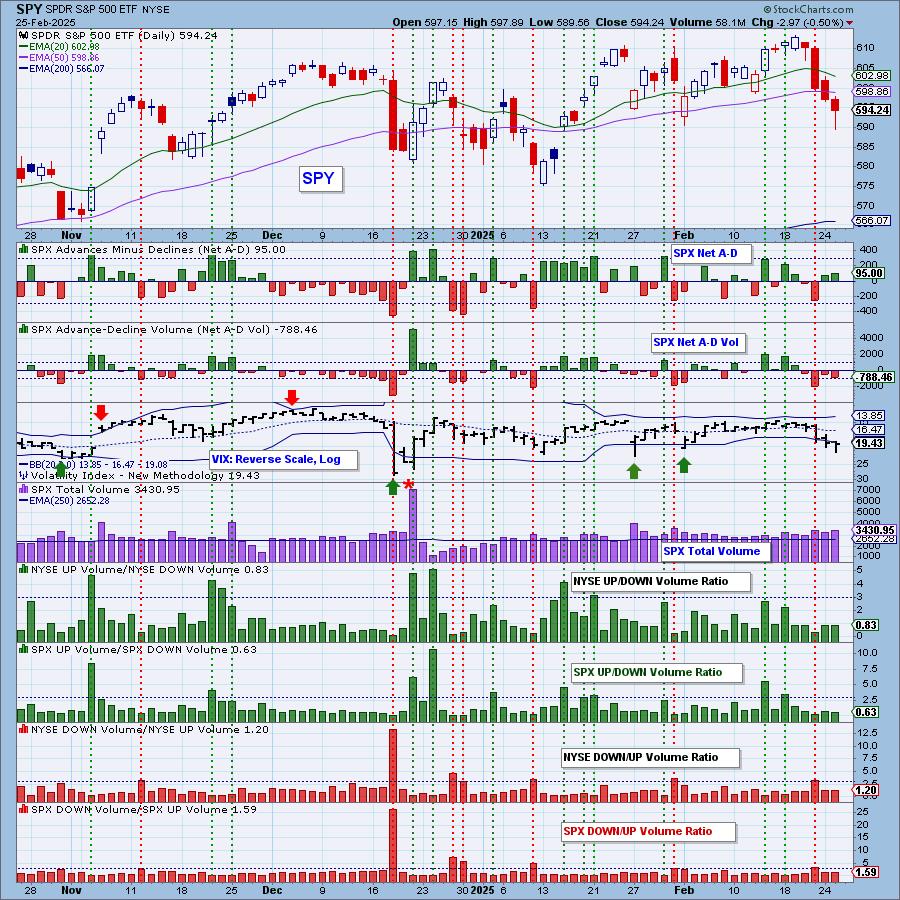
*A climax is a one-day event when market action generates very high readings in, primarily, breadth and volume indicators. We also include the VIX, watching for it to penetrate outside the Bollinger Band envelope. The vertical dotted lines mark climax days -- red for downside climaxes, and green for upside. Climaxes are at their core exhaustion events; however, at price pivots they may be initiating a change of trend.
Short-Term Market Indicators: The short-term market trend is DOWN and the condition is NEUTRAL.
Swenlin Trading Oscillators (STOs) continued to fall today with the STO-V hitting negative territory. In another positive turn of events, Participation of stocks above their 20-day EMAs rose on the decline and we saw more rising PMOs enter the equation. Still, readings are low for both of those indicators.
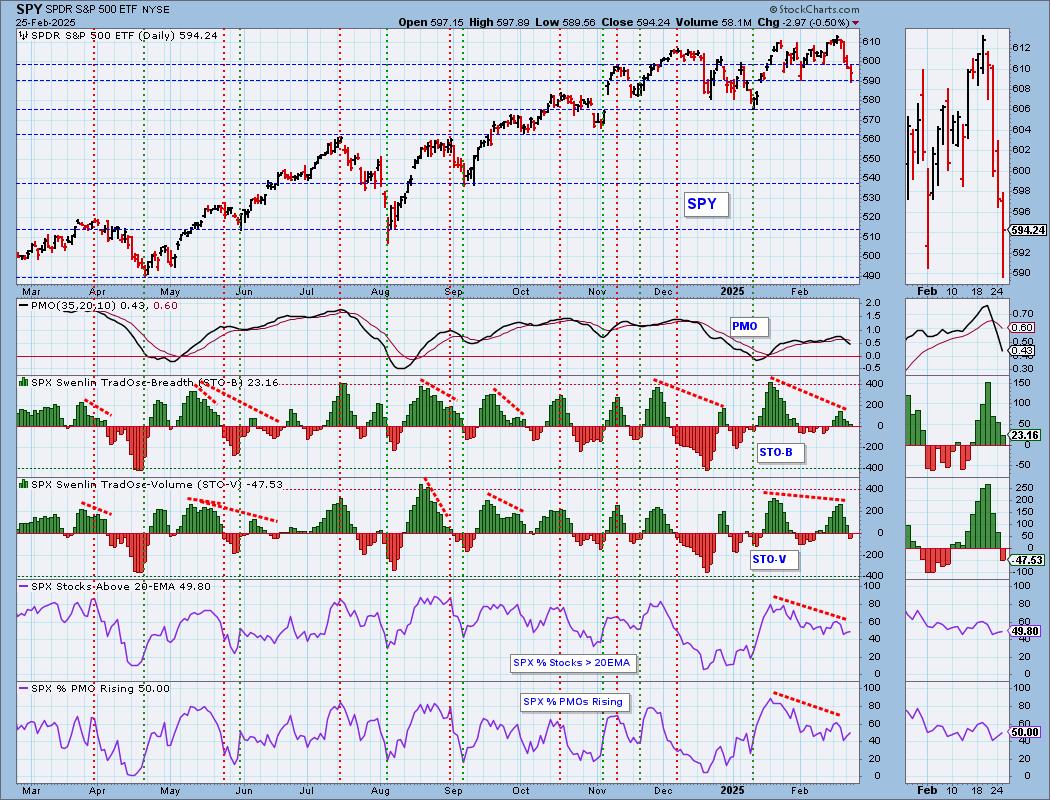
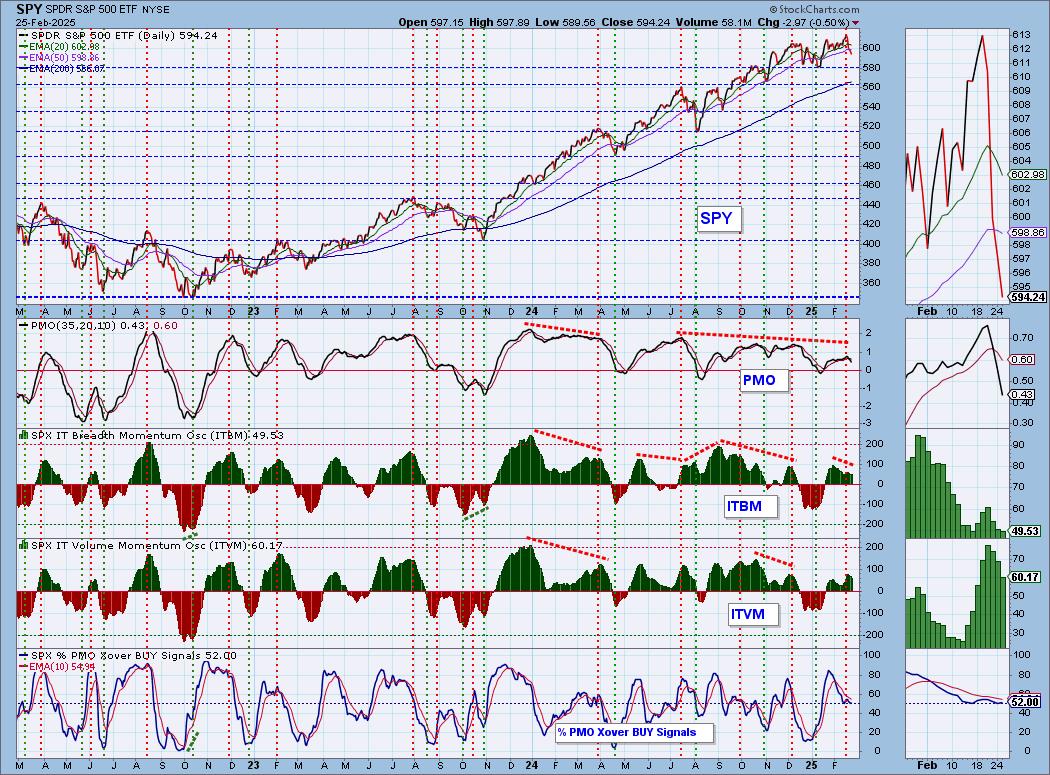
Intermediate-Term Market Indicators: The intermediate-term market trend is UP and the condition is NEUTRAL.
The ITBM and ITVM continue to confirm declining STOs with their own declines. %PMO Xover BUY Signals held steady today at 52%. Since only 50% have rising PMOs, it could decline further or stagnate at this level.
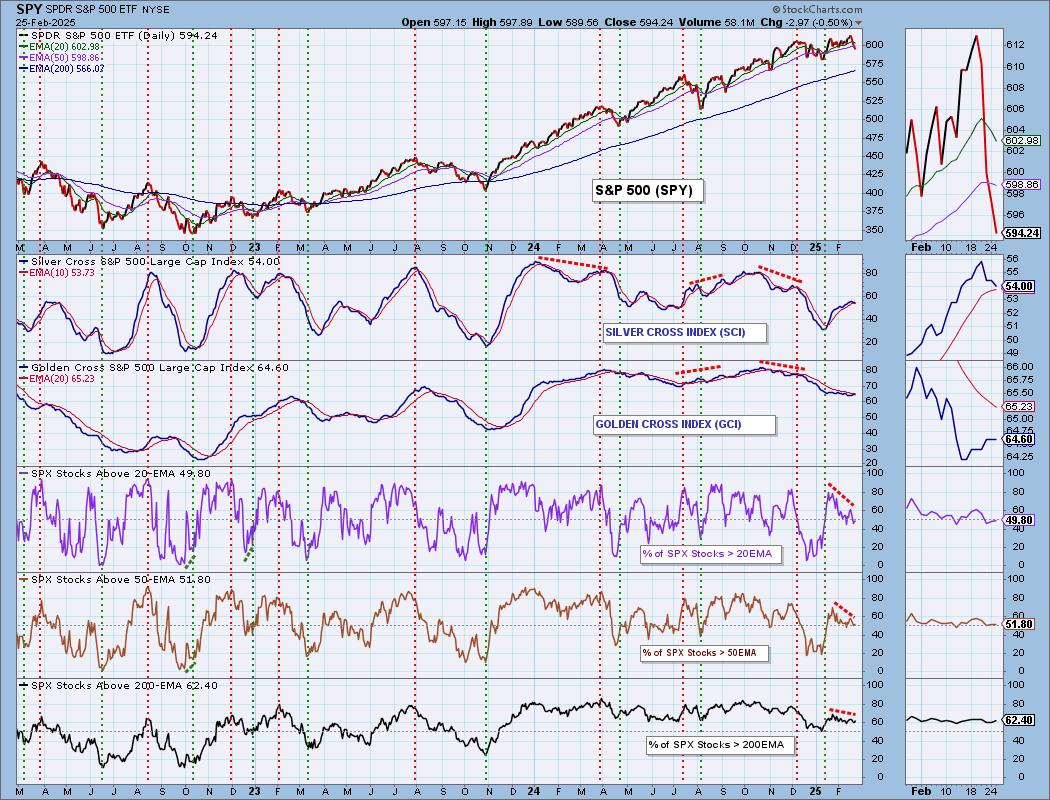
PARTICIPATION CHART (S&P 500): The following chart objectively shows the depth and trend of participation for the SPX in two time frames.
- Intermediate-Term - the Silver Cross Index (SCI) shows the percentage of SPX stocks on IT Trend Model BUY signals (20-EMA > 50-EMA). The opposite of the Silver Cross is a "Dark Cross" -- those stocks are, at the very least, in a correction.
- Long-Term - the Golden Cross Index (GCI) shows the percentage of SPX stocks on LT Trend Model BUY signals (50-EMA > 200-EMA). The opposite of a Golden Cross is the "Death Cross" -- those stocks are in a bear market.
All of the %Stocks > 20/50/200EMAs rose on today's decline. Not by much, but still that is positive on a decline. The Silver Cross Index is in decline and nearing a Bearish Shift across the signal line. Unless we get more stocks above their 50-day EMA, the Silver Cross Index is likely to continue lower. The Silver Cross Index is still holding above its signal line so for the time being the IT Bias is BULLISH. The Golden Cross Index has stagnated. We need more stocks above their 200-day EMA in order to get the Index moving higher. It is below its signal line so the LT Bias still reads BEARISH.
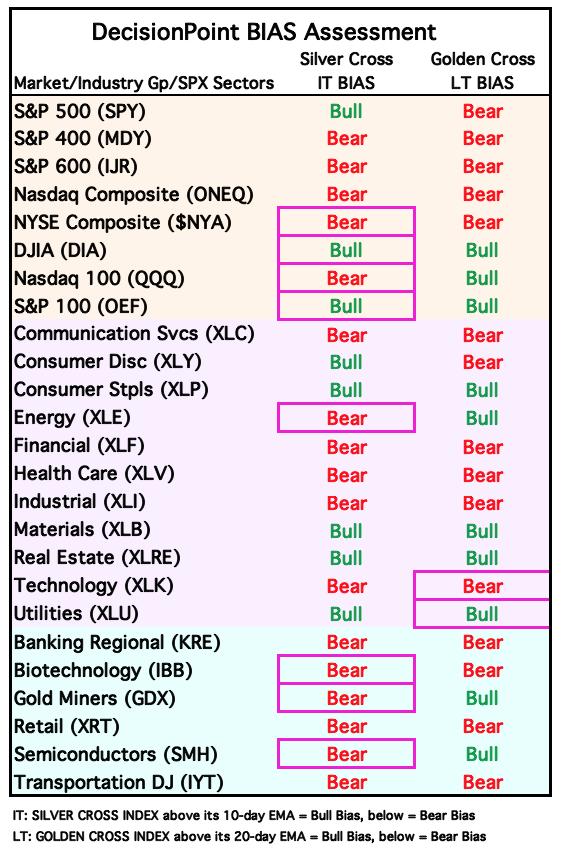
BIAS Assessment: The following table expresses the current BIAS of various price indexes based upon the relationship of the Silver Cross Index to its 10-day EMA (intermediate-term), and of the Golden Cross Index to its 20-day EMA (long-term). When the Index is above the EMA it is bullish, and it is bearish when the Index is below the EMA. The BIAS does not imply that any particular action should be taken. It is information to be used in the decision process.
The items with highlighted borders indicate that the BIAS changed today.
*****************************************************************************************************
CONCLUSION: There is a bearish bias in the short term based on the Bias Table above which is seeing more switches to "Bear" on the Silver Cross Index. However we did see small signs that we could see a small bounce off this level of horizontal support. The High-Low Differential turned up, there was positive Net A-D today and participation actually improved somewhat on the decline. Don't get too excited, the mega-caps aren't participating fully and that could continue to weigh heavy on the index. If we do see a bounce, think "dead cat bounce", likely a last gasp rather than the beginning of a new up leg.
Erin is 10% long, 0% short. (This is intended as information, not a recommendation.)
*****************************************************************************************************
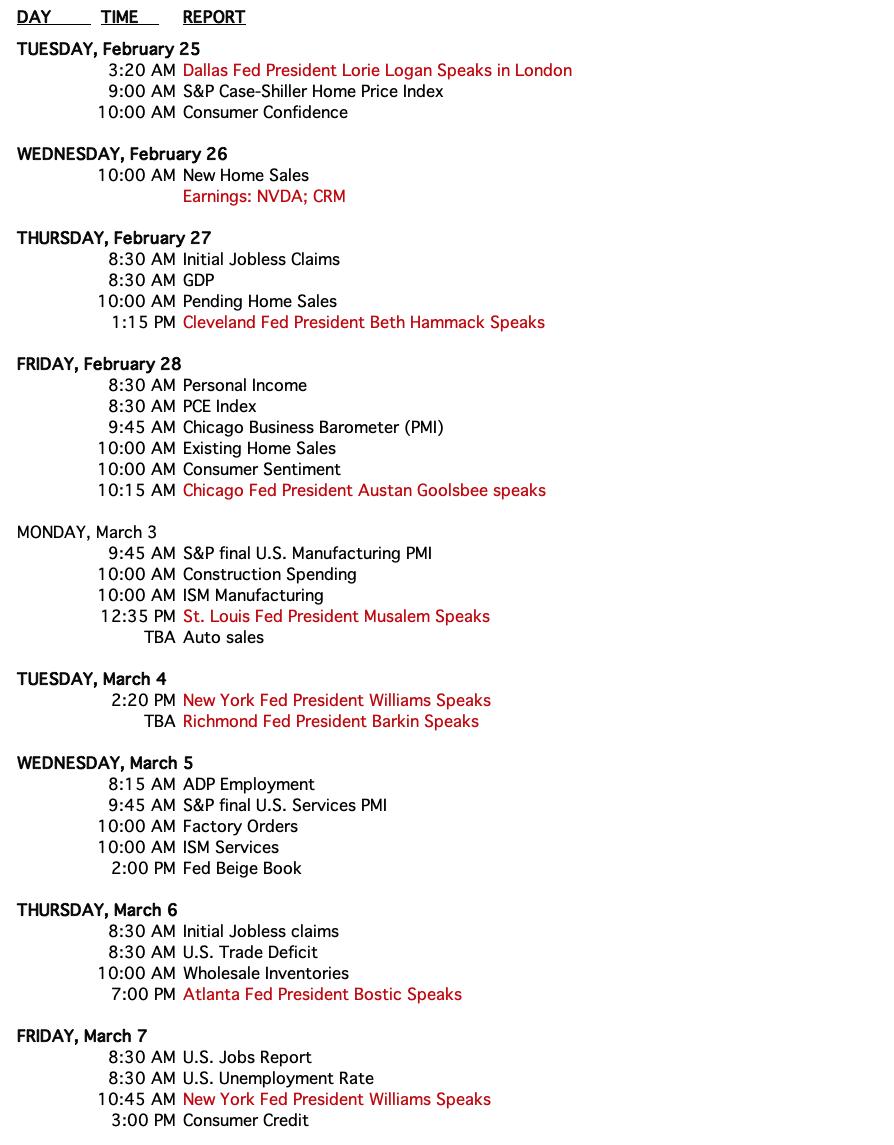
CALENDAR
Have you subscribed the DecisionPoint Diamonds yet? DP does the work for you by providing handpicked stocks/ETFs from exclusive DP scans! Add it with a discount! Contact support@decisionpoint.com for more information!
BITCOIN
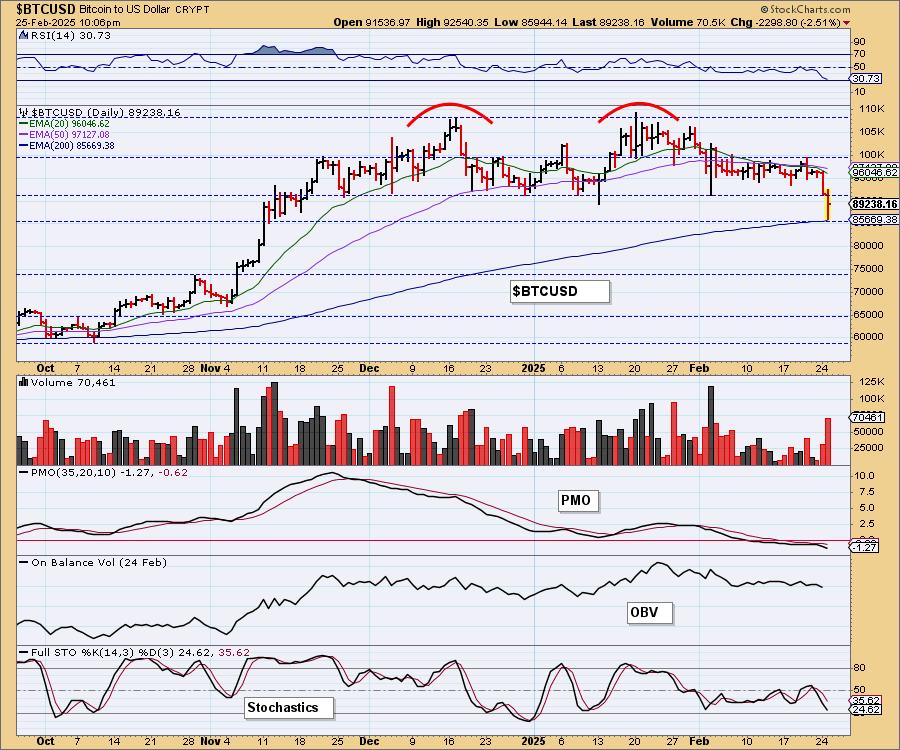
Bitcoin finally gave up support. It did land on a new level of support 85,000 and the 200-day EMA, but this doesn't bode well given the large bearish double top pattern. The downside target of the pattern would take price close to 75,000 which would be painful. The PMO is picking up speed to the downside and the RSI is very negative with Stochastics falling toward 20. We could see a small bounce here since support was reached, but given the double top, it isn't likely to stop here.
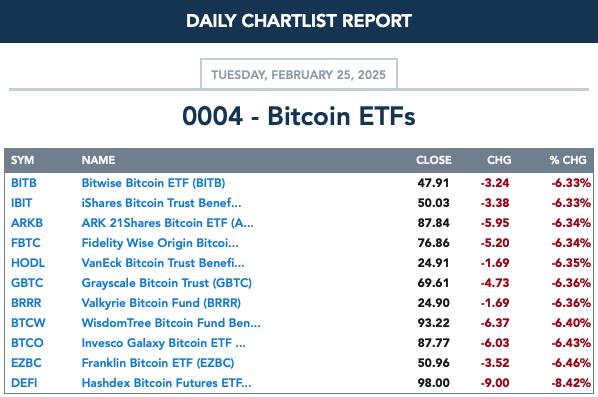
BITCOIN ETFs
INTEREST RATES
Yields are in decline as more investors move to Bonds. Bond charts are looking much more bullish so we would expect interest rates to continue lower.
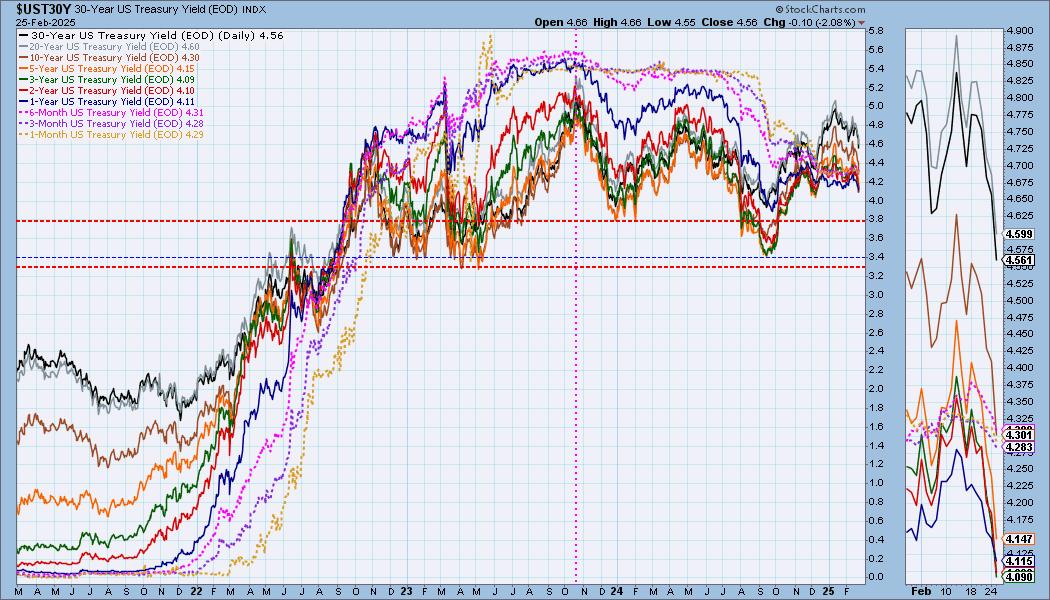
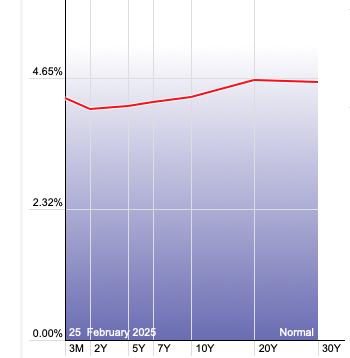
The Yield Curve Chart from StockCharts.com shows us the inversions taking place. The red line should move higher from left to right. Inversions are occurring where it moves downward.
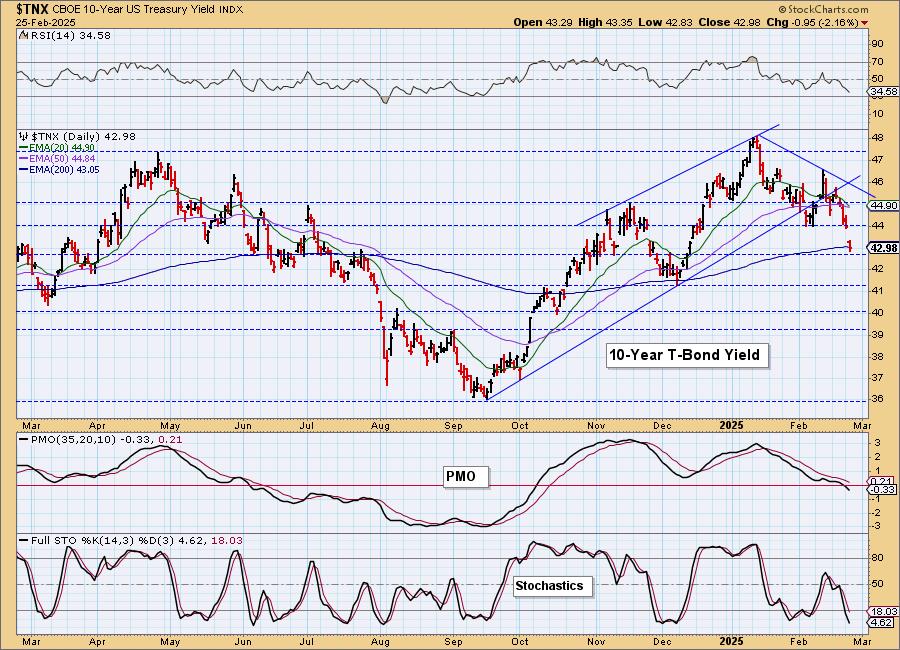
10-YEAR T-BOND YIELD
$TNX dropped heavily today and broke below another level of support at the 200-day EMA. The PMO has entered negative territory and Stochastics are very weak below 20. We believe there is more downside to absorb. 4.1% seems the next level of strong support.
BONDS (TLT)
IT Trend Model: BUY as of 2/25/2025
LT Trend Model: SELL as of 12/13/2024
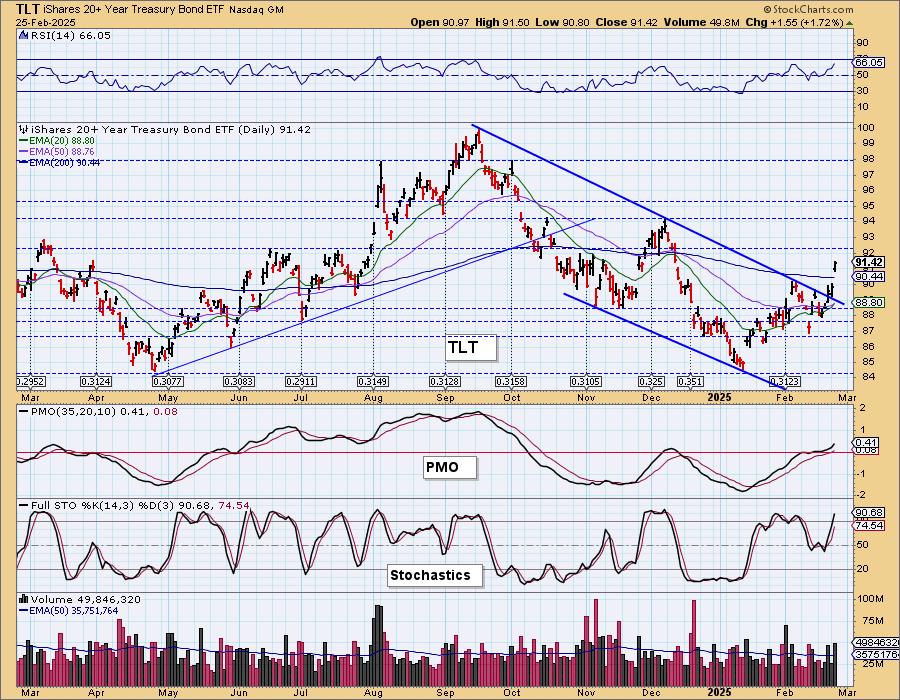
TLT Daily Chart: Today the 20+ Year Treasury Bond ETF (TLT) 20-day EMA crossed up through the 50-day EMA (Silver Cross), generating an IT Trend Model BUY Signal. Bonds are very bullish right now. We saw a breakout above the 200-day EMA in conjunction with the Silver Cross. Indicators are very bullish and yields look especially bearish right now so we would expect to see more upside out of TLT.

We now have a breakout from the longer-term declining trend channel which does imply more upside to go. 92.50 is arriving as overhead resistance, but we would look for price to get back to about 94 before turning back down.
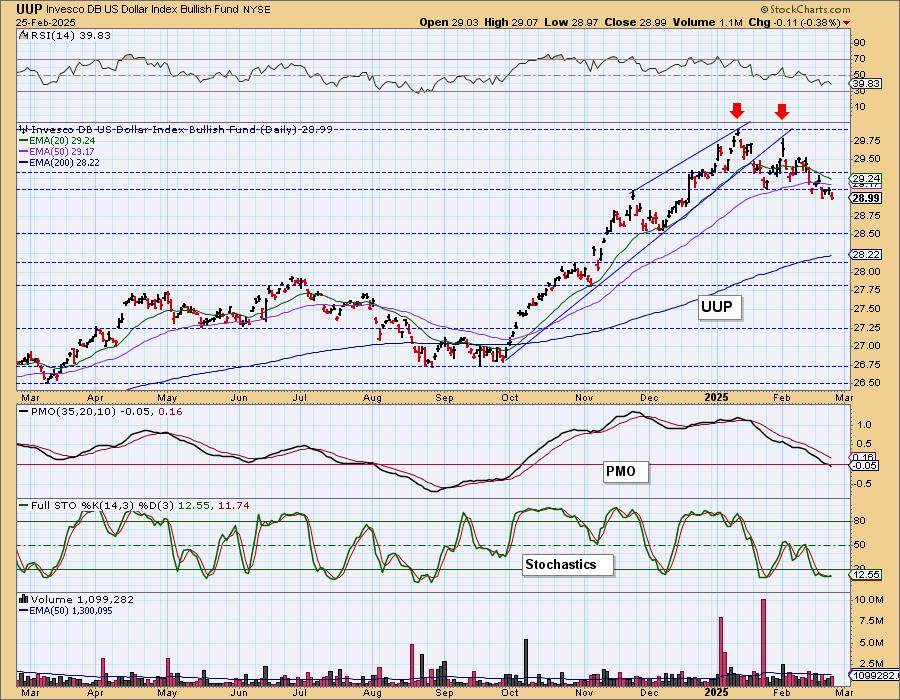
DOLLAR (UUP)
IT Trend Model: BUY as of 10/9/2024
LT Trend Model: BUY as of 5/25/2023
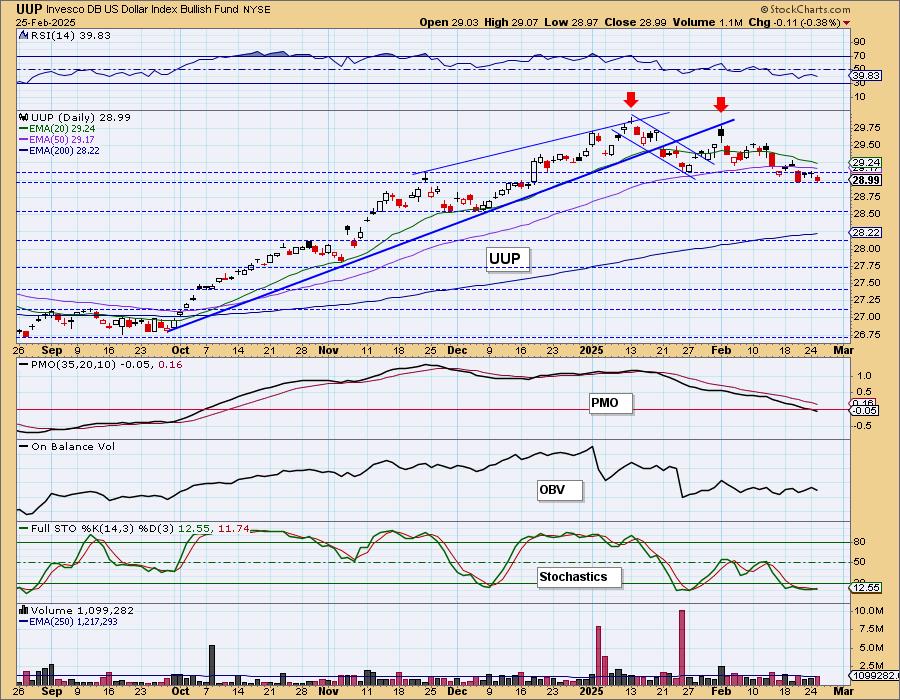
UUP Daily Chart: The Dollar refuses to breakdown. Given the large bearish double top and the broken confirmation line of the pattern, we continue to wait for that breakdown. The PMO is now in negative territory and Stochastics are camped out below 20 indicating extreme weakness.
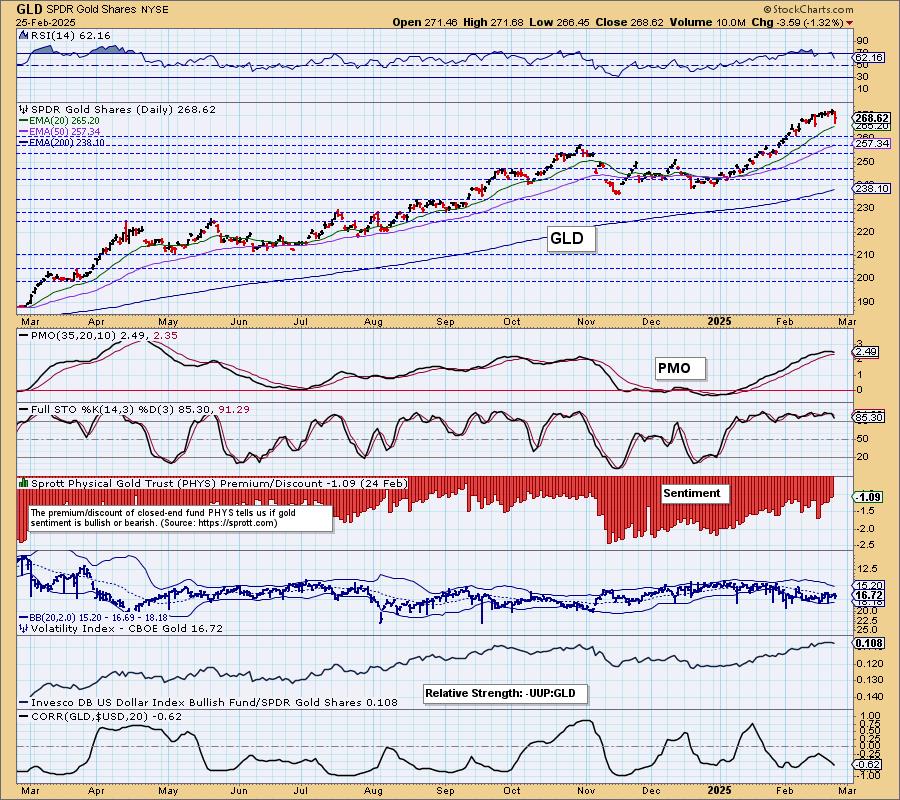
GOLD
IT Trend Model: BUY as of 1/10/2025
LT Trend Model: BUY as of 10/20/2023
GLD Daily Chart: We've been waiting for a pullback in Gold and today we got one despite the Dollar being down. Price is now back on the prior rising bottoms trendline. The PMO has topped, but good news is that the RSI is no longer overbought so we could get more upside again. Stochastics remain above 80. We do think Gold is vulnerable to a pullback given the PMO. However, the Dollar does look very weak and that could work in Gold's favor, preventing a more substantial pullback.
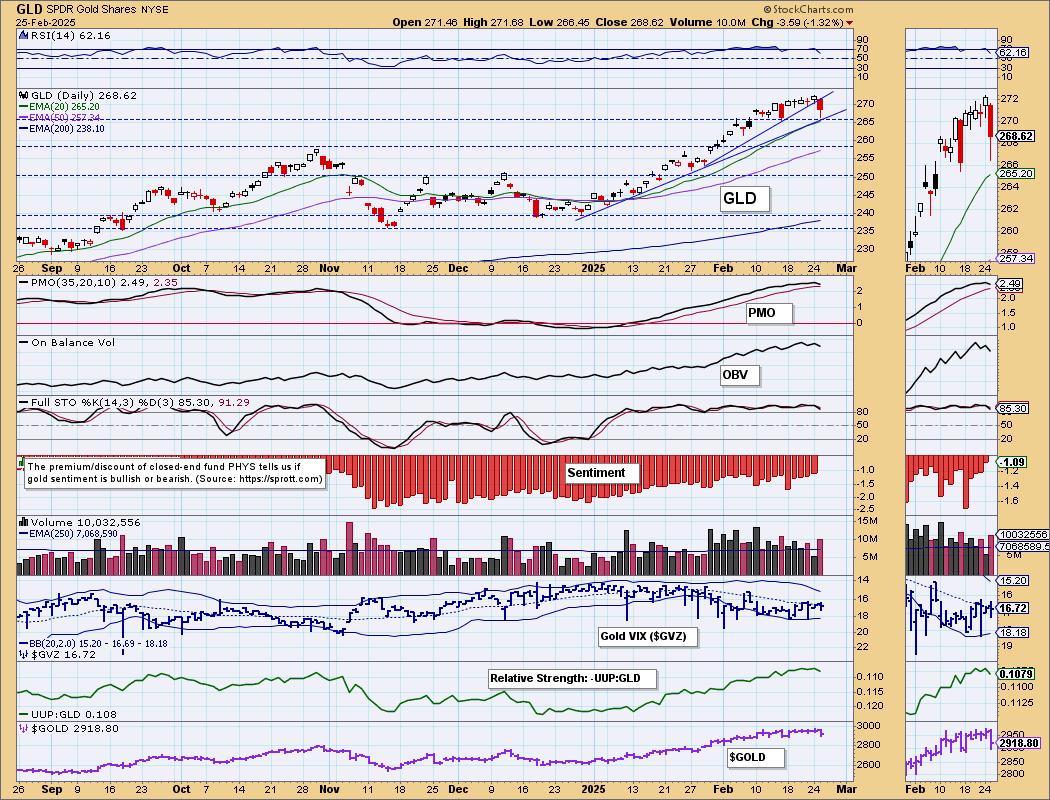
Discounts have pared back to 'bullish' levels (remember we generally don't see premiums) and that may not work in its favor given sentiment is contrarian. The correlation between Gold and the Dollar is negative as we generally see. This is good right now given the Dollar's negative outlook.
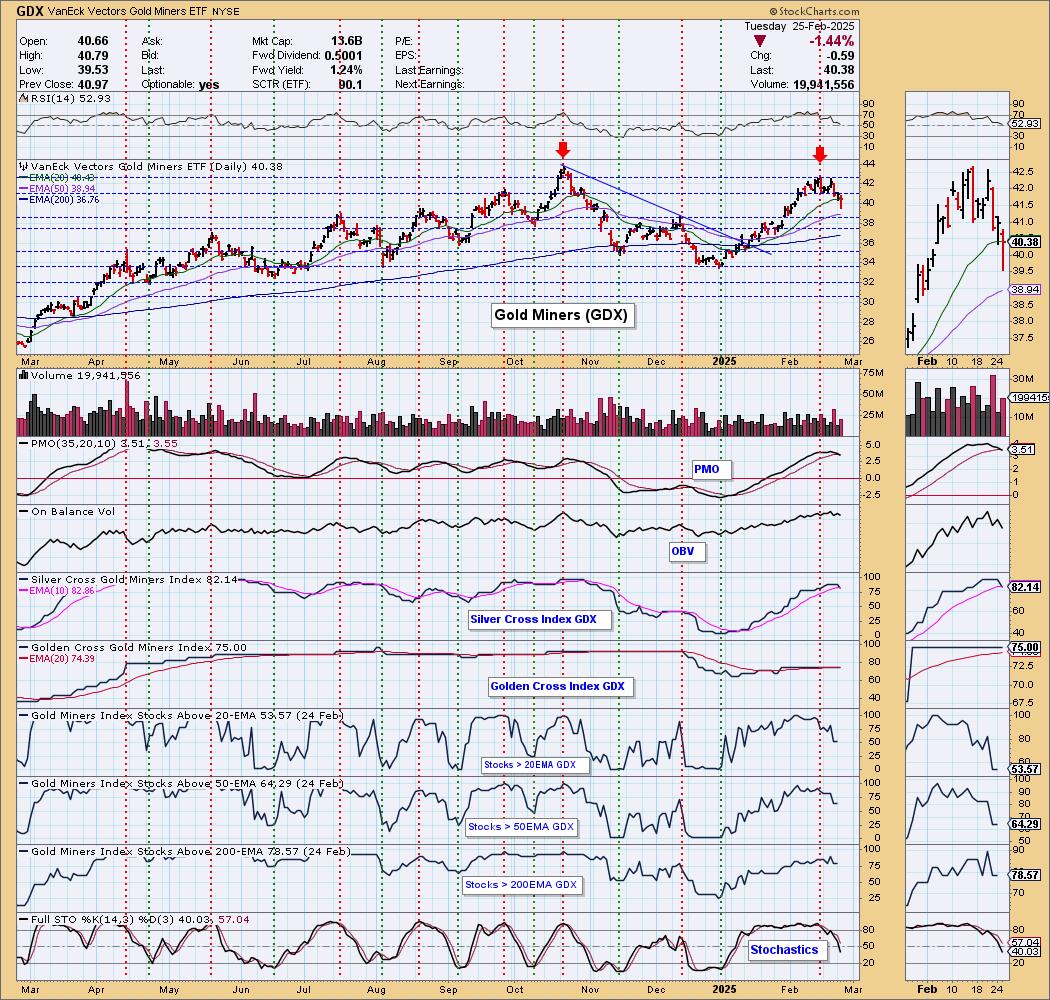
GOLD MINERS (GDX) Daily Chart: GDX has topped and we suspect it will fall further from here, especially if Gold isn't done with its pullback. The PMO gave us a new Crossover SELL Signal today and the Silver Cross Index had a Bearish Shift across its signal line. Participation continues to bleed out and Stochastics are tumbling suggesting there is more decline to absorb.
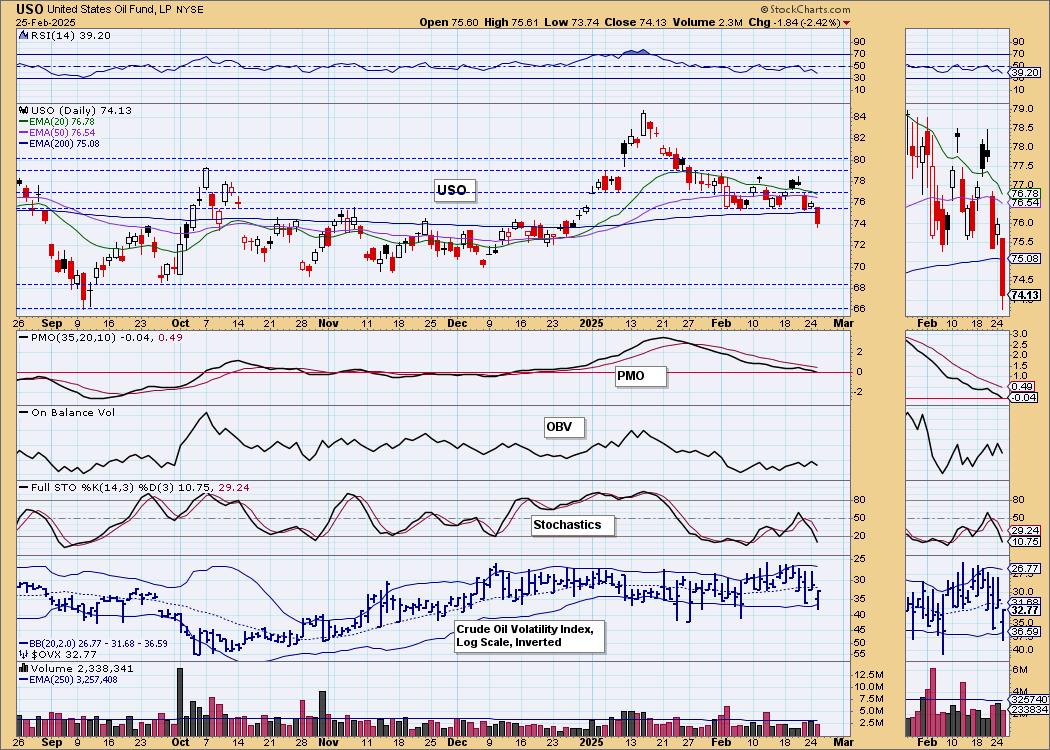
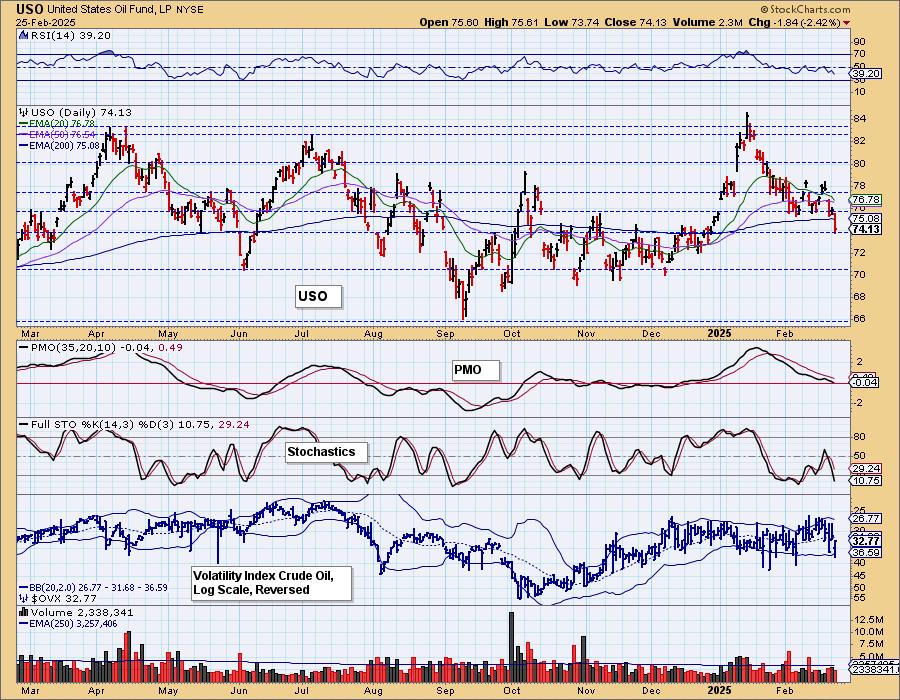
CRUDE OIL (USO)
IT Trend Model: BUY as of 12/24/2024
LT Trend Model: BUY as of 1/10/2025
USO Daily Chart: We discussed yesterday how we thought support was weak here. Price dropped below that support level and penetrated the 200-day EMA on the way down. The PMO has now moved into negative territory and Stochastics have dropped below 20. We would look for Crude to continue lower from here.
Good Luck & Good Trading!
Erin Swenlin and Carl Swenlin
Technical Analysis is a windsock, not a crystal ball. --Carl Swenlin
(c) Copyright 2025 DecisionPoint.com
Disclaimer: This blog is for educational purposes only and should not be construed as financial advice. The ideas and strategies should never be used without first assessing your own personal and financial situation, or without consulting a financial professional. Any opinions expressed herein are solely those of the author, and do not in any way represent the views or opinions of any other person or entity.
DecisionPoint is not a registered investment advisor. Investment and trading decisions are solely your responsibility. DecisionPoint newsletters, blogs or website materials should NOT be interpreted as a recommendation or solicitation to buy or sell any security or to take any specific action.
NOTE: The signal status reported herein is based upon mechanical trading model signals, specifically, the DecisionPoint Trend Model. They define the implied bias of the price index based upon moving average relationships, but they do not necessarily call for a specific action. They are information flags that should prompt chart review. Further, they do not call for continuous buying or selling during the life of the signal. For example, a BUY signal will probably (but not necessarily) return the best results if action is taken soon after the signal is generated. Additional opportunities for buying may be found as price zigzags higher, but the trader must look for optimum entry points. Conversely, exit points to preserve gains (or minimize losses) may be evident before the model mechanically closes the signal.
Helpful DecisionPoint Links:
DecisionPoint Alert Chart List
DecisionPoint Golden Cross/Silver Cross Index Chart List
DecisionPoint Sector Chart List
Price Momentum Oscillator (PMO)