
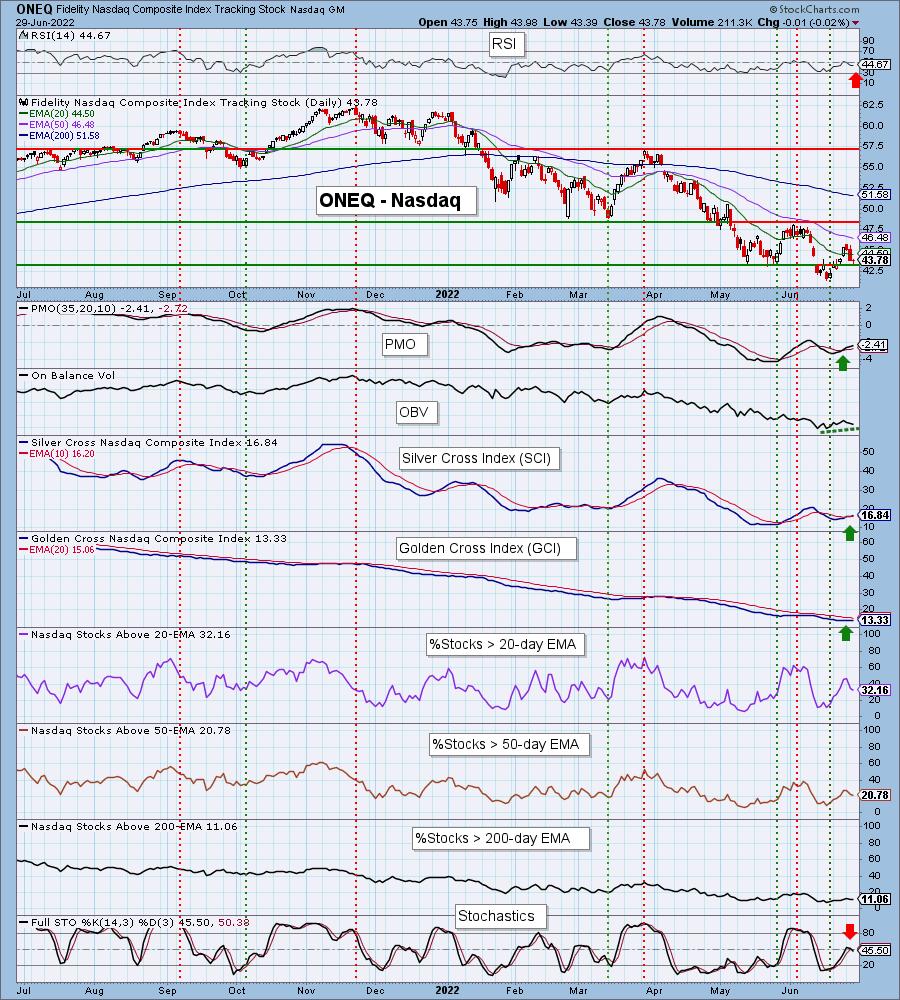
We talk about the SPY all the time. We thought it was time to check "under the hood" on the Nasdaq (ONEQ). Obviously price movement and patterns are very similar to the SPY with price holding support on today's small decline.
The chart is certainly mixed. On the bearish side, we have a negative RSI and Stochastics have topped well below the bullish threshold of 80. Stochastics are also in negative territory. On the positive side there is a rising Silver Cross Index (SCI) that just had a positive crossover. We also have a "bull stack" on %Stocks > 20/50/200-day EMAs ("bull stack" = (%Stocks > 20-day EMA) > (%Stocks > 50-day EMA) > (%Stocks > 200-day EMA)). A "bull stack" implies new strength coming in; particularly when the EMAs of the index are configured negatively (fastest EMA on the bottom and slowest on top). The first thing a stock will do when EMAs are configured negatively is cross above the 20-day EMA, followed by the 50-day EMA, etc.
Given the mixed indicators and participation, we would read the short-term bias as still being bullish for the Nasdaq, but deteriorating as we write. This support level is critical in our minds to keep that short-term bullish bias alive.
The intermediate-term bias is bearish, but is improving somewhat given the rising SCI. Still, with an SCI at only 17%, we have to read the bias as bearish.
The long-term bias is also bearish. Not only is the GCI at a very low 13%, the %Stocks > 200-day EMA is only 11%. This is very bearish for the long term.
The DecisionPoint Alert Weekly Wrap presents an end-of-week assessment of the trend and condition of the Stock Market, the U.S. Dollar, Gold, Crude Oil, and Bonds. The DecisionPoint Alert daily report (Monday through Thursday) is abbreviated and gives updates on the Weekly Wrap assessments.
Watch the latest episode of DecisionPoint on StockCharts TV's YouTube channel here!
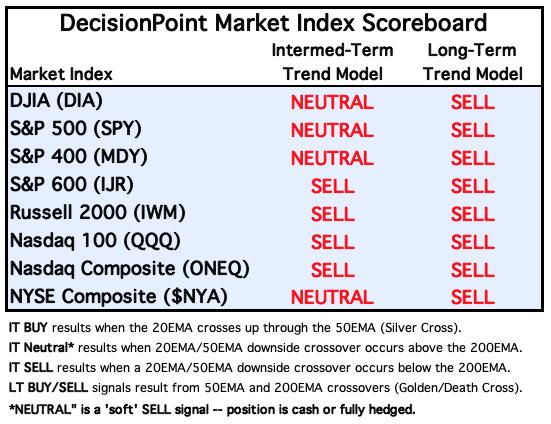
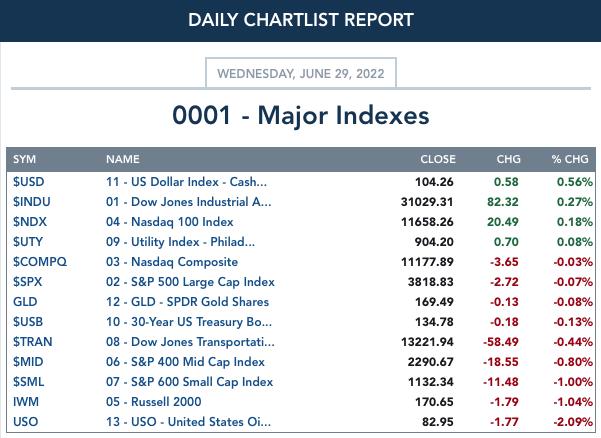
MAJOR MARKET INDEXES
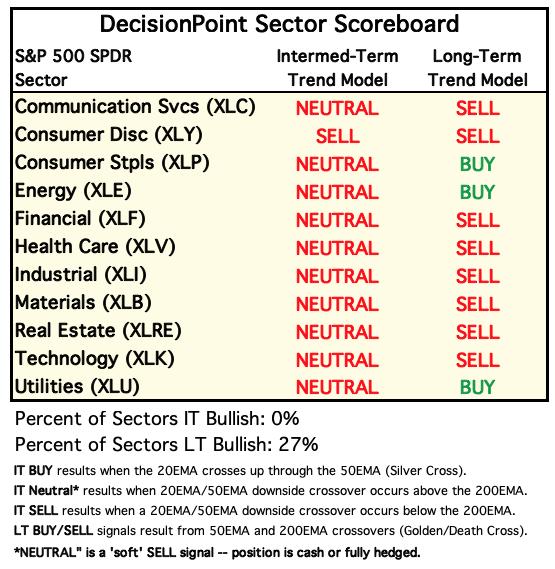
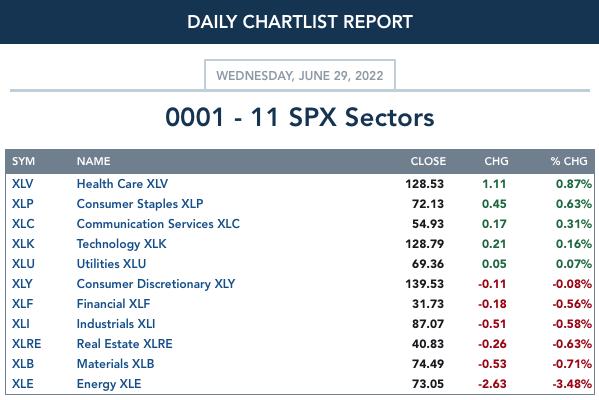
SECTORS
Each S&P 500 Index component stock is assigned to one of 11 major sectors. This is a snapshot of the Intermediate-Term (Silver Cross) and Long-Term (Golden Cross) Trend Model signal status for those sectors.
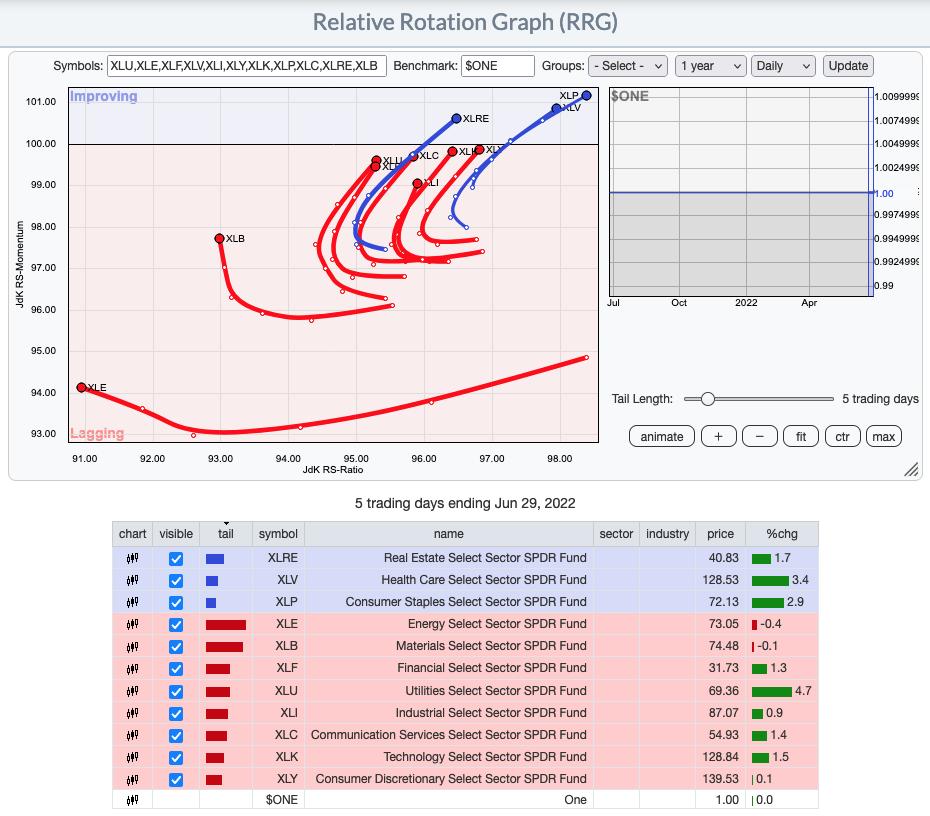
RRG® Chart: We are using $ONE as our benchmark so that the RRGs reflect overall performance rather than relative performance against the SPY.
Daily: All of the sectors now have bullish northeast headings with the exception of Energy and Materials. This tells us that a bear market rally is occurring and should continue further, led by the Consumer Staples, Real Estate and Healthcare sectors.
Weekly: The weekly $ONE RRG has looked extraordinarily bearish, but we are starting to see some improvement in the longer term. None of the sectors have bullish northeast headings, but a few are beginning to travel northward toward the Improving quadrant (XLC, XLV and XLF). This RRG makes it clear that we are still in a long-term bear market.
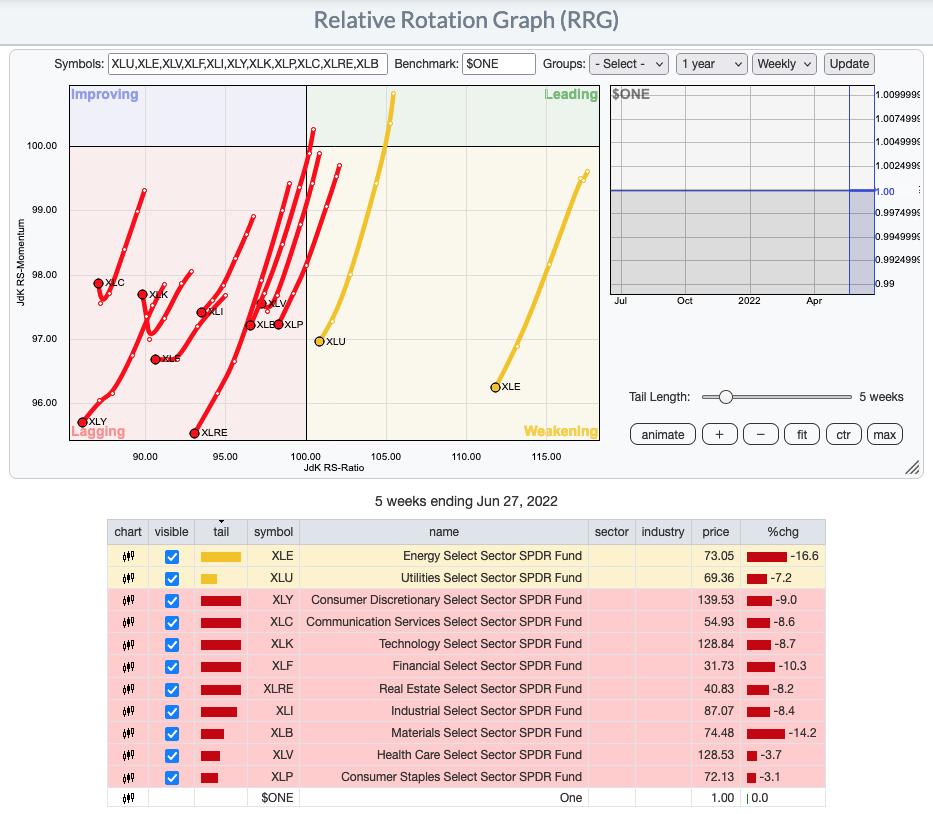
RRG® charts show you the relative strength and momentum for a group of stocks. Stocks with strong relative strength and momentum appear in the green Leading quadrant. As relative momentum fades, they typically move into the yellow Weakening quadrant. If relative strength then fades, they move into the red Lagging quadrant. Finally, when momentum starts to pick up again, they shift into the blue Improving quadrant.
CLICK HERE for an animated version of the RRG chart.
CLICK HERE for Carl's annotated Sector charts.
THE MARKET (S&P 500)
IT Trend Model: NEUTRAL as of 1/21/2022
LT Trend Model: SELL as of 5/5/2022
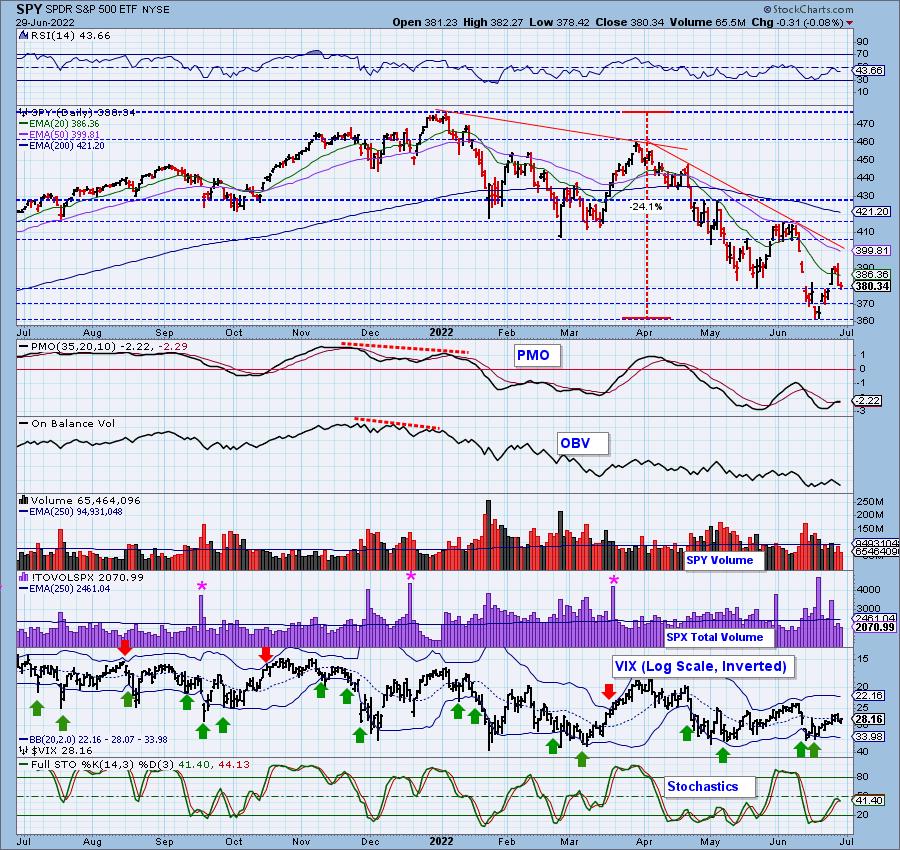
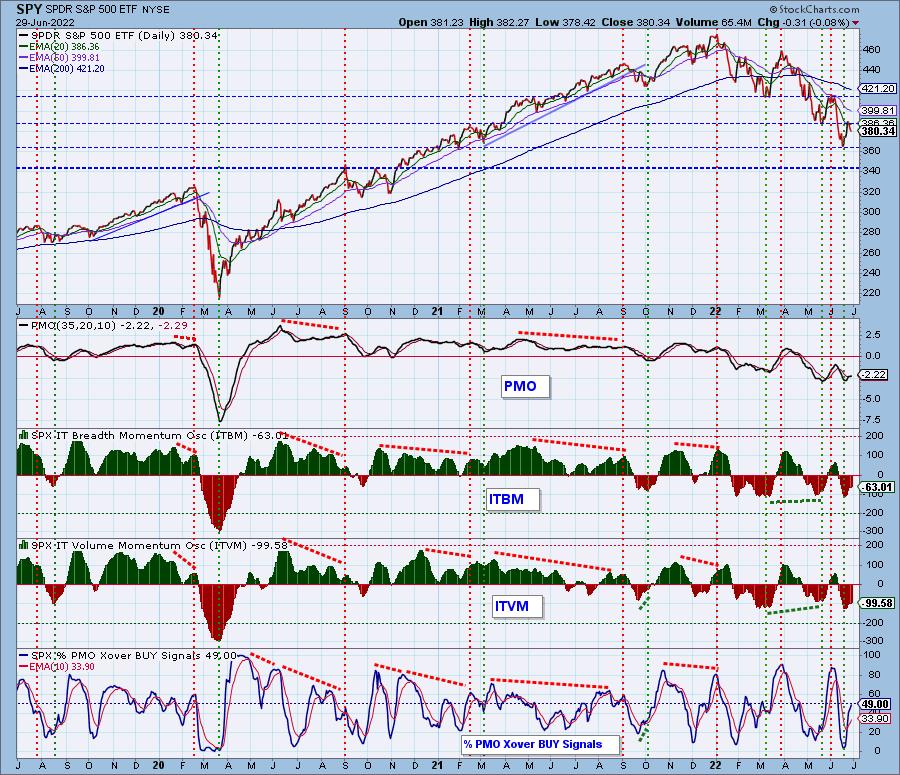
SPY Daily Chart: The market consolidated today and avoided a break below $380. The price pattern looks very much like a bullish cup with handle. The PMO is still rising on a crossover BUY signal. The RSI is negative after this third day of decline as expected. The VIX closed beneath its moving average on our inverted scale which suggests internal weakness is seeping in.
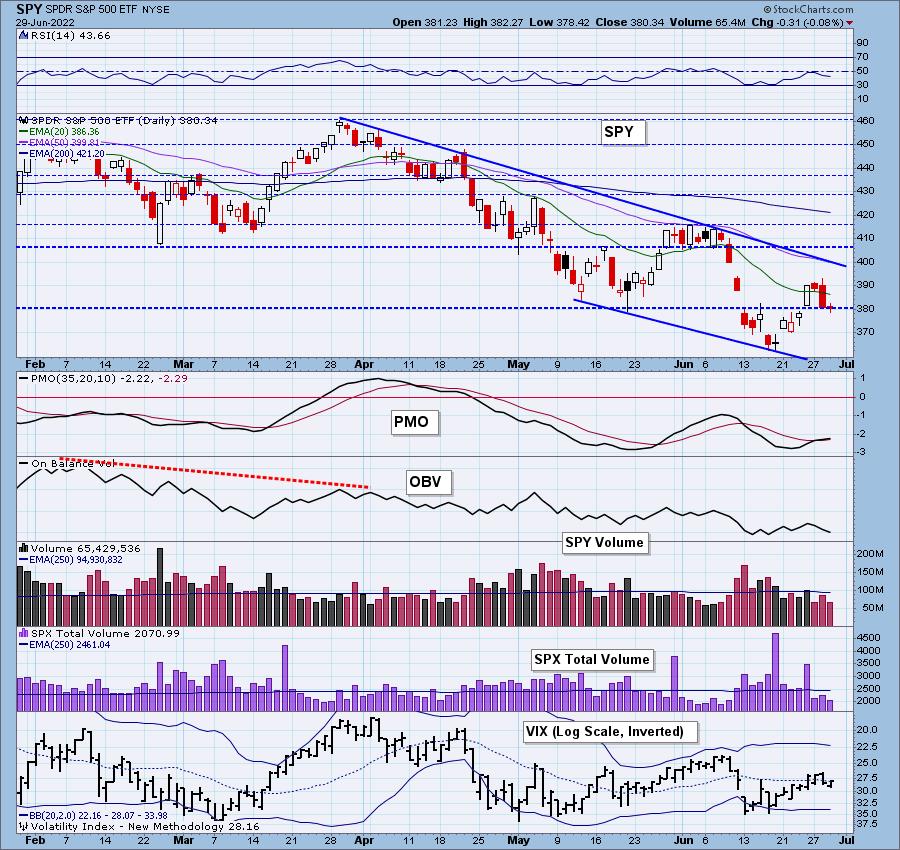
Stochastics turned over in negative territory which is bearish in the short term.

Here is the latest recording:
Topic: DecisionPoint Trading Room
Start Time: Jun 27, 2022 09:00 AM
Meeting Recording Link
Access Passcode: June#27th
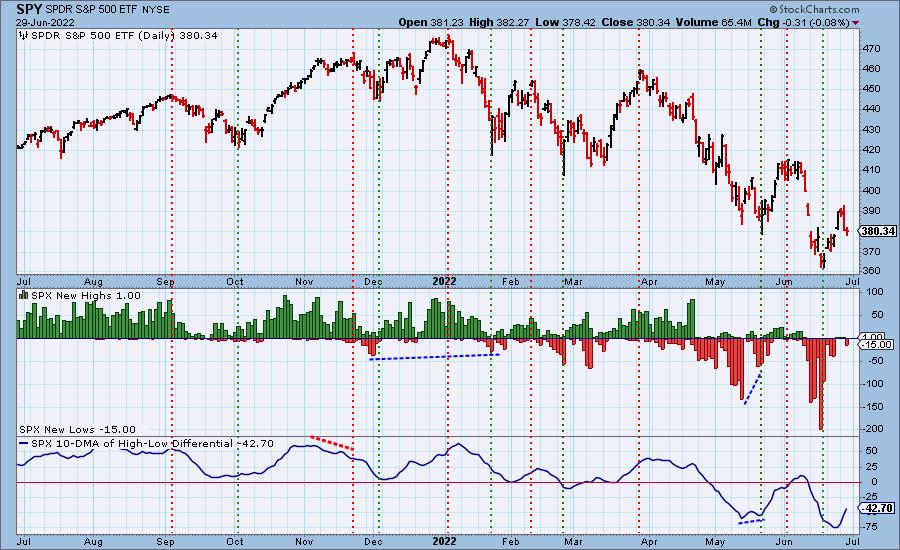
S&P 500 New 52-Week Highs/Lows: Yesterday's comments still apply:
"The 10-DMA of the High-Low Differential has turned back up in very oversold territory and is now rising strongly. This usually bodes well for the market."
Climax* Analysis: Today was a pause day following yesterday's downside initiation climax. There is still the potential for downside follow through, but the way price held on support today is a positive. Total Volume also decreased on today's selling.
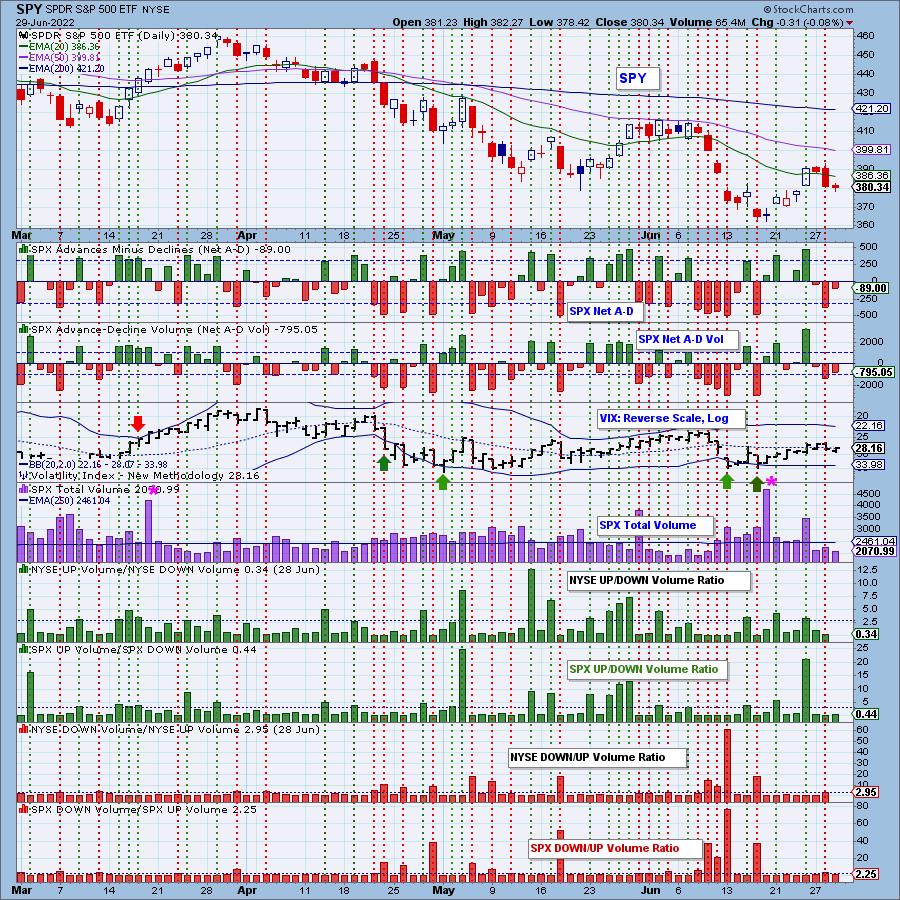
*A climax is a one-day event when market action generates very high readings in, primarily, breadth and volume indicators. We also include the VIX, watching for it to penetrate outside the Bollinger Band envelope. The vertical dotted lines mark climax days -- red for downside climaxes, and green for upside. Climaxes are at their core exhaustion events; however, at price pivots they may be initiating a change of trend.
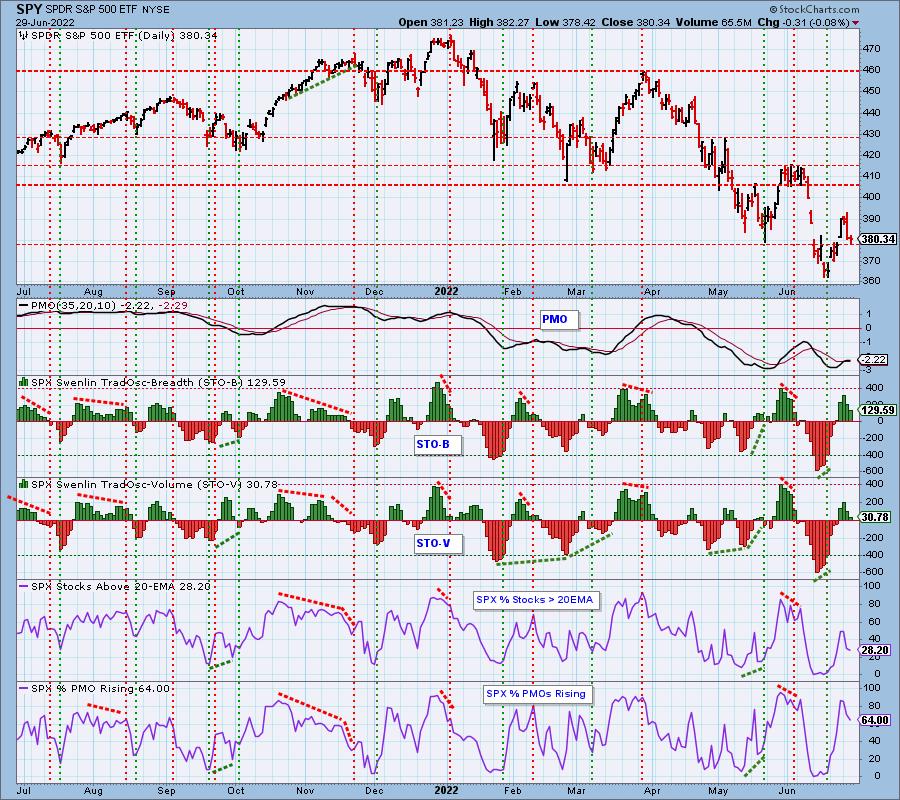
Short-Term Market Indicators: The short-term market trend is UP and the condition is NEUTRAL.
STOs continue to fall, but we haven't seen extreme damage to price. We have 68% of the SPX with rising momentum. That could certainly carry the market higher, but the deterioration is unsettling.
Intermediate-Term Market Indicators: The intermediate-term market trend is DOWN and the condition is NEUTRAL.
IT indicators were somewhat mixed. The ITBM and %PMO BUY signals continue to rise, but the ITVM has started lower. The majority are favorable, but the ITVM suggests caution.
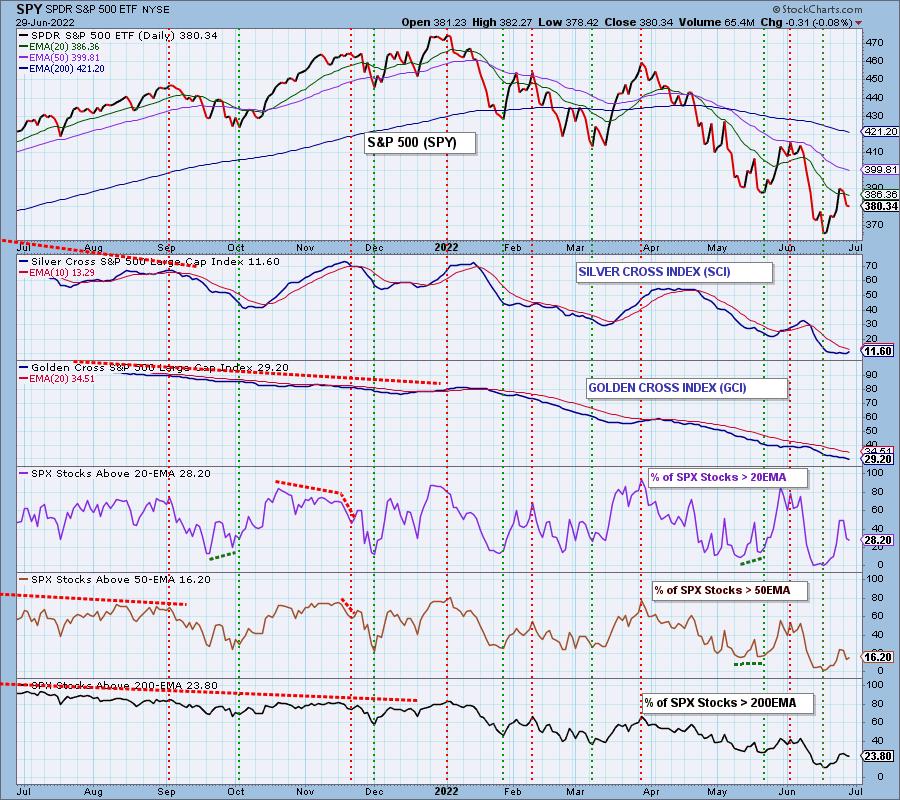
PARTICIPATION and BIAS Assessment: The following chart objectively shows the depth and trend of participation in two time frames.
- Intermediate-Term - the Silver Cross Index (SCI) shows the percentage of SPX stocks on IT Trend Model BUY signals (20-EMA > 50-EMA). The opposite of the Silver Cross is a "Dark Cross" -- those stocks are, at the very least, in a correction.
- Long-Term - the Golden Cross Index (GCI) shows the percentage of SPX stocks on LT Trend Model BUY signals (50-EMA > 200-EMA). The opposite of a Golden Cross is the "Death Cross" -- those stocks are in a bear market.
The short-term bullish bias is disintegrating. %Stocks > 20/50-day EMAs are shrinking but since percentage of stocks above 20/50-day EMAs are larger than the SCI, we will leave the short-term bias as bullish.
The intermediate-term bias is less bearish than it has been. The SCI is rising now but remains at a low 11.6%.
The long-term bias is bearish as the GCI is falling and reading at a low 29%. With %Stocks > 50/200-day EMAs lower than the GCI reading, it will not be possible to see more Golden Crosses. Hence the GCI should continue lower.
CONCLUSION: We got a slight decline off yesterday's downside initiation climax on little volume. We remain cautiously optimistic, but that optimism is deteriorating based on the falling STOs and contracting ITVM. Participation is still healthy enough to fuel more upside given the majority of stocks have rising momentum (68%) and almost half of the SPX are on PMO crossover BUY signals. The environment seems positive enough to add to your exposure, but be sure you are in the strongest industry groups and set hard stops.
Erin is 55% exposed. ALL positions have hard stops.
Have you subscribed the DecisionPoint Diamonds yet? DP does the work for you by providing handpicked stocks/ETFs from exclusive DP scans! Add it with a discount! Contact support@decisionpoint.com for more information!
BITCOIN
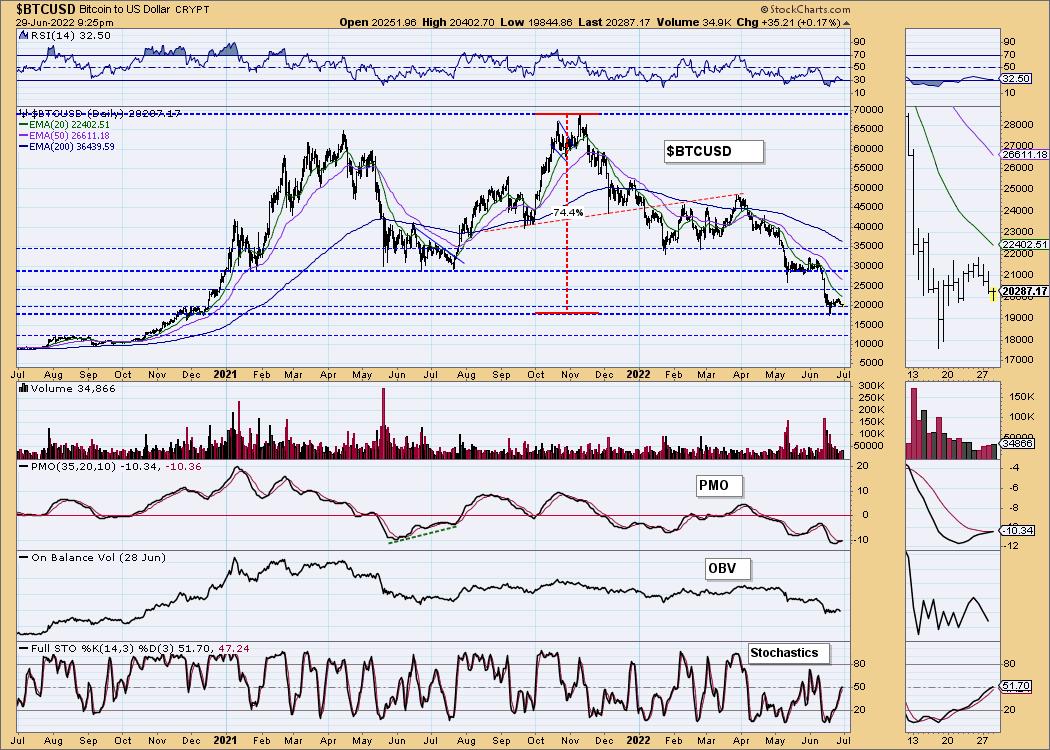
Bitcoin continues to cling to support at $20,000. The indicators are firming up with a new PMO crossover BUY signal and Stochastics rising and hitting positive territory. This hasn't resulted in higher prices. It took Bitcoin over a month of consolidation above support at $28,000 before it broke down. We expect something similar this time around with more sideways price action with a high likelihood of a breakdown.
INTEREST RATES
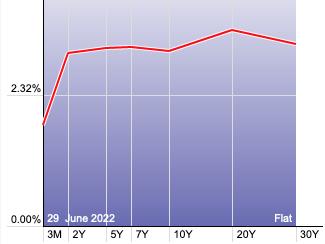
Long-term rates haven't broken their declining trends out of the recent top, suggesting rates are topping.
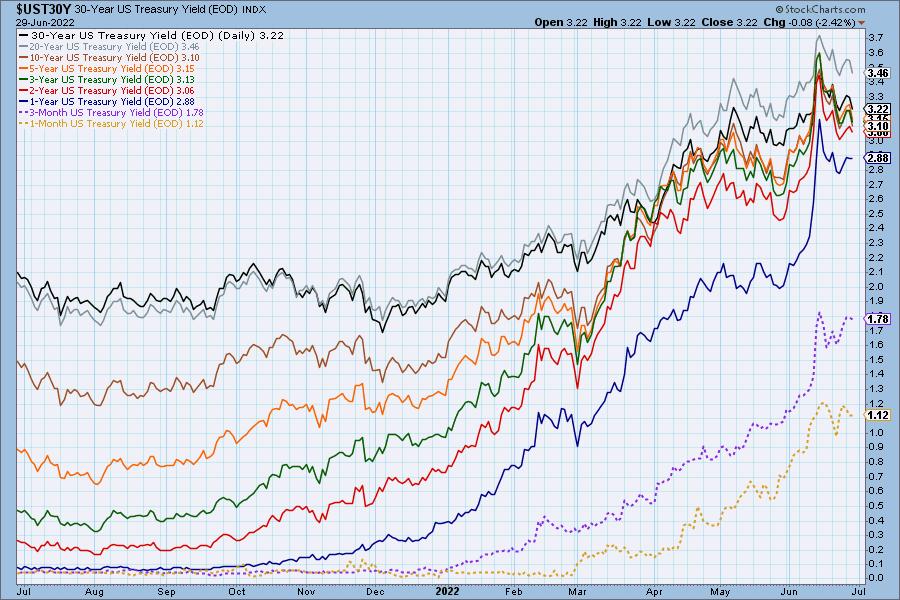
The Yield Curve Chart from StockCharts.com shows us the inversions taking place. The red line should move higher from left to right. Inversions are occurring where it moves downward.
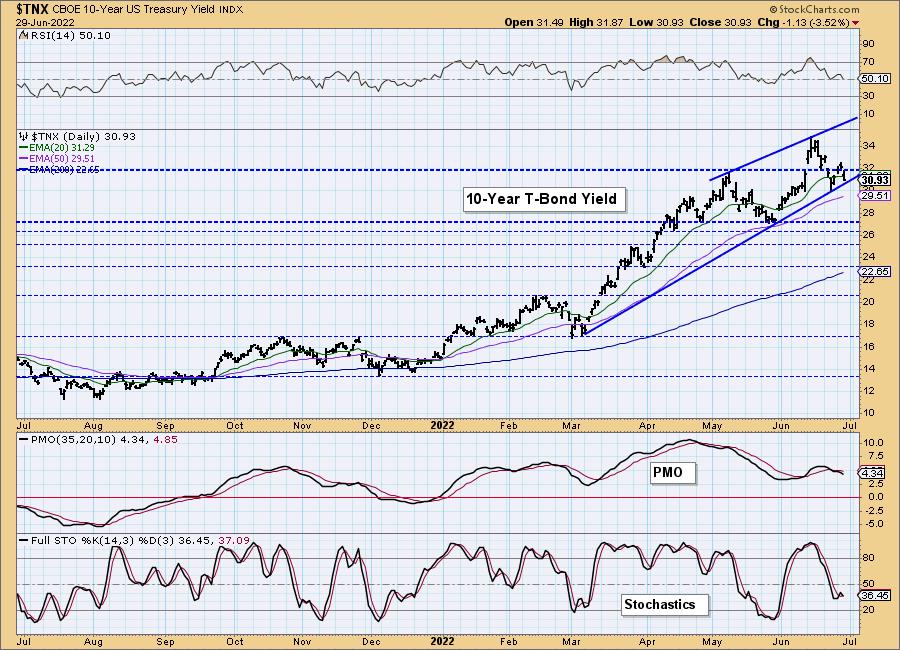
10-YEAR T-BOND YIELD
$TNX turned down before even coming close to testing the top of the bearish rising wedge. This tells us a breakdown is ahead. There is support at the 50-day EMA, but we expect a test of 2.7% soon.
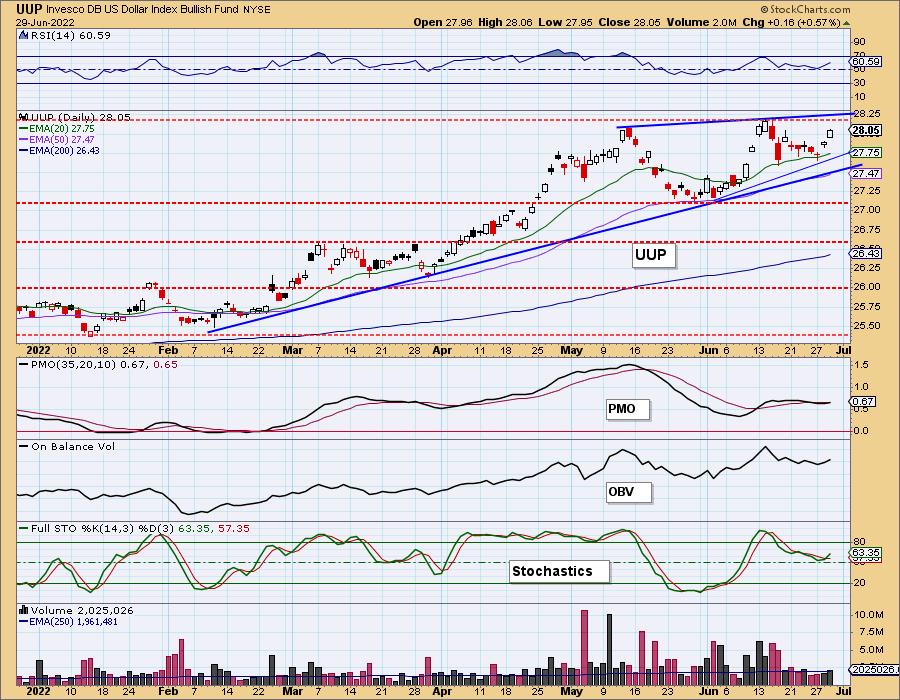
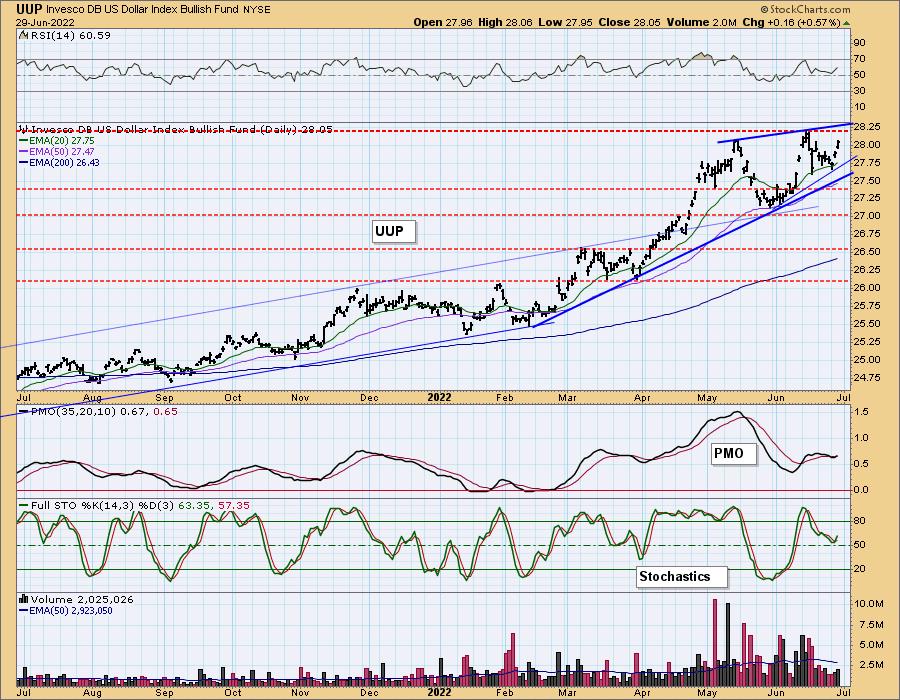
DOLLAR (UUP)
IT Trend Model: BUY as of 6/22/2021
LT Trend Model: BUY as of 8/19/2021
UUP Daily Chart: Yesterday's comments still apply:
Ha! Just after writing that we are scrapping the bullish cup with handle pattern, it finally executes. The pattern implies a breakout above resistance. The RSI remains in positive territory, but the PMO is still on a SELL signal. Even Stochastics turned up above net neutral (50). We now must wait to see if price is turned away at the overriding bearish rising wedge pattern in the intermediate term.
GOLD
IT Trend Model: NEUTRAL as of 5/3/2022
LT Trend Model: BUY as of 1/12/2022
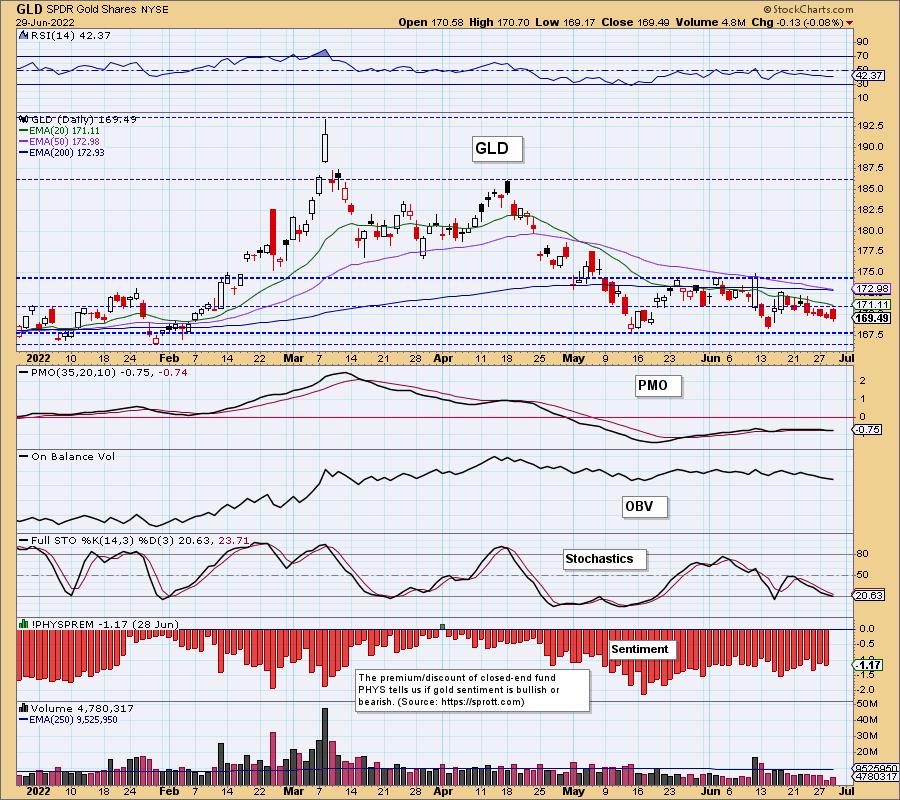
GLD Daily Chart: Gold continues to languish within its trading range. Today GLD put together a bearish engulfing candlestick. Given the Dollar is surging again, we would expect support to be tested at $167.50.
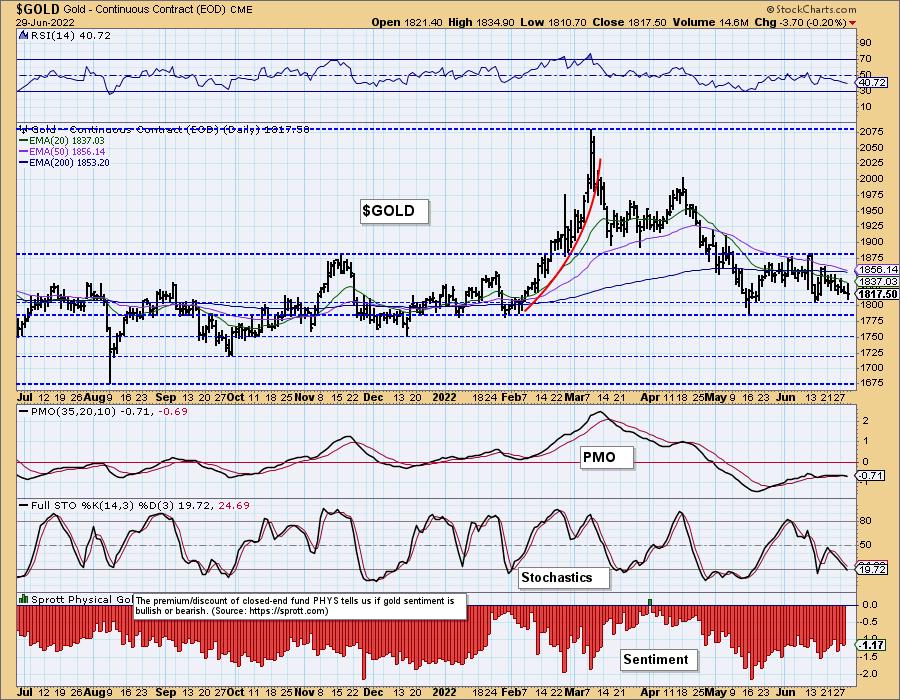
GOLD Daily Chart: A "Death Cross" of the 50/200-day EMAs is on tap for BOTH GLD and $GOLD. It wouldn't only be avoided if price got back above the 200-day EMA. That seems highly unlikely. On the bright side, the last Death Cross whipsawed quickly into a Golden Cross that led into the big rally. The picture is a bit different this time given the configuration of the PMO and its crossover SELL signal well-below the zero line. A bounce off support could offer an excellent entry as we are still long-term bullish on Gold.
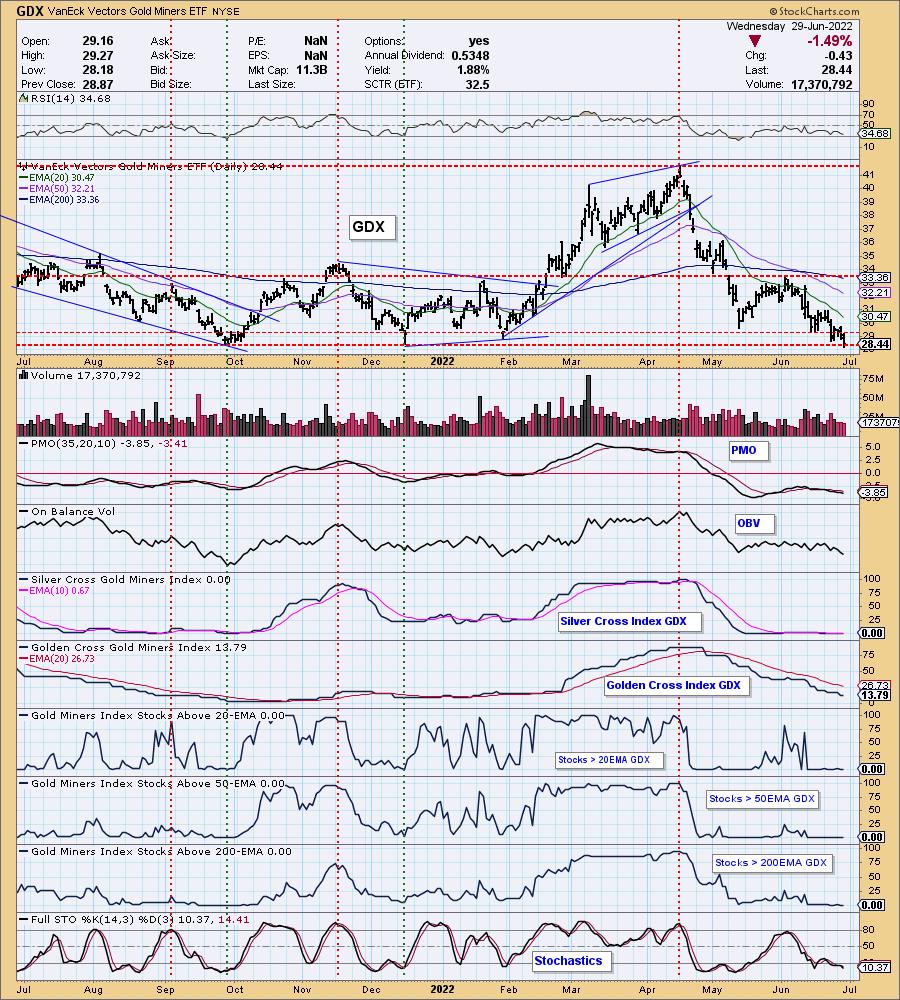
GOLD MINERS Golden and Silver Cross Indexes: Yesterday's comments still apply:
"Gold Miners are testing strong support at $28. This seems an excellent time for a reversal, but the indicators aren't on board. The PMO is still falling on a SELL signal after topping well below the zero line. Participation is almost non-existent with no Miner having a 20-day EMA above the 50-day EMA, nor price above their 50-day EMA. We have a very faint pulse as a few stocks have gotten back above their 20-day EMA, but not nearly enough to get bullish. The short-term declining trend is still intact as well."
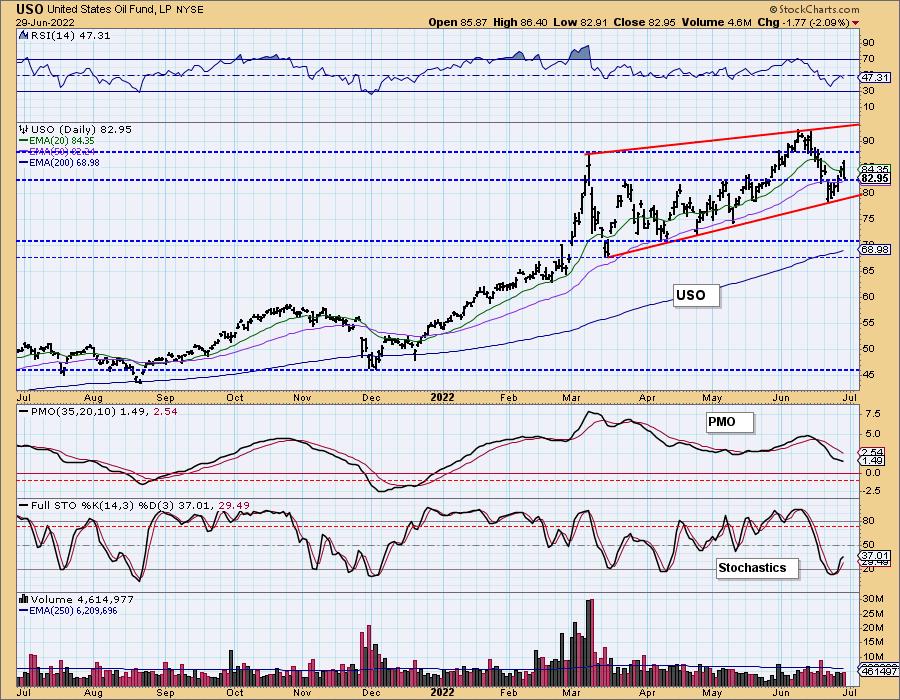
CRUDE OIL (USO)
IT Trend Model: BUY as of 1/3/2022
LT Trend Model: BUY as of 3/9/2021
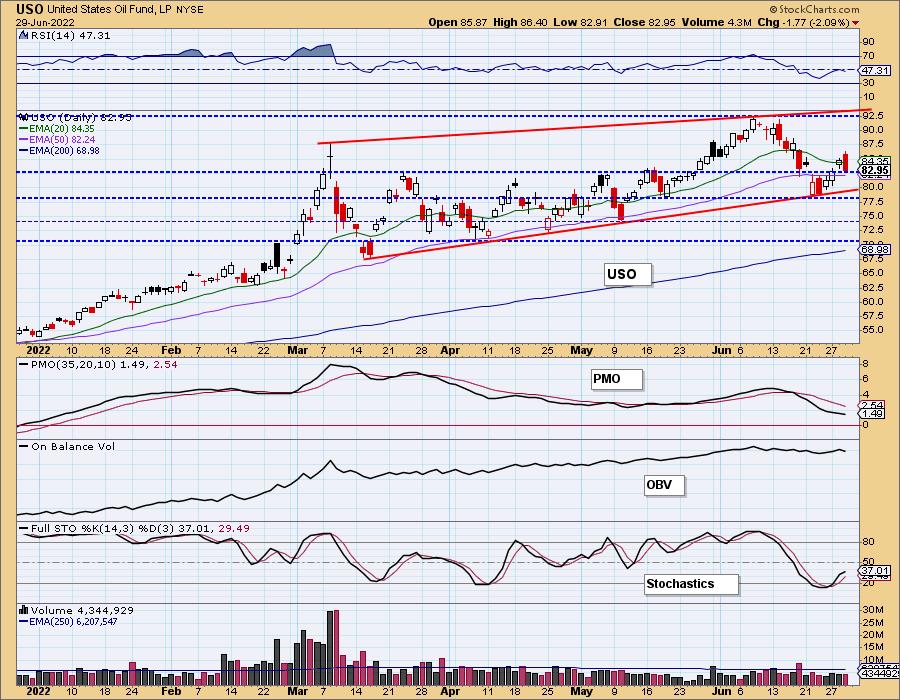
USO Daily Chart: USO formed a giant bearish engulfing candlestick after three days of rally. The RSI turned down in negative territory and the PMO is still falling. Stochastics look bullish, but they are already decelerating in negative territory. Take a look at the industry groups within the Energy sector and you'll see some very ugly charts. While this rebound was encouraging, we don't believe it will last much longer. Watch out if we see a lower high tomorrow.
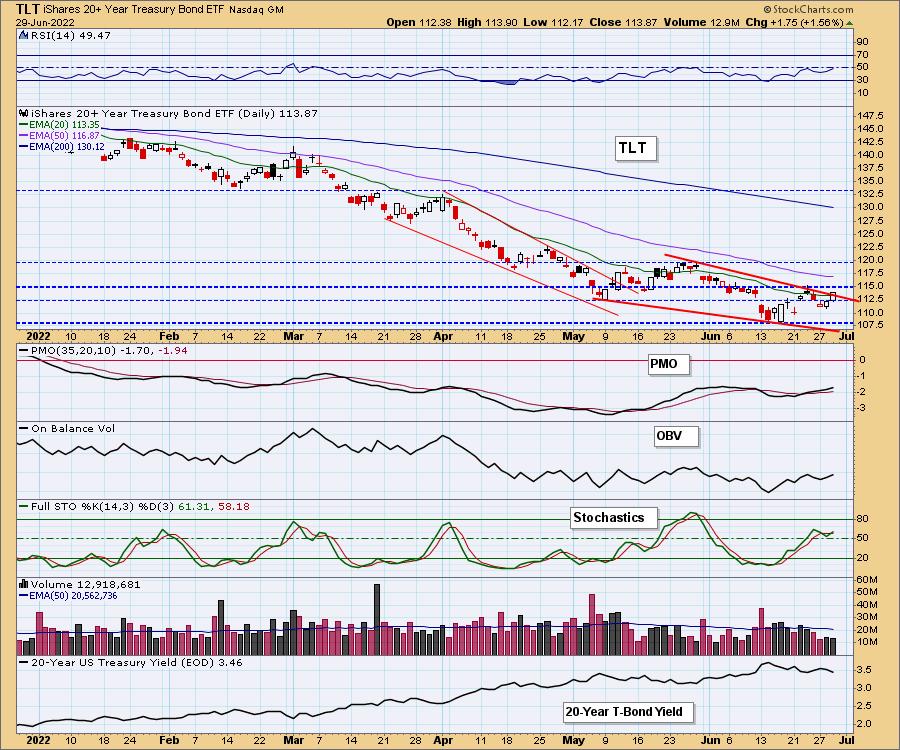
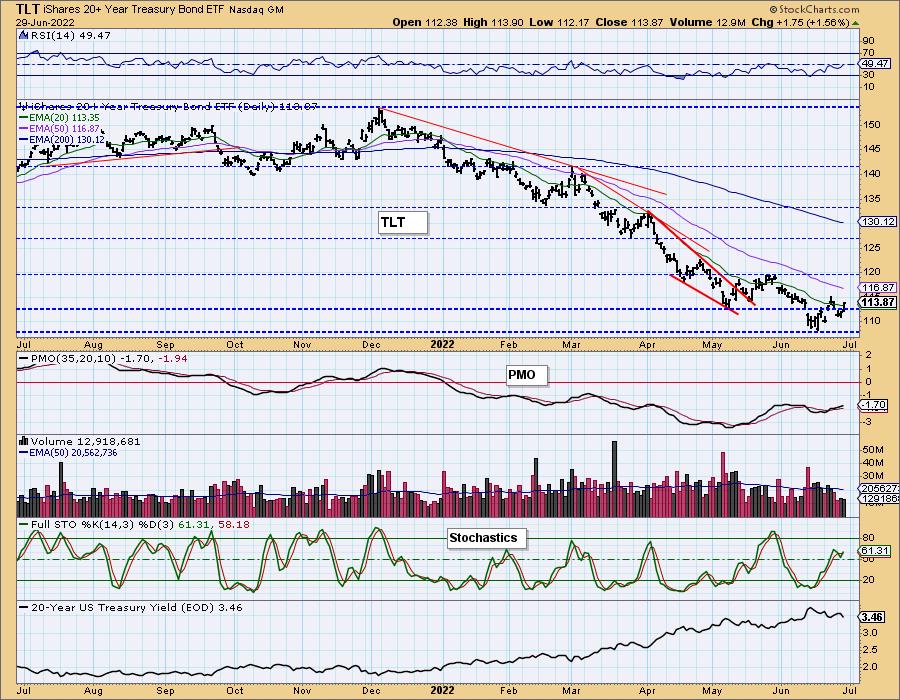
BONDS (TLT)
IT Trend Model: NEUTRALas of 1/5/2022
LT Trend Model: SELL as of 1/19/2022
TLT Daily Chart: With interest rates in a declining trend, TLT has been in a rising trend. Today price broke above both the 20-day EMA and the declining tops trendline. The RSI is nearing positive territory and Stochastics bottomed in positive territory. The PMO continues to slowly march higher. The breakout is beginning to confirm the bullish falling wedge formation. We don't think there is huge upside potential, but Bonds appear to be finding favor again.
Good Luck & Good Trading!
Erin Swenlin and Carl Swenlin
Technical Analysis is a windsock, not a crystal ball. --Carl Swenlin
(c) Copyright 2022 DecisionPoint.com
Disclaimer: This blog is for educational purposes only and should not be construed as financial advice. The ideas and strategies should never be used without first assessing your own personal and financial situation, or without consulting a financial professional. Any opinions expressed herein are solely those of the author, and do not in any way represent the views or opinions of any other person or entity.
NOTE: The signal status reported herein is based upon mechanical trading model signals, specifically, the DecisionPoint Trend Model. They define the implied bias of the price index based upon moving average relationships, but they do not necessarily call for a specific action. They are information flags that should prompt chart review. Further, they do not call for continuous buying or selling during the life of the signal. For example, a BUY signal will probably (but not necessarily) return the best results if action is taken soon after the signal is generated. Additional opportunities for buying may be found as price zigzags higher, but the trader must look for optimum entry points. Conversely, exit points to preserve gains (or minimize losses) may be evident before the model mechanically closes the signal.
Helpful DecisionPoint Links:
DecisionPoint Alert Chart List
DecisionPoint Golden Cross/Silver Cross Index Chart List
DecisionPoint Sector Chart List
Price Momentum Oscillator (PMO)
Swenlin Trading Oscillators (STO-B and STO-V)
DecisionPoint is not a registered investment advisor. Investment and trading decisions are solely your responsibility. DecisionPoint newsletters, blogs or website materials should NOT be interpreted as a recommendation or solicitation to buy or sell any security or to take any specific action.