
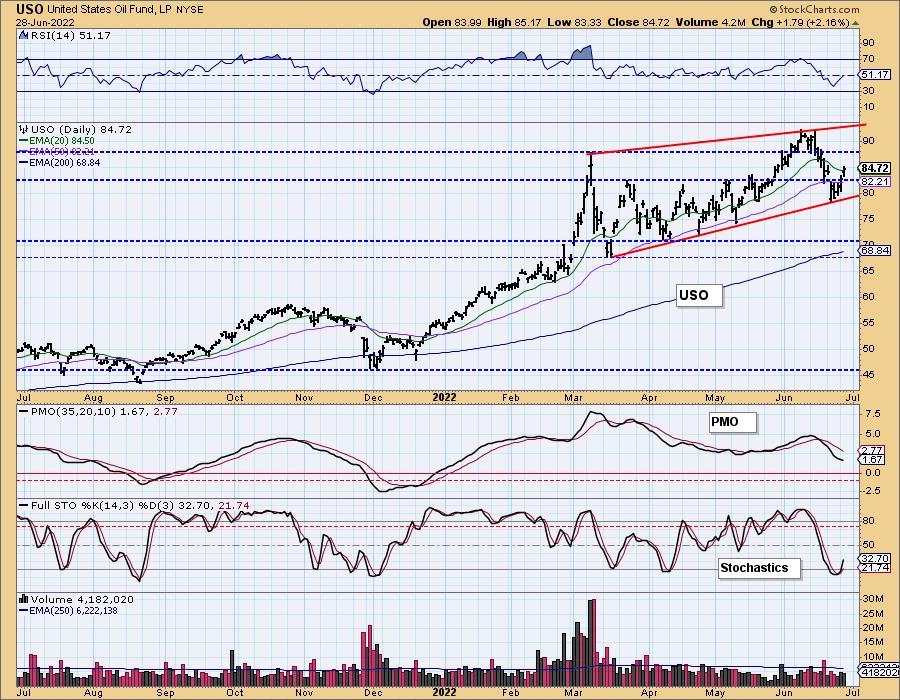
We've had three days of rally for the Energy sector (XLE) primarily due to Crude Oil (USO/$WTIC) rallying strongly after its recent correction. While it is tempting to pile in on this sector, particularly on fossil fuels based companies, we'd be very careful.
Today we were notified of an intermediate-term PMO SELL signal in the works. The chart doesn't "go final" until the close on Friday so this could change before that time, but it is still worrisome. While the rally looks good, coming off the 17-week EMA, this signal could be warning of more downside. Strong support for $WTIC doesn't arrive until price drops over 15%.
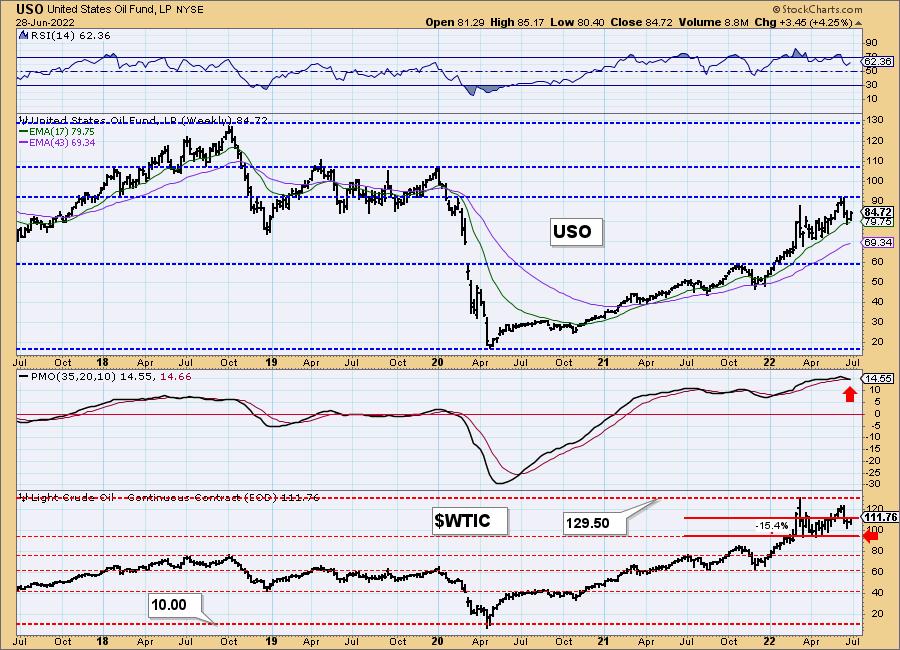
We aren't saying that Crude Oil will crash, we are suggesting you use caution if you're investing in companies that fluctuate profoundly based on the price of Crude.
The DecisionPoint Alert Weekly Wrap presents an end-of-week assessment of the trend and condition of the Stock Market, the U.S. Dollar, Gold, Crude Oil, and Bonds. The DecisionPoint Alert daily report (Monday through Thursday) is abbreviated and gives updates on the Weekly Wrap assessments.
Watch the latest episode of DecisionPoint on StockCharts TV's YouTube channel here!
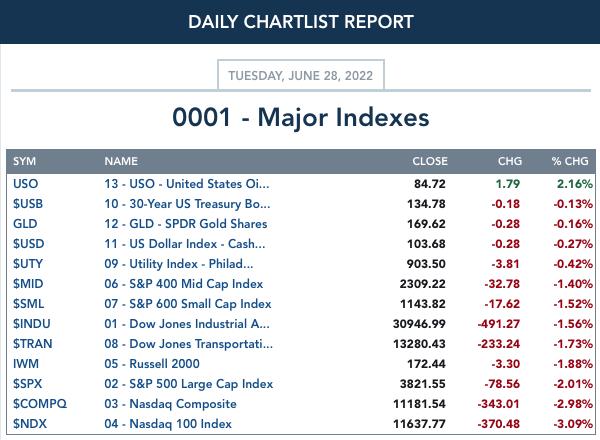
MAJOR MARKET INDEXES
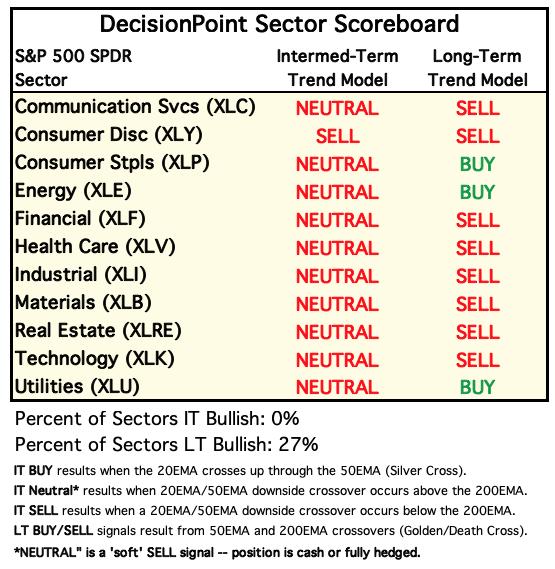
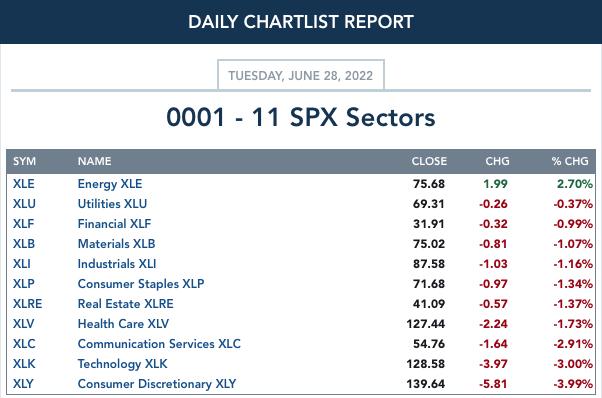
SECTORS
Each S&P 500 Index component stock is assigned to one of 11 major sectors. This is a snapshot of the Intermediate-Term (Silver Cross) and Long-Term (Golden Cross) Trend Model signal status for those sectors.
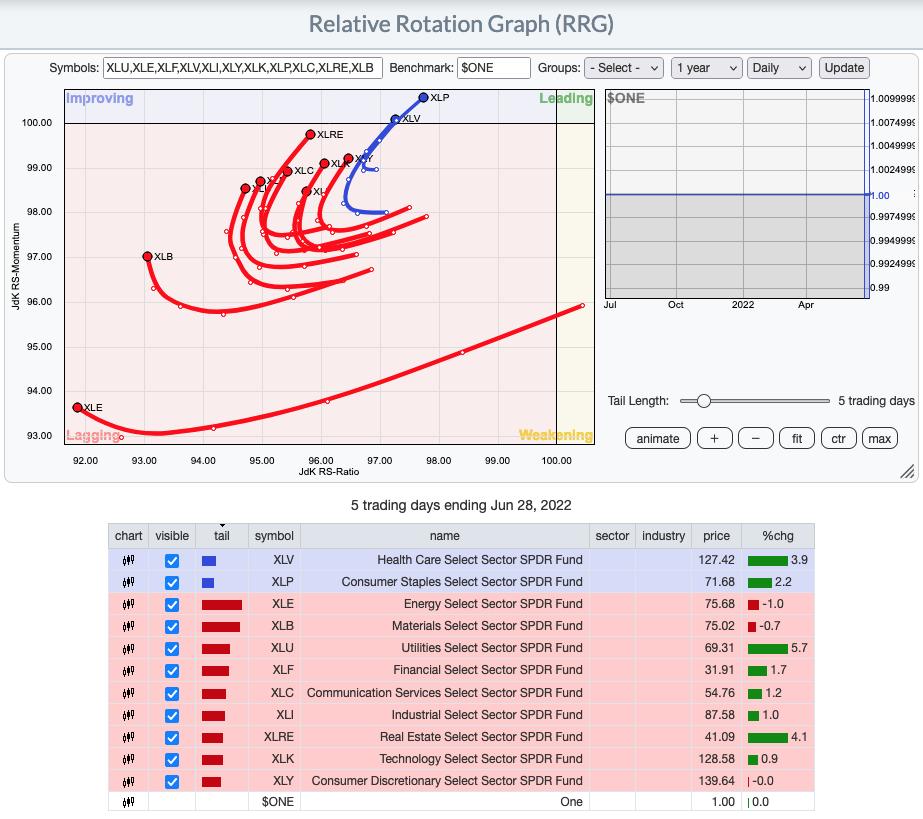
RRG® Chart: We are using $ONE as our benchmark so that the RRGs reflect overall performance rather than relative performance against the SPY.
Daily: All of the sectors now have bullish northeast headings with the exception of Energy and Materials. This tells us that a bear market rally is occurring and could continue further, led by the Consumer Staples, Real Estate and Healthcare sectors.
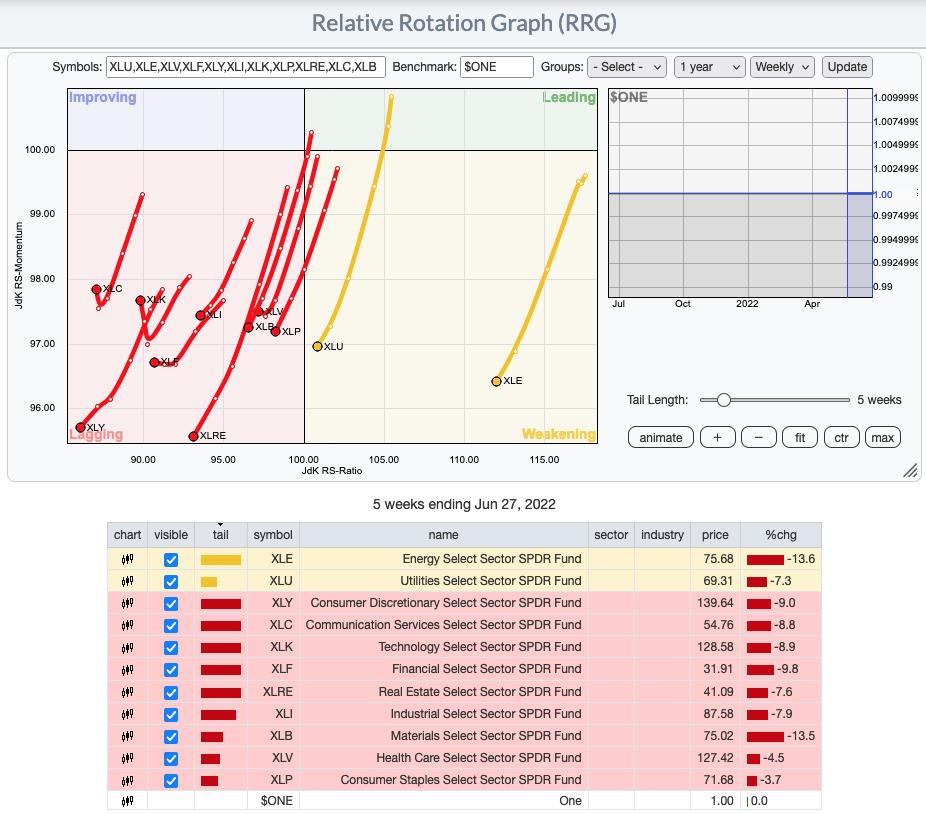
Weekly: The weekly $ONE RRG has looked extraordinarily bearish, but we are starting to see some improvement in the longer term. None of the sectors have bullish northeast headings, but a few are beginning to travel northward toward the Improving quadrant (XLC, XLV and XLF). This RRG makes it clear that we are still in a long-term bear market.
RRG® charts show you the relative strength and momentum for a group of stocks. Stocks with strong relative strength and momentum appear in the green Leading quadrant. As relative momentum fades, they typically move into the yellow Weakening quadrant. If relative strength then fades, they move into the red Lagging quadrant. Finally, when momentum starts to pick up again, they shift into the blue Improving quadrant.
CLICK HERE for an animated version of the RRG chart.
CLICK HERE for Carl's annotated Sector charts.
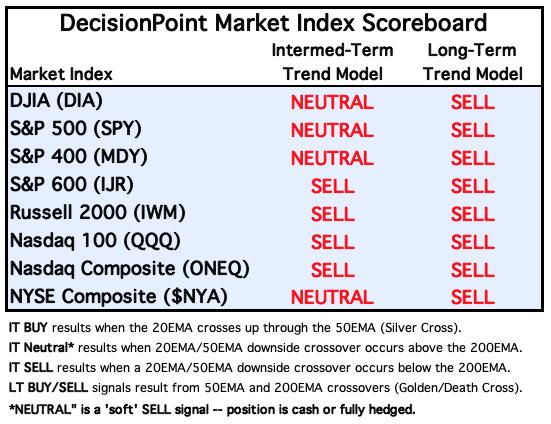
THE MARKET (S&P 500)
IT Trend Model: NEUTRAL as of 1/21/2022
LT Trend Model: SELL as of 5/5/2022
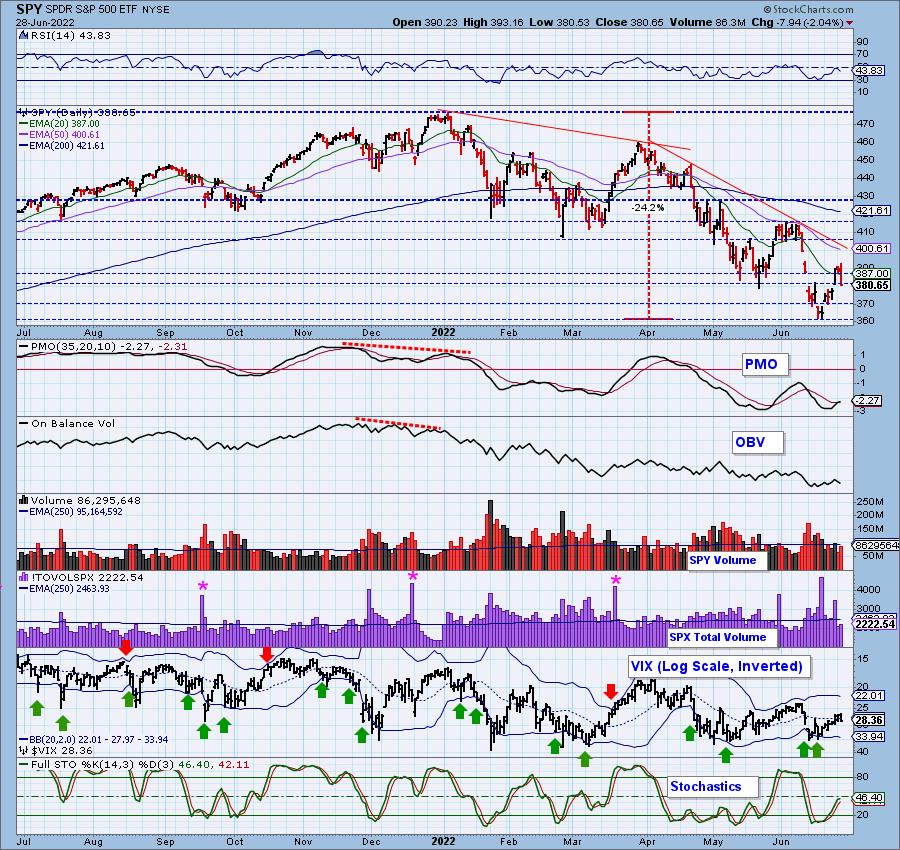
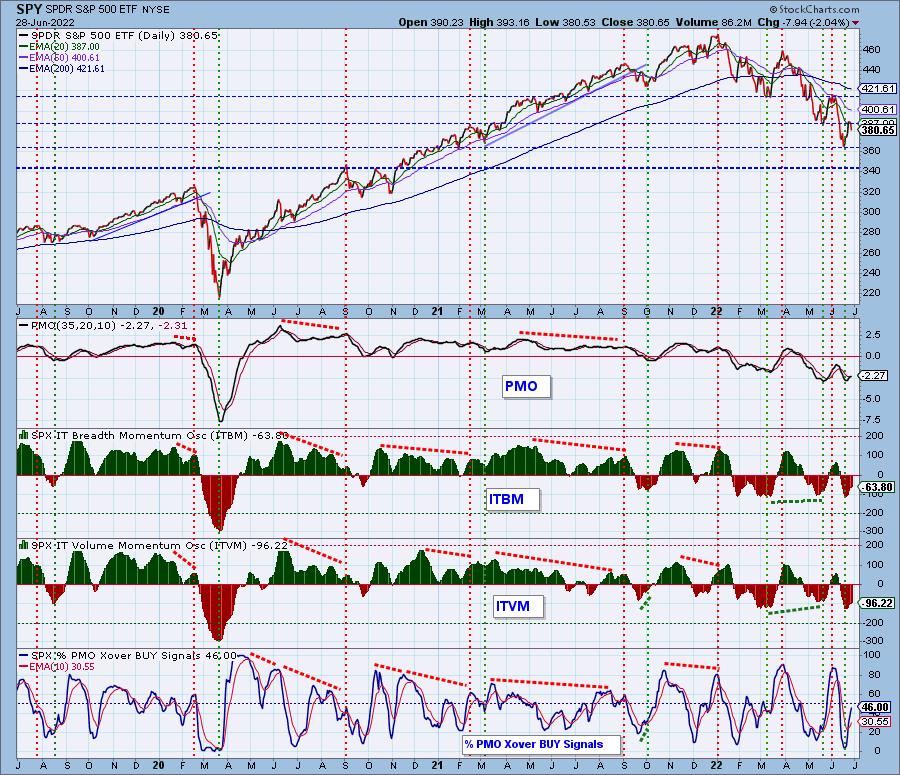
SPY Daily Chart: The market pulled back painfully today with an over 2% drop; however, support did hold at the May low. The PMO BUY signal survived, but the RSI is falling in negative territory.
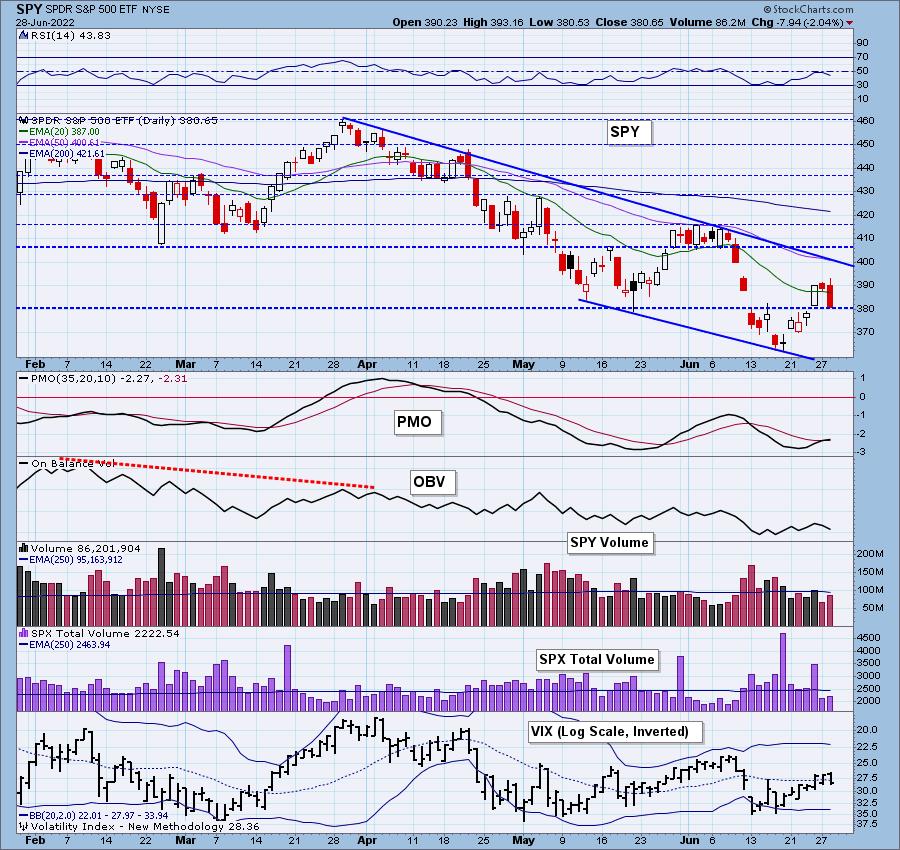
Stochastics paused but didn't turn over. The VIX is back beneath its moving average on our inverted scale, but the rising trend is still intact.

Here is the latest recording:
Topic: DecisionPoint Trading Room
Start Time: Jun 27, 2022 09:00 AM
Meeting Recording Link
Access Passcode: June#27th
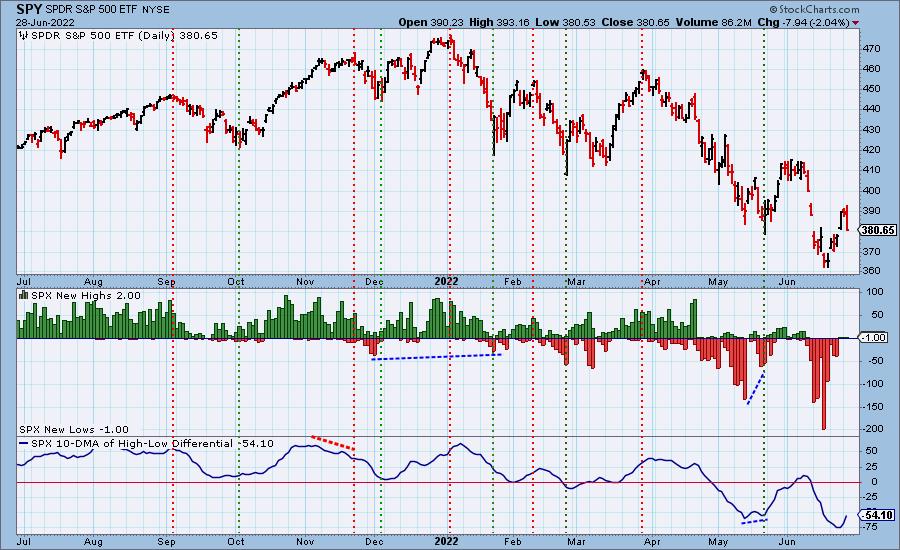
S&P 500 New 52-Week Highs/Lows: The 10-DMA of the High-Low Differential has turned back up in very oversold territory and is now rising strongly. This usually bodes well for the market.
Climax* Analysis: Climax readings across the board today, but they were relatively weak; however, SPX Total Volume isn't confirming this downside initiation climax. That really doesn't minimize the climax, though. Price can fall out of the sky without a lot of volume.
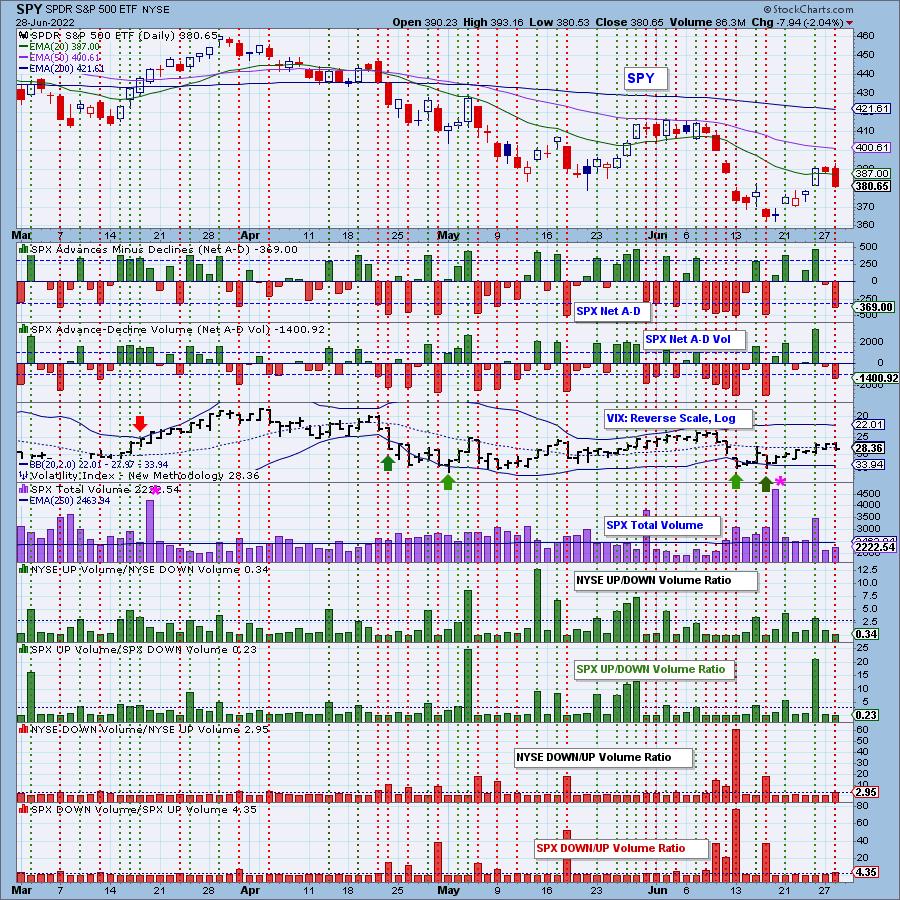
*A climax is a one-day event when market action generates very high readings in, primarily, breadth and volume indicators. We also include the VIX, watching for it to penetrate outside the Bollinger Band envelope. The vertical dotted lines mark climax days -- red for downside climaxes, and green for upside. Climaxes are at their core exhaustion events; however, at price pivots they may be initiating a change of trend.
Short-Term Market Indicators: The short-term market trend is UP and the condition is OVERBOUGHT.
All the short-term indicators have topped. Being short-term in their nature, we may not be stuck with a negative outcome, since they could start rising again. Nevertheless, we're stuck with the potential for a continued decline at the moment.
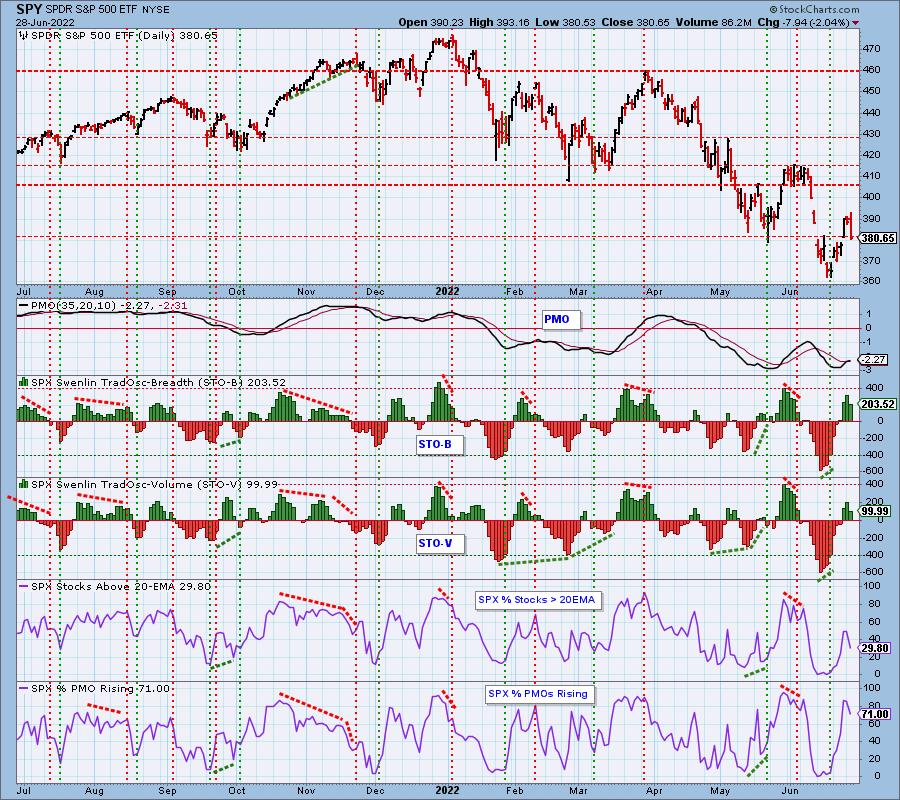
Intermediate-Term Market Indicators: The intermediate-term market trend is DOWN and the condition is NEUTRAL.
None of the IT indicators turned down today, but they're not meant to be that twitchy. If market action does turn them down, that wouldn't be good. The amount of PMO BUY signals expanded today despite the decline.
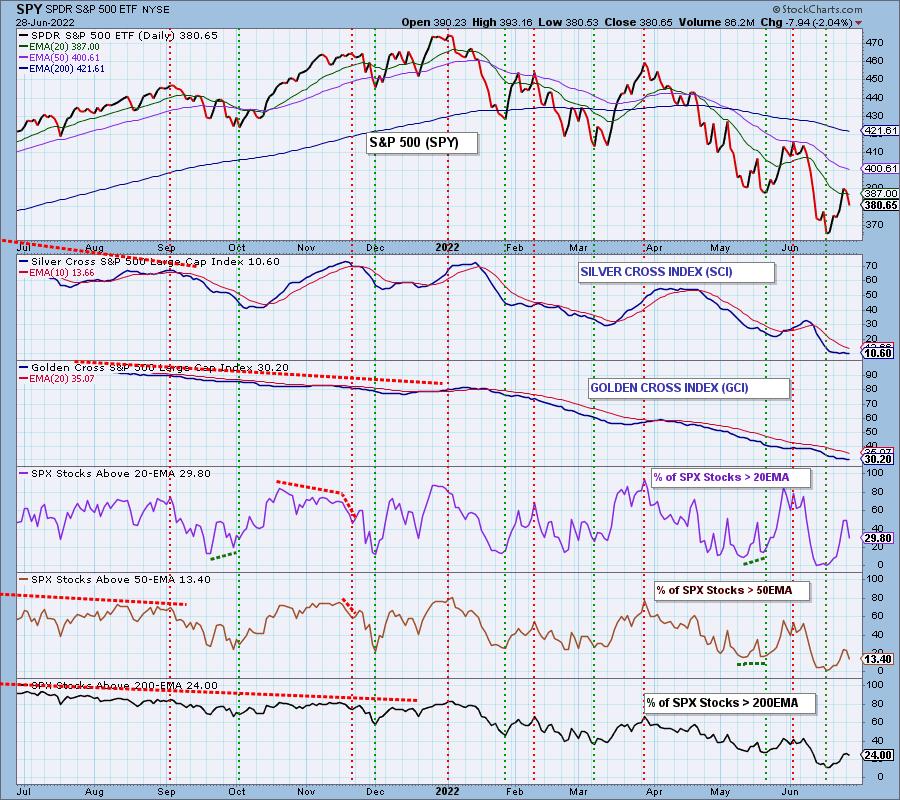
PARTICIPATION and BIAS Assessment: The following chart objectively shows the depth and trend of participation in two time frames.
- Intermediate-Term - the Silver Cross Index (SCI) shows the percentage of SPX stocks on IT Trend Model BUY signals (20-EMA > 50-EMA). The opposite of the Silver Cross is a "Dark Cross" -- those stocks are, at the very least, in a correction.
- Long-Term - the Golden Cross Index (GCI) shows the percentage of SPX stocks on LT Trend Model BUY signals (50-EMA > 200-EMA). The opposite of a Golden Cross is the "Death Cross" -- those stocks are in a bear market.
The short-term bullish bias is disintegrating. %Stocks > 20/50-day EMAs shrunk quickly on a down day but since percentages of stocks above 20/50-day EMAs is larger than the SCI, we will leave the short-term bias as bullish.
The intermediate-term bias is still bearish. The SCI is flat and has a bearish reading of only 10%.
The long-term bias is bearish as the GCI is at a low 31% with %Stocks > 20/50-day EMAs being lower than the GCI reading.
The long-term bias is bearish given the small percentage of stocks with golden crosses (50-day EMA > 200-day EMA) and a smaller percentage of stocks with price above their 200-day EMA than the GCI reading.
CONCLUSION: It was a day of mixed messages: The market stumbled, but held support. The PMO is on a BUY signal, but we have a downside initiation climax. IT indicators are rising, but STOs have topped. What's an analyst to do? Here is our take... The market is still primed to rally, a look at the daily RRG tells us that. However, the topping STOs and downside initiation climax are weighing heavy. Expanding exposure should be done carefully and all positions should have stops set in case the bottom drops out.
Erin is 15% exposed to the market contemplating expansion to 25%.
Have you subscribed the DecisionPoint Diamonds yet? DP does the work for you by providing handpicked stocks/ETFs from exclusive DP scans! Add it with a discount! Contact support@decisionpoint.com for more information!
BITCOIN
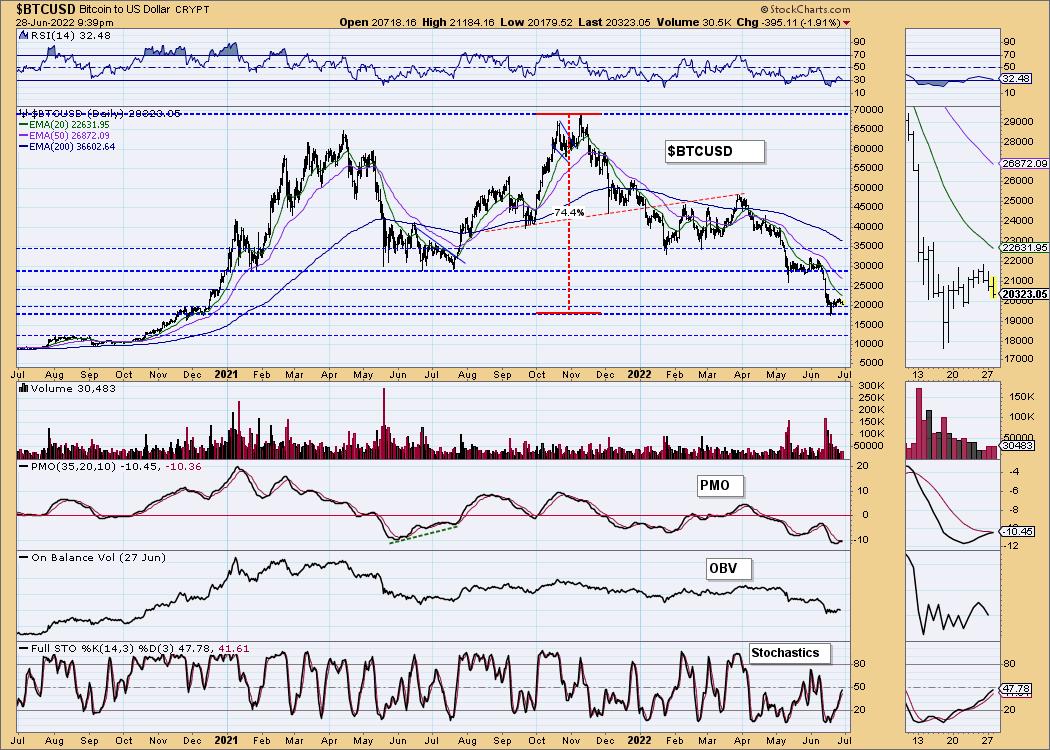
Yesterday's comments still apply:
"Bitcoin is clinging to support at $20,000. The indicators are firming up with a rising PMO nearing a crossover BUY signal and Stochastics rising out of oversold territory, but it hasn't resulted in much upside. It took Bitcoin over a month of consolidation above support at $28,000 before it broke down. We expect more sideways price action with a high likelihood of a breakdown coming soon."
INTEREST RATES
Yields are rising again putting the pressure back on Bonds. Long-term rates haven't quite broken their declining trends out of the recent top, so today's decline could mean rates are topping again.
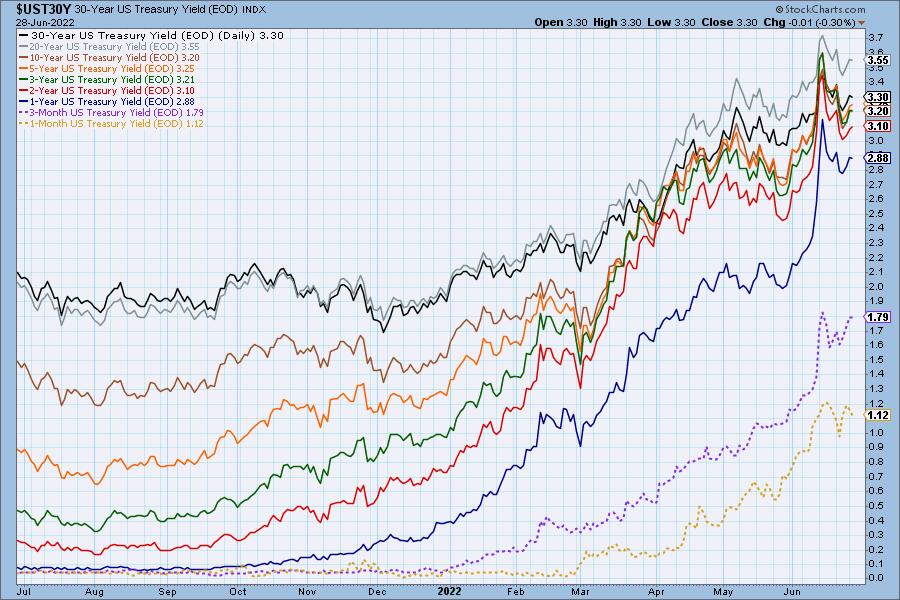
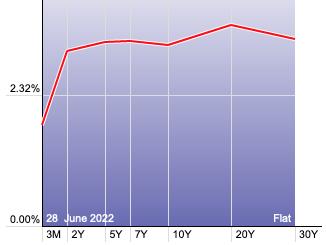
The Yield Curve Chart from StockCharts.com shows us the inversions taking place. The red line should move higher from left to right. Inversions are occurring where it moves downward.
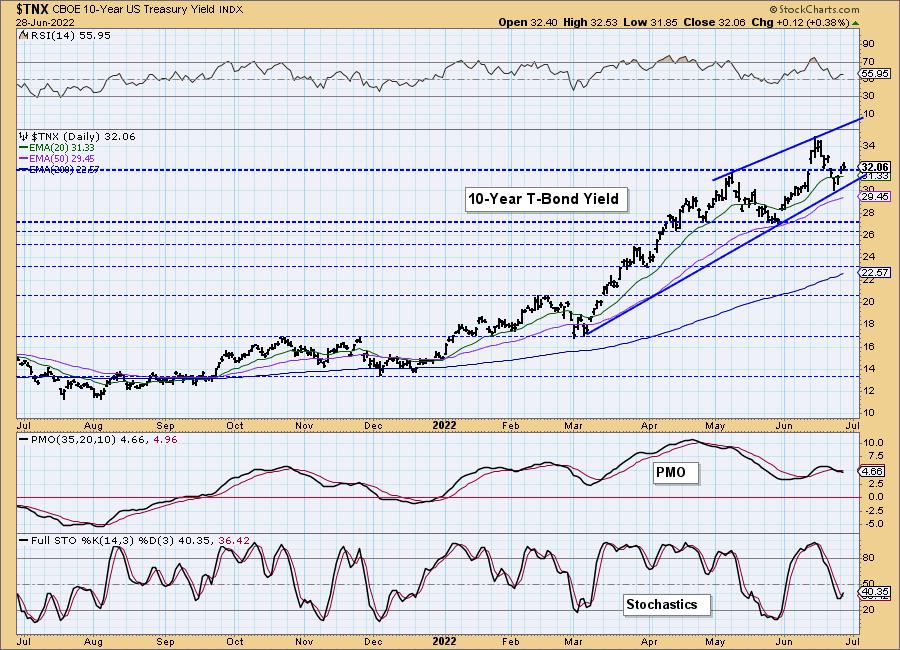
10-YEAR T-BOND YIELD
$TNX opted to rebound off the bottom of the bearish rising wedge pattern. Today $TNX moved above resistance at the May top. The RSI rebounded in positive territory which is very bullish. The PMO is on a SELL signal, but is already flattening out in preparation for a whipsaw BUY signal. Stochastics also paused their decline. We believe there is a good chance that $TNX will test the top of this wedge pattern again. If $TNX tops out before hitting the upper bound of the wedge, that would imply a breakdown ahead. For now, it looks like it is on its way back up.
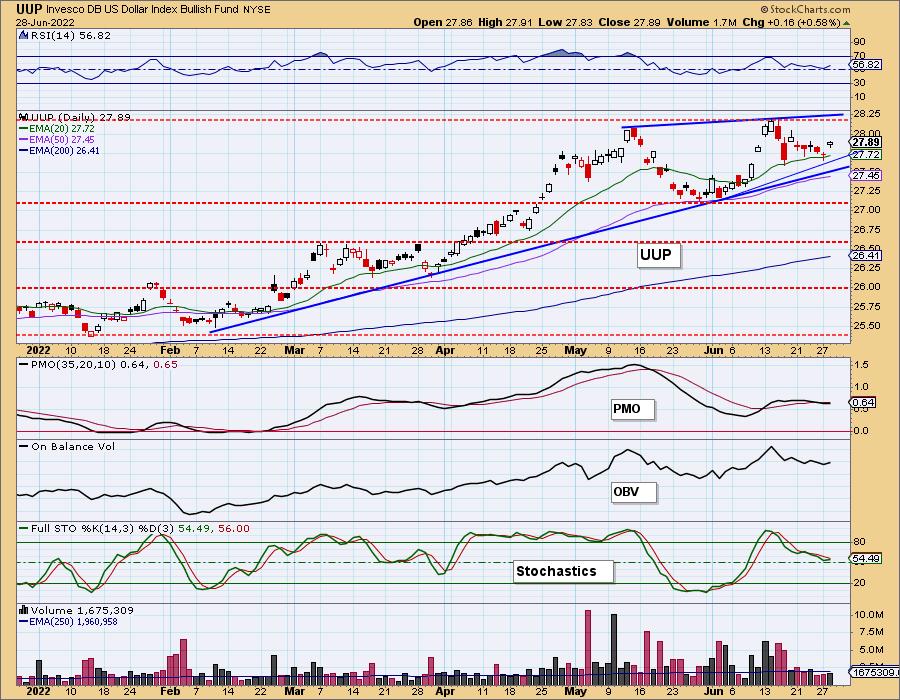
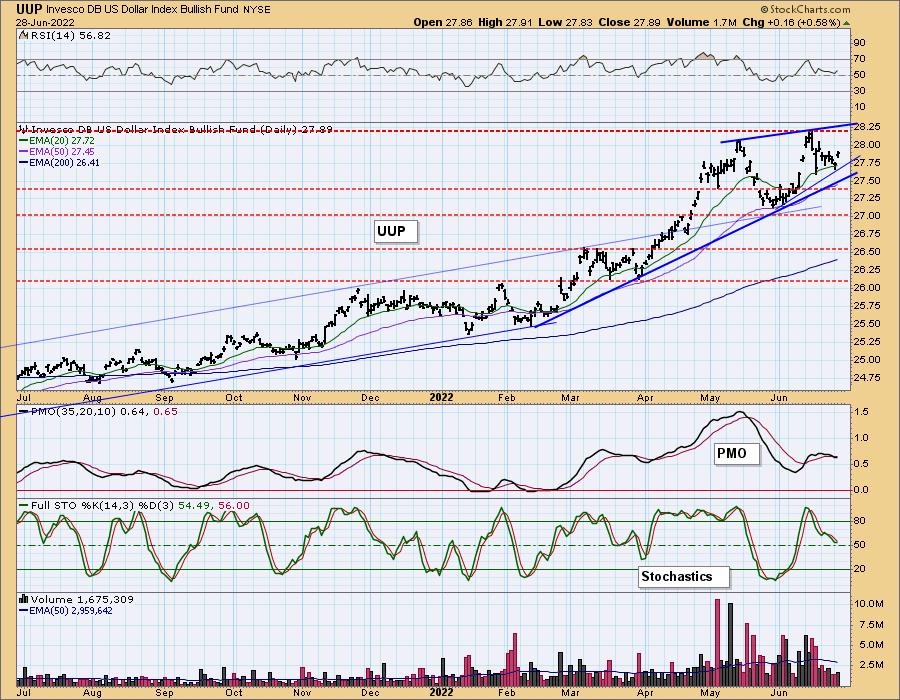
DOLLAR (UUP)
IT Trend Model: BUY as of 6/22/2021
LT Trend Model: BUY as of 8/19/2021
UUP Daily Chart: Ha! Just after writing that we are scrapping the bullish cup with handle pattern, it finally executes. The pattern implies a breakout above resistance. The RSI remains in positive territory, but the PMO is still on a SELL signal. Even Stochastics turned up above net neutral (50). We now must wait to see if price is turned away at the overriding bearish rising wedge pattern in the intermediate term.
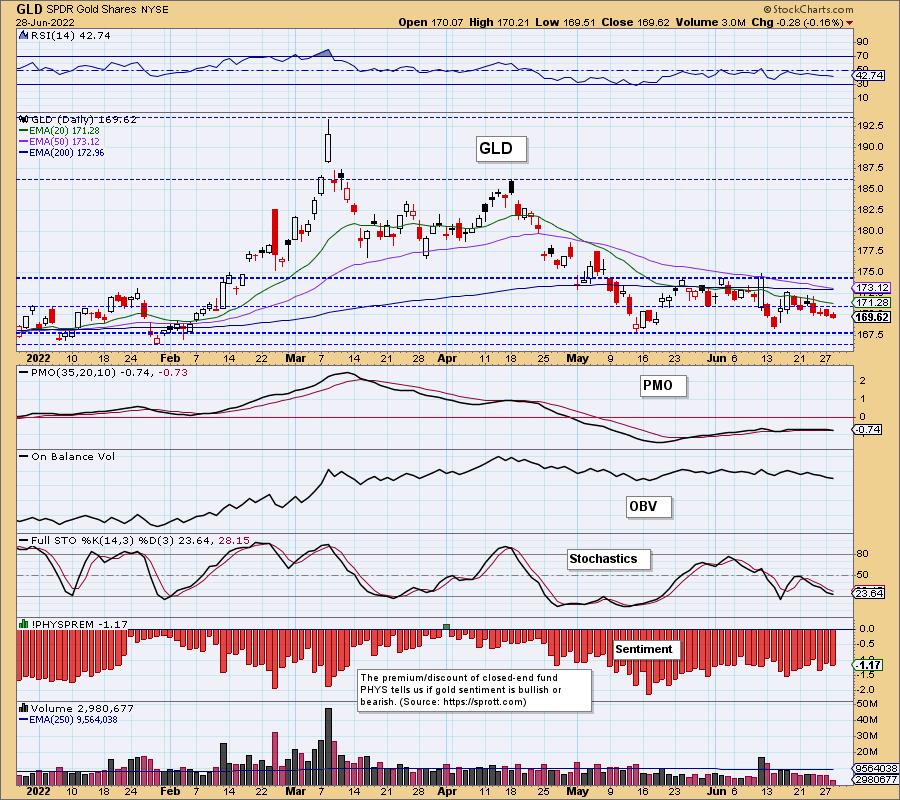
GOLD
IT Trend Model: NEUTRAL as of 5/3/2022
LT Trend Model: BUY as of 1/12/2022
GLD Daily Chart: Gold continues to languish within its trading range. A test of support at the May/June lows seems imminent given the lackluster indicators and new PMO SELL signal well below the zero line today.
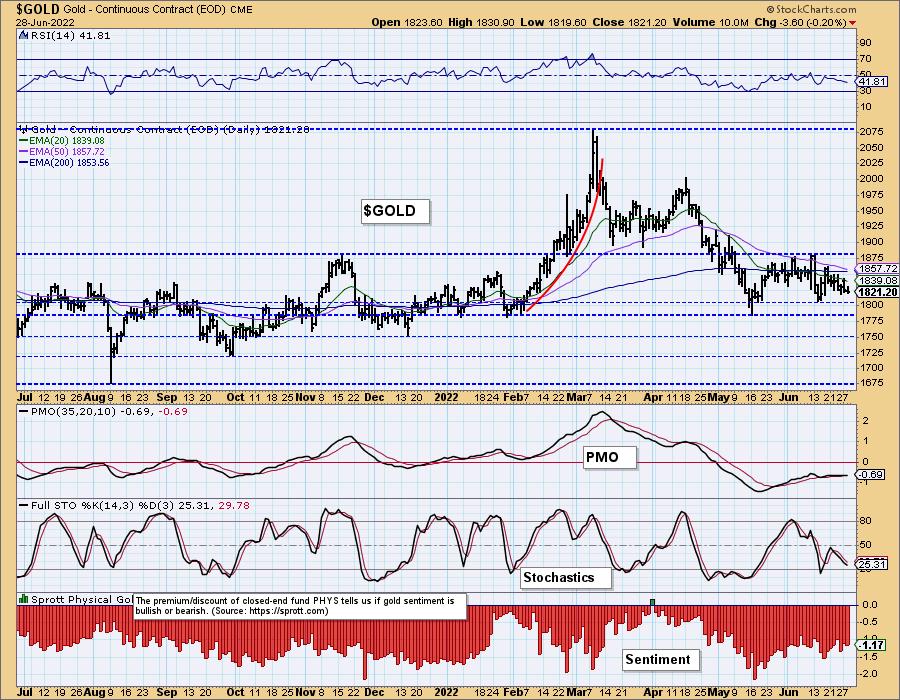
GOLD Daily Chart: A "Death Cross" of the 50/200-day EMAs is on tap if price doesn't get back above the 200-day EMA. It seems highly unlikely that it would be able to rally that far that fast. We will likely see that death cross soon.
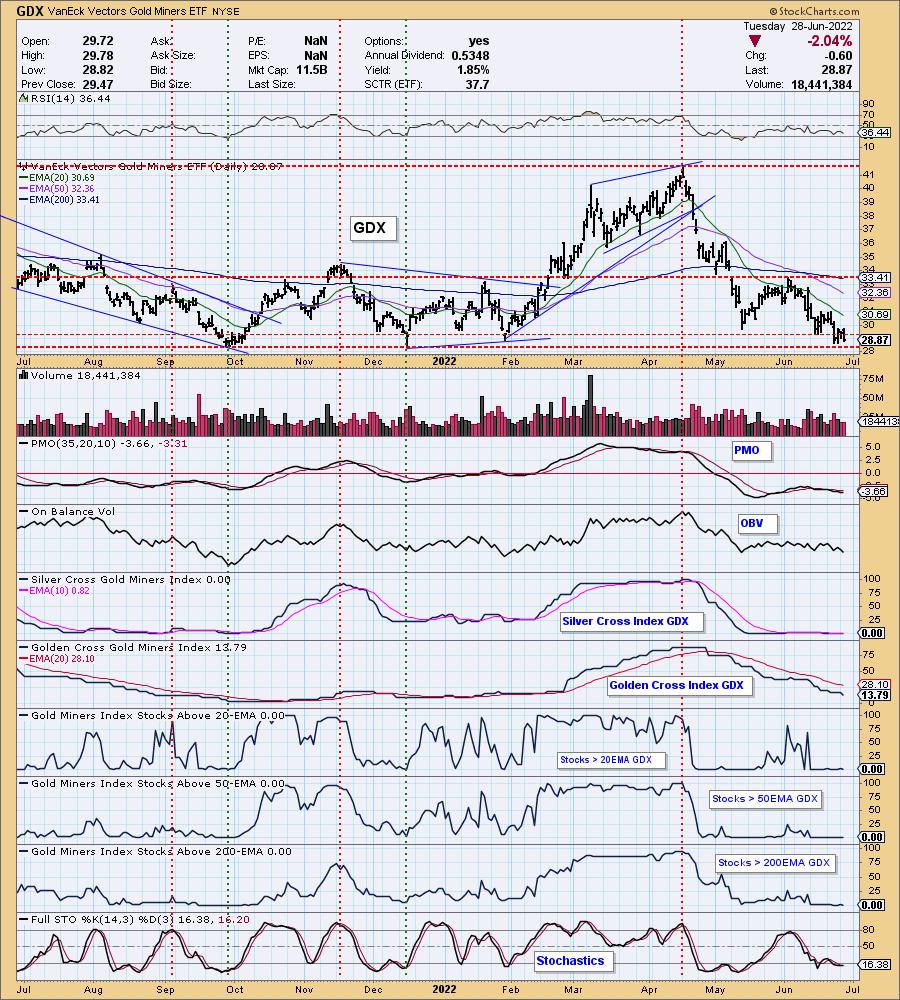
GOLD MINERS Golden and Silver Cross Indexes: Yesterday's comments still apply:
"Gold Miners are testing strong support at $28. This seems an excellent time for a reversal, but the indicators aren't on board. The PMO is still falling on a SELL signal after topping well below the zero line. Participation is almost non-existent with no Miner having a 20-day EMA above the 50-day EMA, nor price above their 50-day EMA. We have a very faint pulse as a few stocks have gotten back above their 20-day EMA, but not nearly enough to get bullish. The short-term declining trend is still intact as well."
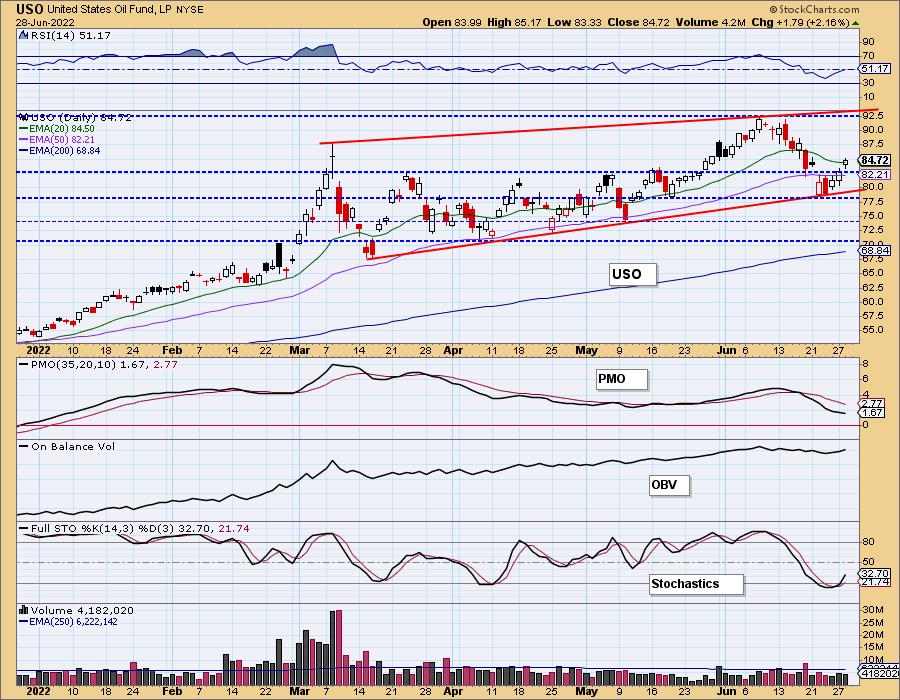
CRUDE OIL (USO)
IT Trend Model: BUY as of 1/3/2022
LT Trend Model: BUY as of 3/9/2021
USO Daily Chart: Crude Oil closed above the 20-day EMA, breaking back above overhead resistance at second quarter highs. The PMO is still falling, but the RSI is now back in positive territory with Stochastics rising out of oversold territory. The chart looks encouraging, but we do see a large rising wedge and in the opening we warned of an intermediate-term PMO SELL signal on the horizon.
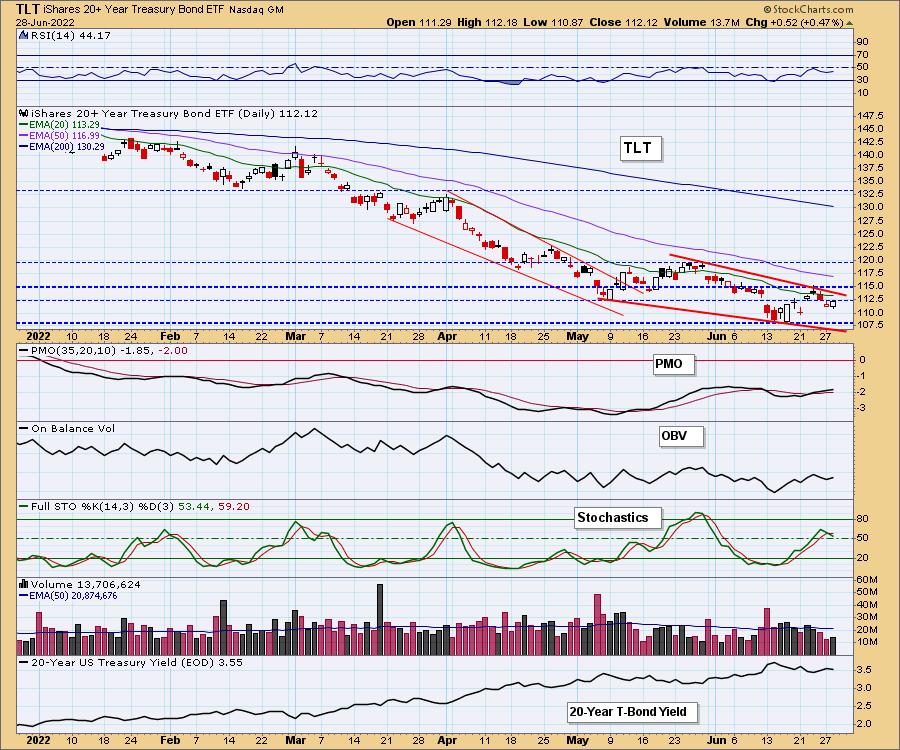
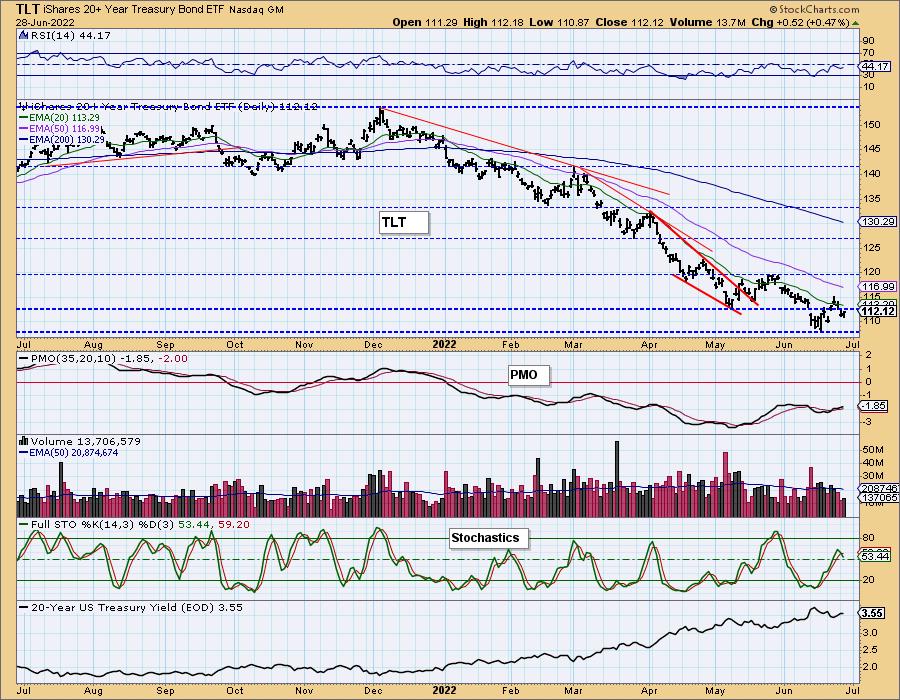
BONDS (TLT)
IT Trend Model: NEUTRALas of 1/5/2022
LT Trend Model: SELL as of 1/19/2022
TLT Daily Chart: Nothing too new to report here. TLT did finish higher on the day and the PMO is rising, but the negative RSI and topping Stochastics tell us not to look for a breakout yet. We do see a bullish falling wedge, but note the result of the last wedge from April/May.
Good Luck & Good Trading!
Erin Swenlin and Carl Swenlin
Technical Analysis is a windsock, not a crystal ball. --Carl Swenlin
(c) Copyright 2022 DecisionPoint.com
Disclaimer: This blog is for educational purposes only and should not be construed as financial advice. The ideas and strategies should never be used without first assessing your own personal and financial situation, or without consulting a financial professional. Any opinions expressed herein are solely those of the author, and do not in any way represent the views or opinions of any other person or entity.
NOTE: The signal status reported herein is based upon mechanical trading model signals, specifically, the DecisionPoint Trend Model. They define the implied bias of the price index based upon moving average relationships, but they do not necessarily call for a specific action. They are information flags that should prompt chart review. Further, they do not call for continuous buying or selling during the life of the signal. For example, a BUY signal will probably (but not necessarily) return the best results if action is taken soon after the signal is generated. Additional opportunities for buying may be found as price zigzags higher, but the trader must look for optimum entry points. Conversely, exit points to preserve gains (or minimize losses) may be evident before the model mechanically closes the signal.
Helpful DecisionPoint Links:
DecisionPoint Alert Chart List
DecisionPoint Golden Cross/Silver Cross Index Chart List
DecisionPoint Sector Chart List
Price Momentum Oscillator (PMO)
Swenlin Trading Oscillators (STO-B and STO-V)
DecisionPoint is not a registered investment advisor. Investment and trading decisions are solely your responsibility. DecisionPoint newsletters, blogs or website materials should NOT be interpreted as a recommendation or solicitation to buy or sell any security or to take any specific action.