
I haven't reviewed the Rydex Ratio chart in some time, mainly because what used to be considered overbought territory became the "new" oversold territory and I wanted to see how it behaved moving forward.
A quick refresher on what the Rydex Ratio tracks. We compare the total assets in money market and bear funds to the total assets in the bull and sector funds. These numbers are gathered in the evening after the market close (hence the 9/3 readings being the most current). The smaller this ratio becomes, the more bullish the sentiment reading. Sentiment is a "contrarian" indicator; the more bullish the sentiment, the more bearish the outlook becomes for price. The idea is that, when everyone is bullish, that is when you will see the downside reversal.
Check out the chart below!
Build Wealth & Generate Income - Download the FREE eBook!
That's a bold claim - right?
Well, take a look at this and support my endeavors by downloading this eBook where I and my peers do just that!

Listen To These 11 Women
These 11 women have more than 221 years combined experience in trading...
Which is why you should pay close attention to what they have to say.

If you ever wondered how to build wealth and generate income with less risk...
Or if there were simple tools that traders use to find profitable "big move trades" without risking all their capital...
My video chapter on Using Momentum and Relative Strength to Find the Best Trades shares how this smart woman is beating the markets.
Plus, you'll discover how to use moving averages to enhance your investing potential (you won't believe how simple this is)!
And how to profit with macro-to-micro trading using the best trend-trading indicator (that you have probably never heard of)!
But that's not all... there's so much more... support me...
>>> Click Here for Your Free eBook and see what these 11 women have to say!
You can see that it danced around previously overbought territory from November 2020 through the first part of 2021. However, we are now starting to see oscillation in its new post-bear market range.
Note the dotted vertical lines align with "cardinal" tops. I have also annotated a vertical line at our last all-time high for the SPX. A Rydex Ratio in overbought territory generally accompanies market tops. Currently, we are seeing one of the lowest readings on record for the Rydex Ratio. This means that participants who are "voting with their money" are extremely bullish.
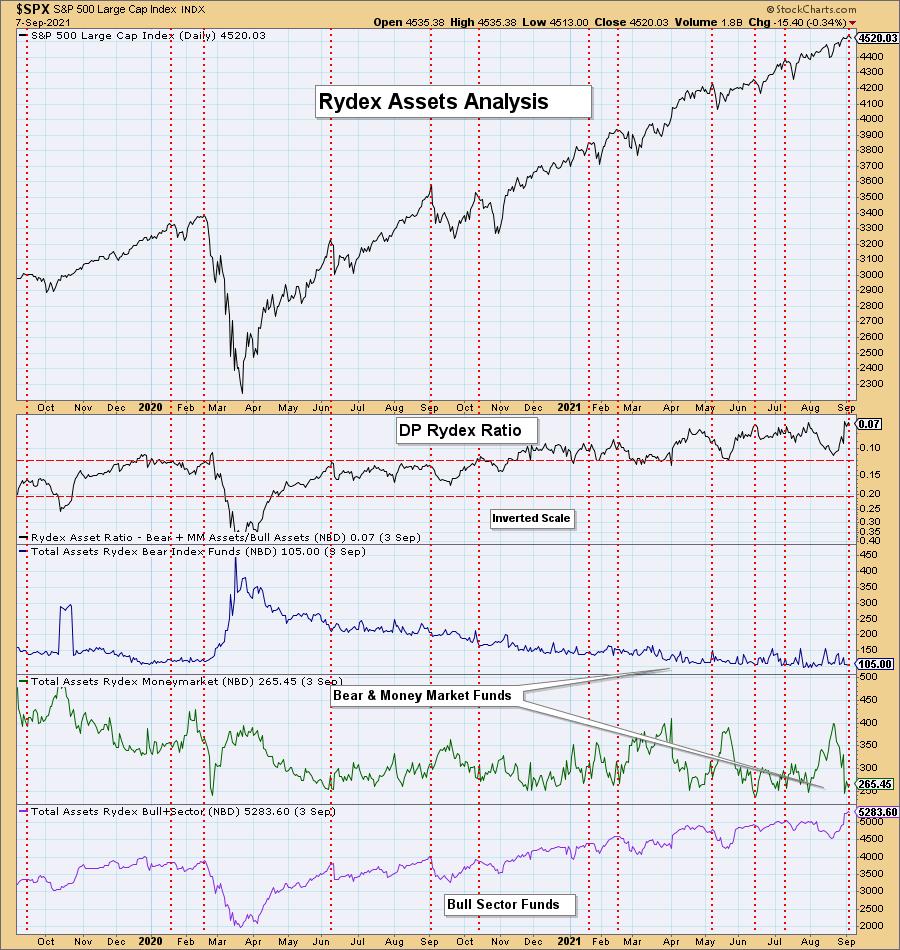
Conclusion: Sentiment based on the Rydex Ratio is extraordinarily bullish given the historically low reading. Given sentiment is contrarian, there is now a bearish price bias based on "real money" trading.
Technical Analysis is a windsock, not a crystal ball.
-- Erin Swenlin
(c) Copyright 2021 DecisionPoint.com
Helpful DecisionPoint Links:
DecisionPoint Alert Chart List
DecisionPoint Golden Cross/Silver Cross Index Chart List
DecisionPoint Sector Chart List
Price Momentum Oscillator (PMO)
Swenlin Trading Oscillators (STO-B and STO-V)
DecisionPoint is not a registered investment advisor. Investment and trading decisions are solely your responsibility. DecisionPoint newsletters, blogs or website materials should NOT be interpreted as a recommendation or solicitation to buy or sell any security or to take any specific action.