
I haven't reviewed the Rydex Ratio chart in some time. Mainly because what used to be considered overbought territory became the 'new' oversold territory and I wanted to see how it behaved moving forward. You can see that it danced around previously overbought territory from November 2020 through the first part of 2021. However, now we are starting to see oscillation in its new post-bear market range.
A quick refresher on what the Rydex Ratio tracks. We compare the total assets in money market and bear funds to the total assets in the bull and sector funds. These numbers are gathered in the evening after the market close (hence the 9/3 readings being the most current). The smaller this ratio becomes, the more bullish the sentiment reading. Clearly sentiment is highly bullish. Sentiment is a "contrarian" indicator. The more bullish the sentiment, the more bearish the outlook becomes for price. The idea is that when everyone is bullish, that is when you will see the downside reversal.
Note the dotted vertical lines align with "cardinal" tops. I have also annotated a vertical line at our last all-time high for the SPX. A Rydex Ratio in overbought territory generally accompanies market tops. Currently we are seeing one of the lowest readings on record for the Rydex Ratio. This means that participants who are "voting with their money" are extremely bullish.
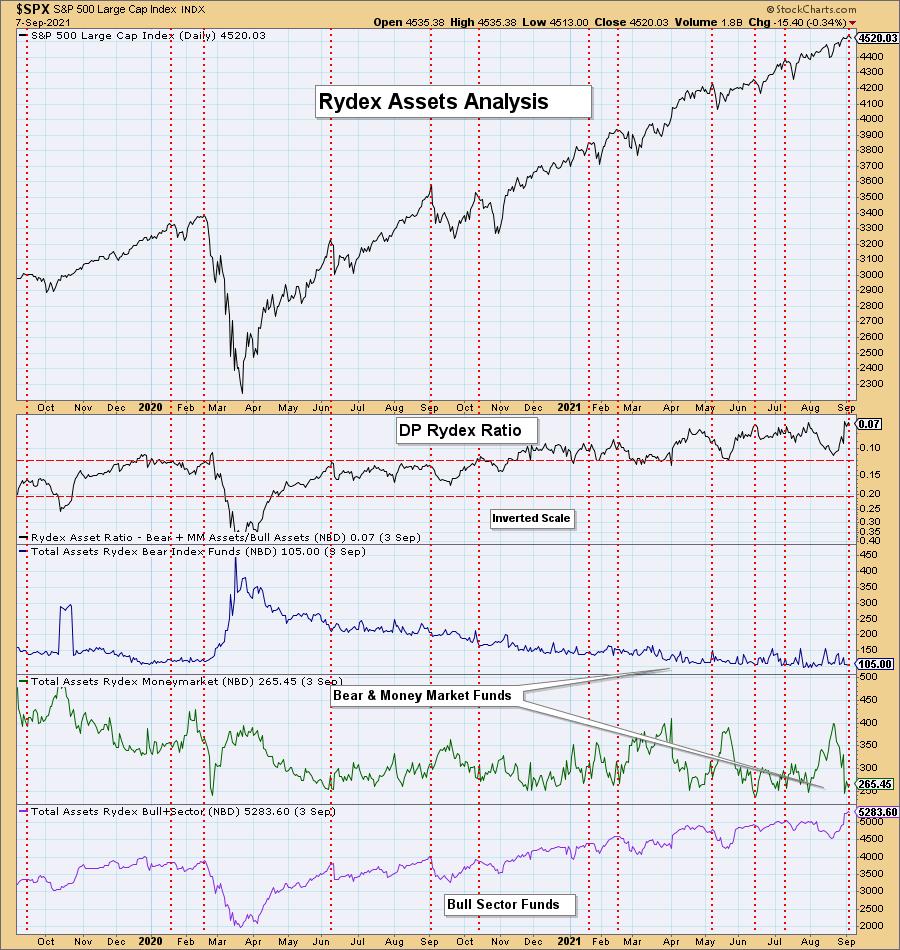
Conclusion: Sentiment based on the Rydex Ratio is extraordinarily bullish given the historically low reading. Given sentiment is contrarian, there is now a bearish price bias based on 'real money' trading.
The DecisionPoint Alert Weekly Wrap presents an end-of-week assessment of the trend and condition of the Stock Market, the U.S. Dollar, Gold, Crude Oil, and Bonds. The DecisionPoint Alert daily report (Monday through Thursday) is abbreviated and gives updates on the Weekly Wrap assessments.
Watch the latest episode of DecisionPoint on StockCharts TV's YouTube channel here!
MAJOR MARKET INDEXES
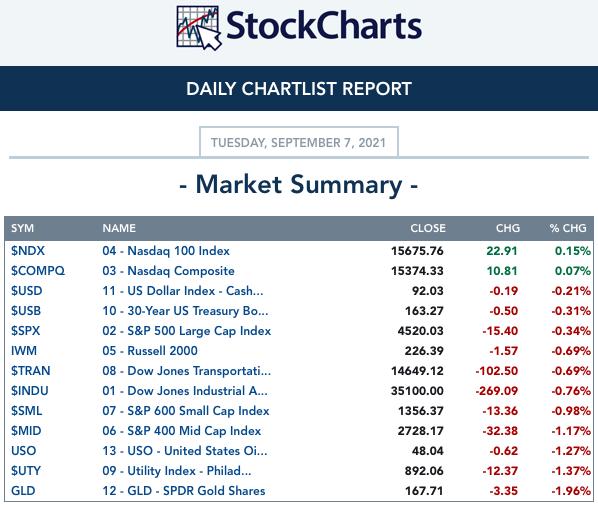
SECTORS
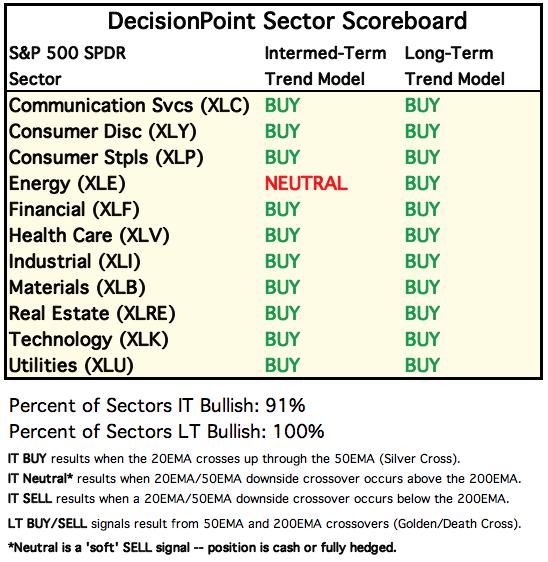
Each S&P 500 Index component stock is assigned to one, and only one, of 11 major sectors. This is a snapshot of the Intermediate-Term (Silver Cross) and Long-Term (Golden Cross) Trend Model signal status for those sectors.
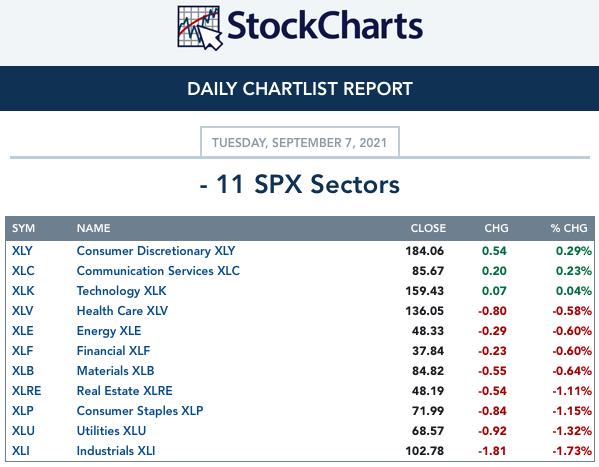
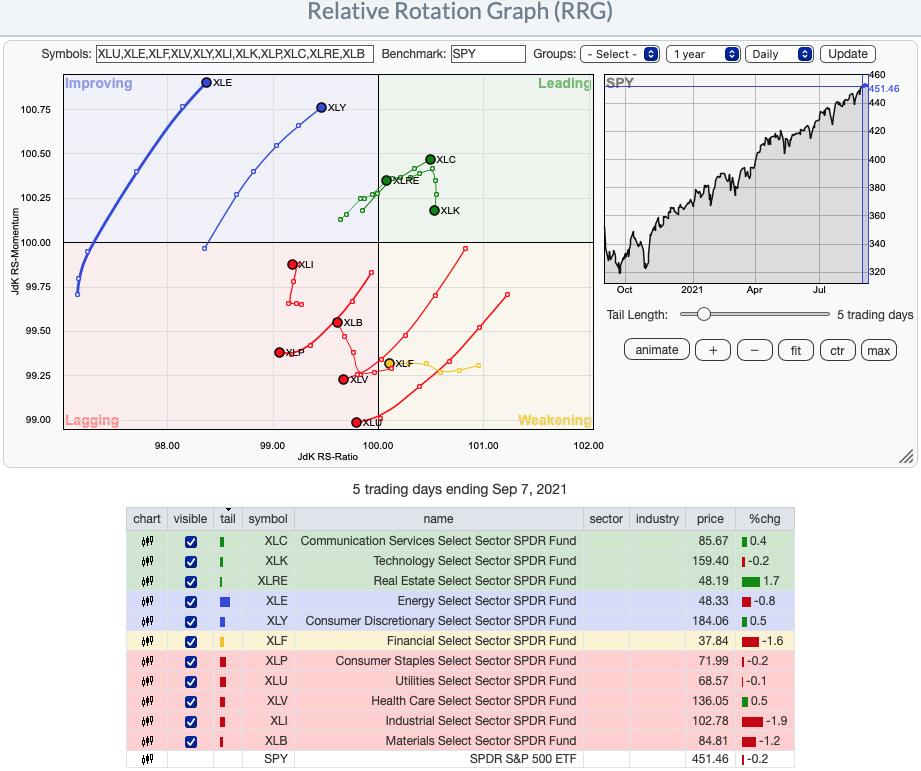
RRG® Chart: XLC has now entered the "Leading" quadrant with XLRE not far behind. XLY is traveling in the bullish northeast heading with XLE beginning to move similarly.

Don't miss the RECORDING of Mr. RRG, Julius de Kempanear's appearance in the FREE DP Trading Room from today!
Topic: DecisionPoint Trading Room
Start Time : Sep 7, 2021 08:45 AM
Meeting Recording Link HERE.
Access Passcode: Sept@7th
If you haven't registered for the free Trading Room yet, here is the LINK.
CLICK HERE for an animated version of the RRG chart.
CLICK HERE for Carl's annotated Sector charts.
THE MARKET (S&P 500)
IT Trend Model: BUY as of 5/8/2020
LT Trend Model: BUY as of 6/8/2020
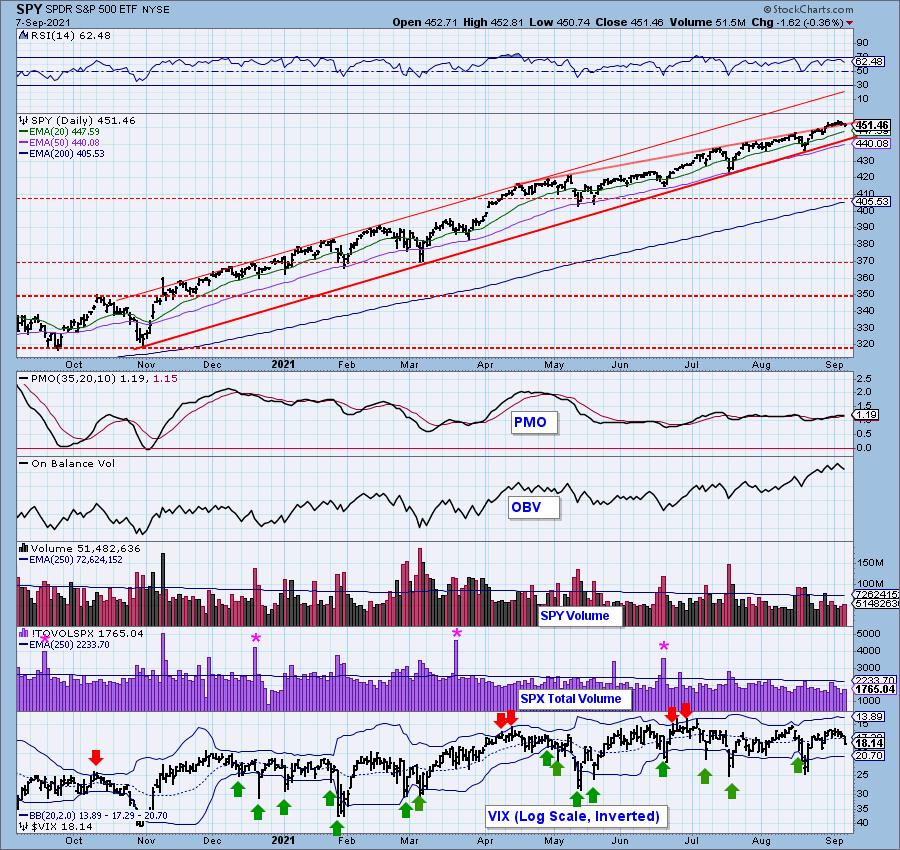
SPY Daily Chart: Price has made its way back into the intermediate-term rising wedge. In the meantime, it has formed a clear short-term rising wedge pattern.
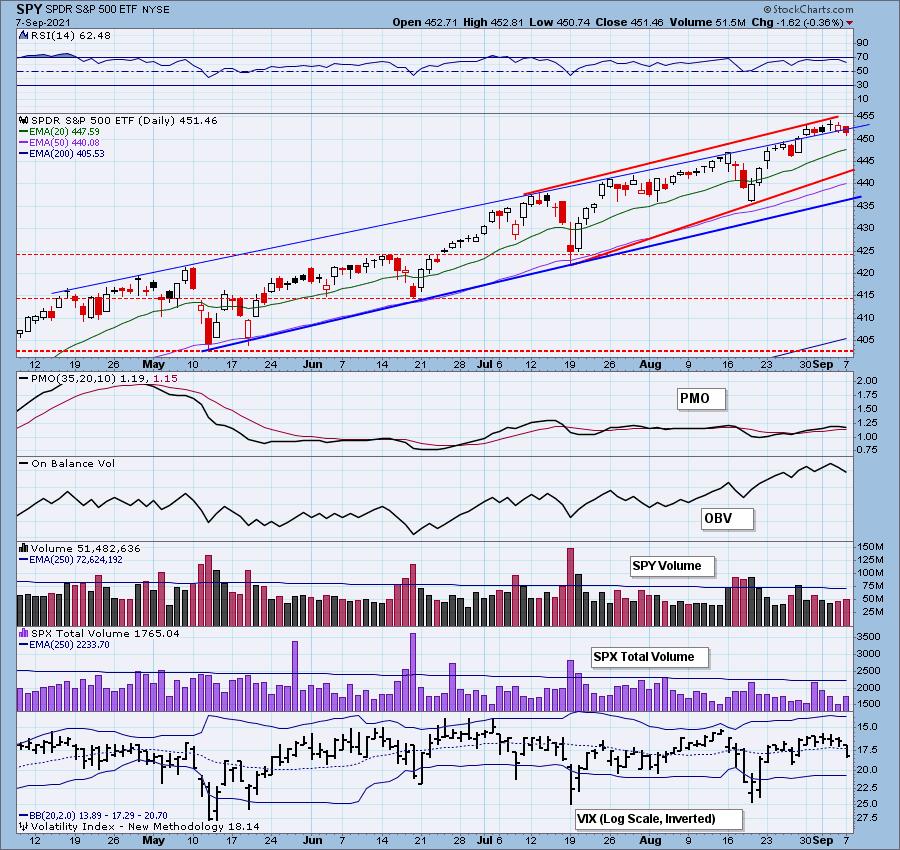
The PMO has drifted lower but clearly continues to confound as it continues to meander sideways. The RSI is positive, but it is drifting lower again.
Participation: The following chart uses different methodologies for objectively showing the depth and trend of participation for intermediate- and long-term time frames.
- The Silver Cross Index (SCI) shows the percentage of SPX stocks on IT Trend Model BUY signals (20-EMA > 50-EMA).
- The Golden Cross Index (GCI) shows the percentage of SPX stocks on LT Trend Model BUY signals (50-EMA > 200-EMA).
- The Bullish Percent Index (BPI) shows the percentage of SPX stocks on Point & Figure BUY signals.
The SCI had a negative crossover its signal line, but it didn't lose much ground.
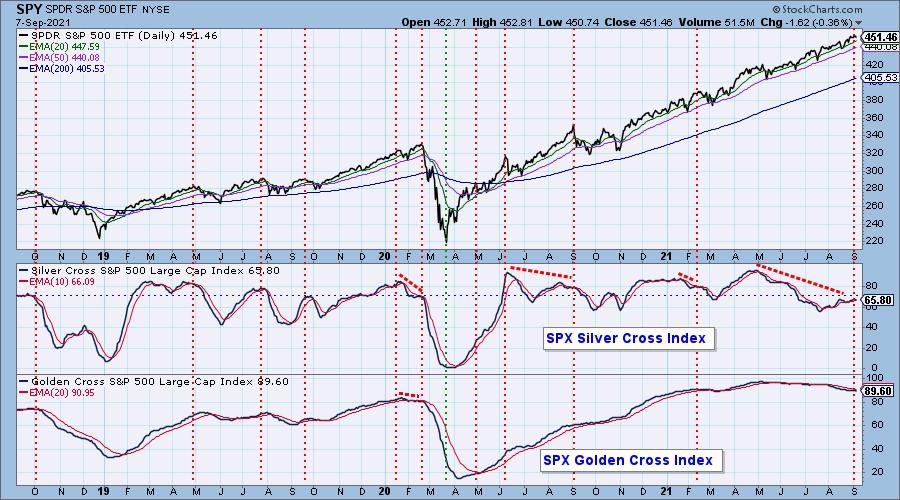
However, price participation dropped off a cliff. On the bright side, it is headed toward oversold territory.
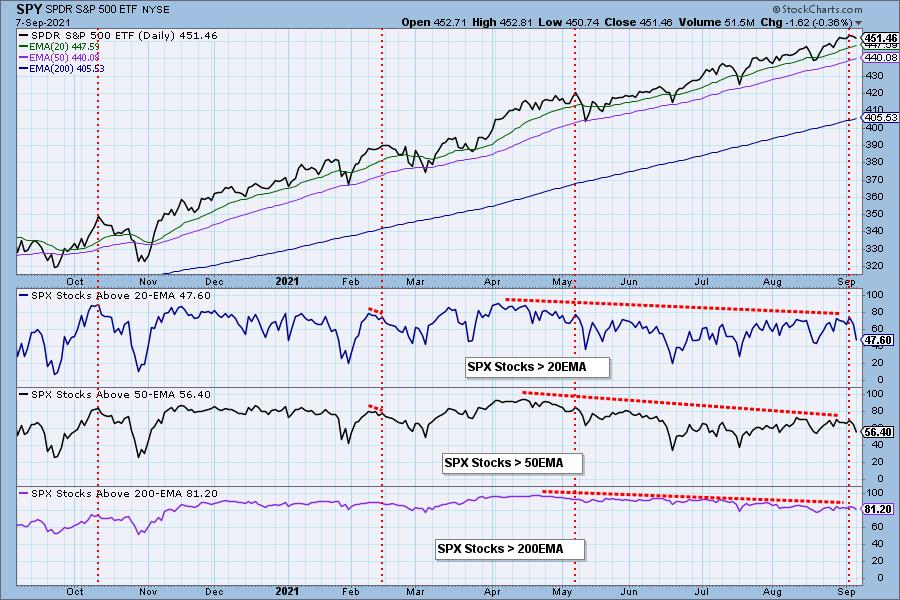
Climax Analysis: Net A-D saw a somewhat climactic reading, but we didn't get confirmation from our other indicators to suggest this was a climax day. The VIX dropped below its EMA on the inverted scale which tells us in the very short term, there is concern. We want to see the VIX puncture the lower Bollinger Band, that typically leads to an upside reversal. Right now, a declining VIX is bearish for the market.
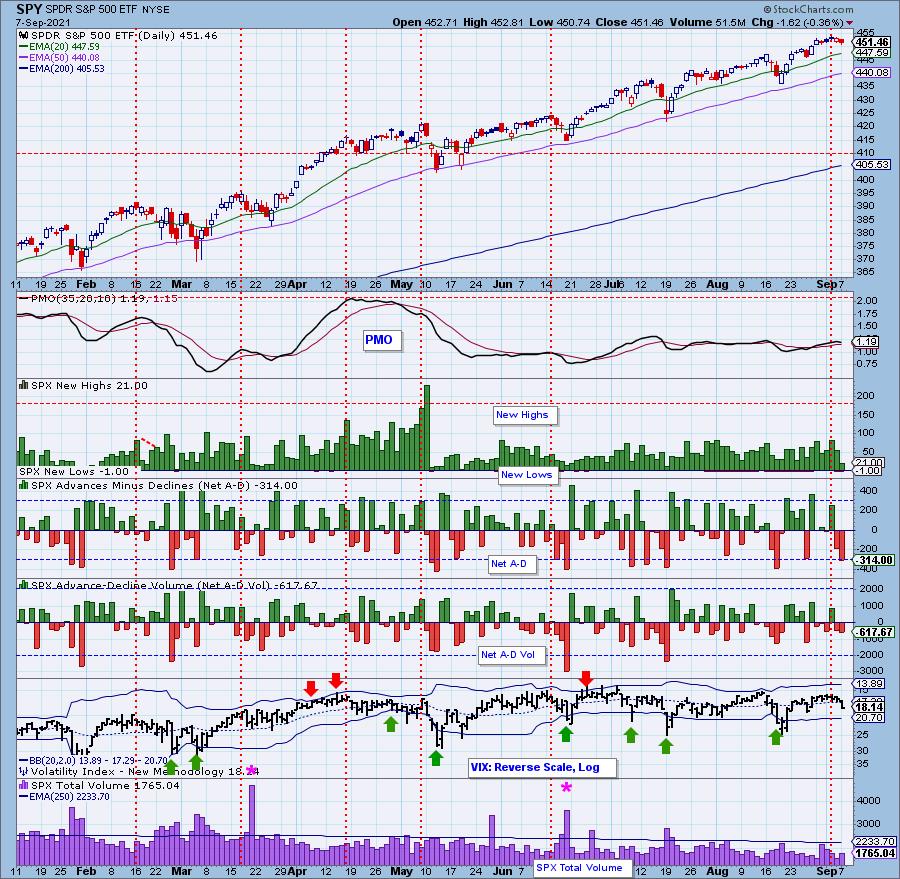
Short-Term Market Indicators: The short-term market trend is UP and the condition is NEUTRAL.
The STOs fell today with the STO-B dropping sharply. Notice that only 1/3rd of the SPX have rising momentum. Who is going to propel the market upward right now? The elite large-cap stocks can certainly hold it up, but when they fail, there is no safety net of stocks to takeover.
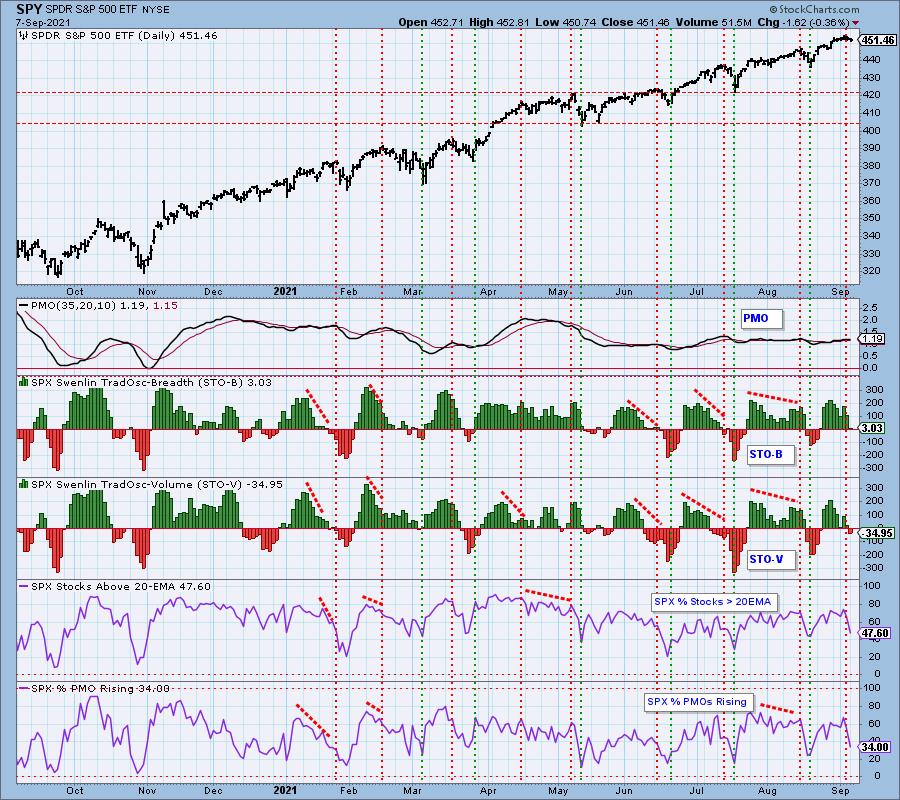
Intermediate-Term Market Indicators: The intermediate-term market trend is UP and the condition is OVERBOUGHT.
Like the short-term indicators, the ITBM and ITVM continue to move lower. At this time, about half of the SPX are on PMO crossover BUY signals which is encouraging, the problem is so few have price above their 20/50-EMAs.
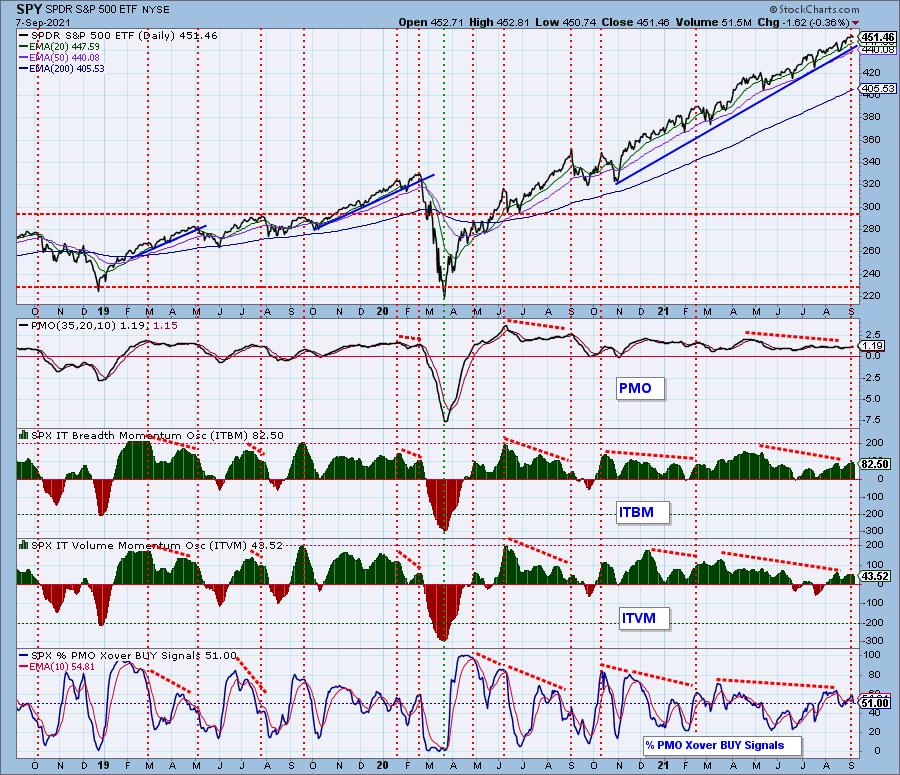
Bias Assessment: It occurred to us that one of the ways we can measure market bias is to compare the SCI to the percent of stocks above their 20/50-EMAs. When the percentages are lower than the SCI, the market bias is bearish and if they are higher, it is bullish. Any "mechanical" signal requires additional analysis to confirm the numbers.
The SCI didn't lose much ground, but participation dropped heavily. This gives us a bearish bias in both the short and intermediates terms.
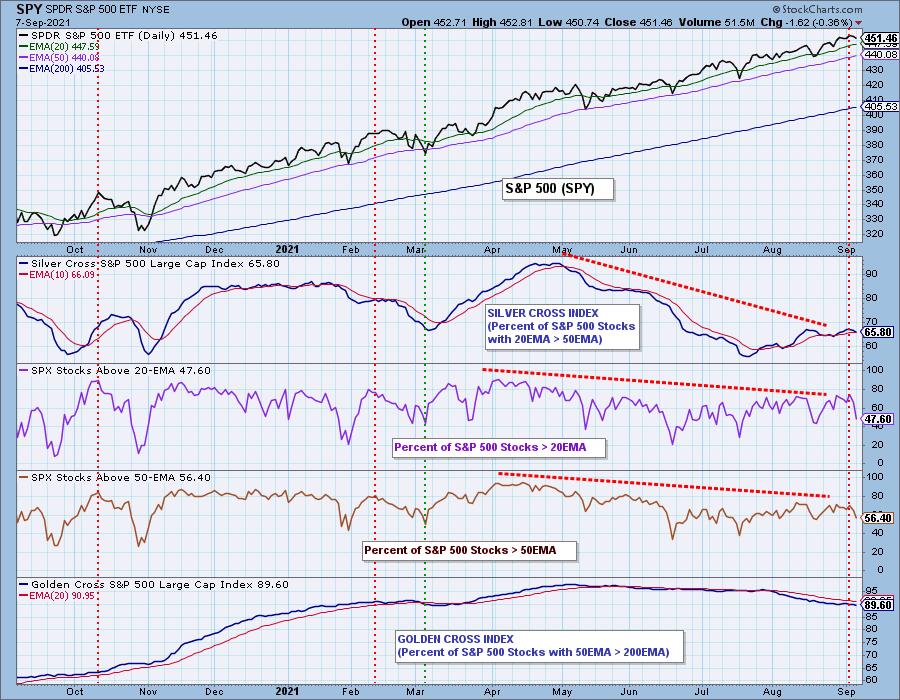
CONCLUSION: Indicators all declined today as the market stumbled. In my mind, this confirms the bearish bias suggested by the SCI and participation readings. Participation numbers are beginning to move into oversold territory, but they still can accommodate plenty of downside and move even lower. I suspect we will see a short pullback in price that will test the 20-EMA at a minimum. The indicators aren't quite negative enough to suggest a heavy sell-off... not yet. Stay vigilant and be sure you have your stops set. I am 70% exposed to the market.
Have you subscribed the DecisionPoint Diamonds yet? DP does the work for you by providing handpicked stocks/ETFs from exclusive DP scans! Add it with a discount! Contact support@decisionpoint.com for more information!
BITCOIN
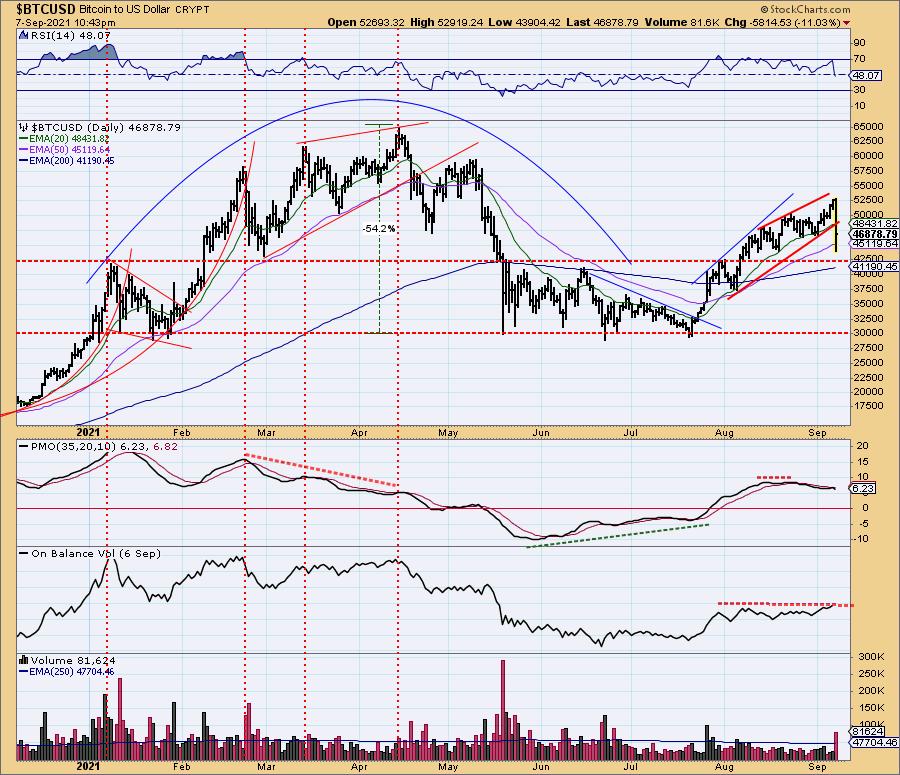
The story over the weekend was that Reddit and Twitter were pushing the 'meme' agenda with Bitcoin. El Salvador has adopted it as their national currency. The chatter was encouraging everyone to pour into Bitcoin in "celebration". Instead, we watched as Bitcoin tumbled going into trading today. It lost over 11% of its value today. We had been watching the bearish rising wedge develop and today it executed the pattern with its spectacular decline. Now the PMO has turned down below its signal line and the RSI has moved into negative territory. The next level of support is at the 50-EMA and the 42500 level.
INTEREST RATES
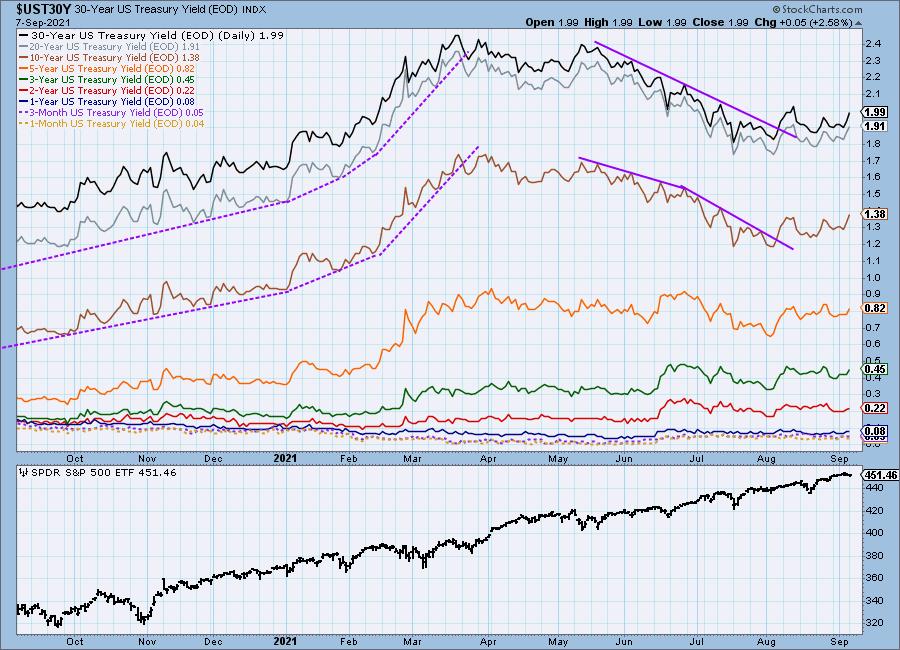
Yields are moving mostly sideways since breaking out of their declining trend.
10-YEAR T-BOND YIELD
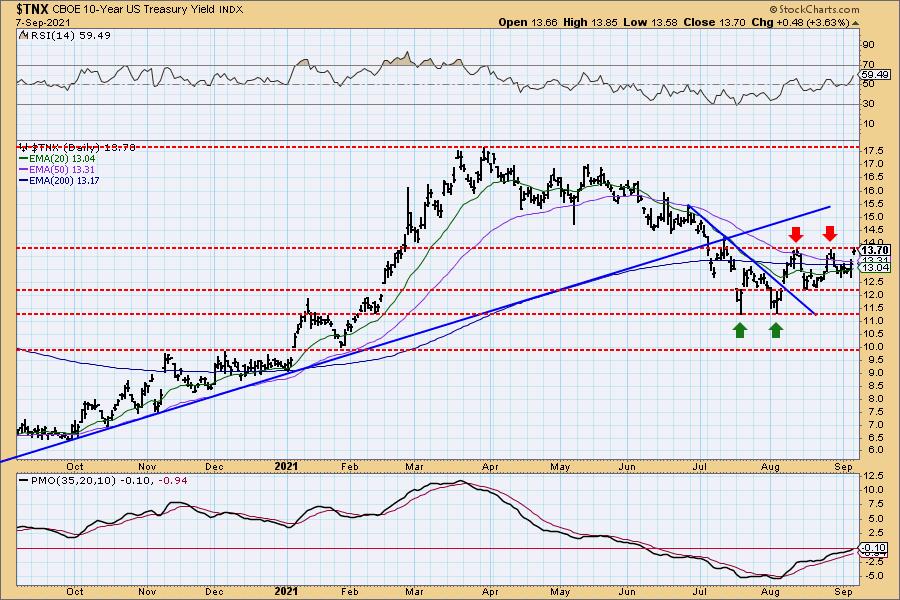
The 10-Year Treasury Yield rallied strongly today. Overhead resistance has now been reached at last month's highs. The RSI is positive and rising. The PMO is also rising and should make it into positive territory shortly. My concern with today's gap up rally is the possibility of a 'reverse island' formation. We could see a gap down tomorrow given $TNX stopped at overhead resistance.
DOLLAR (UUP)
IT Trend Model: BUY as of 6/22/2021
LT Trend Model: BUY as of 8/19/2021
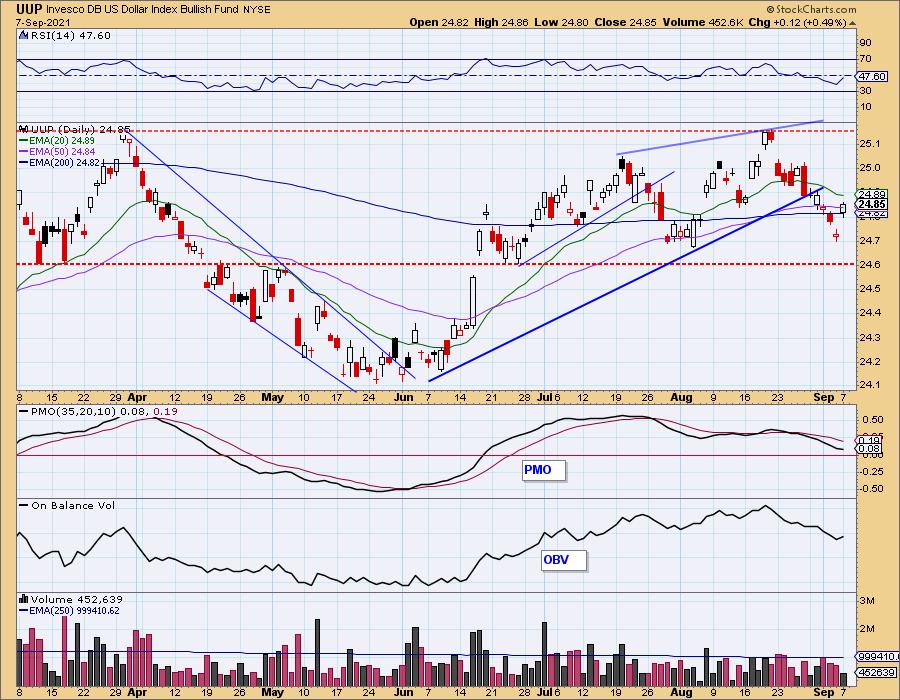
UUP Daily Chart: The Dollar rallied pushing UUP back above the 50/200-EMAs. While the chart is improving, I won't trust the rally until I see a close above the 20-EMA.
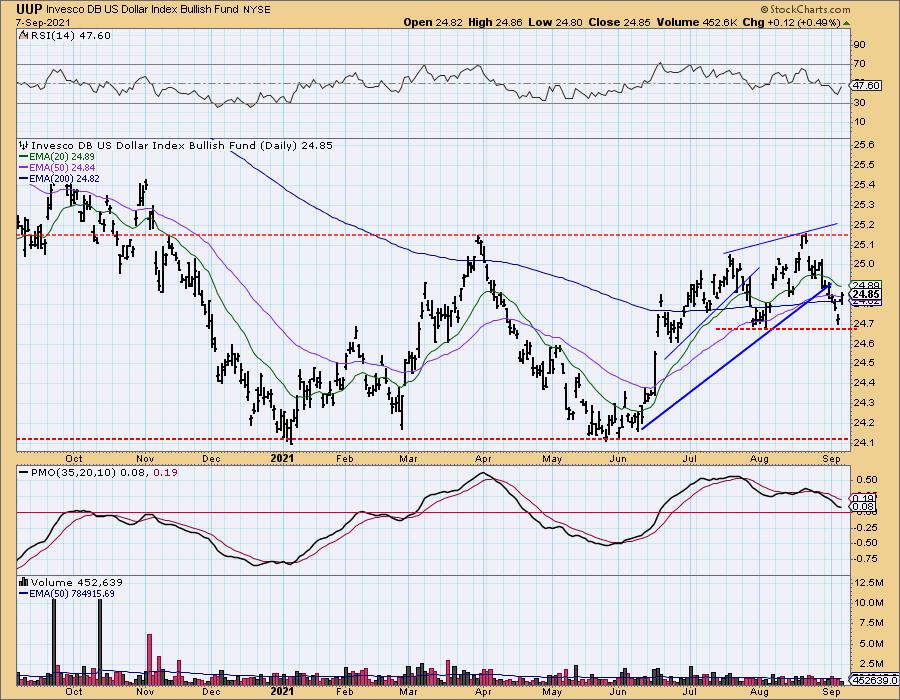
Price is bouncing off support at the July/August lows which is encouraging.
GOLD
IT Trend Model: NEUTRAL as of 6/24/2021
LT Trend Model: SELL as of 8/9/2021
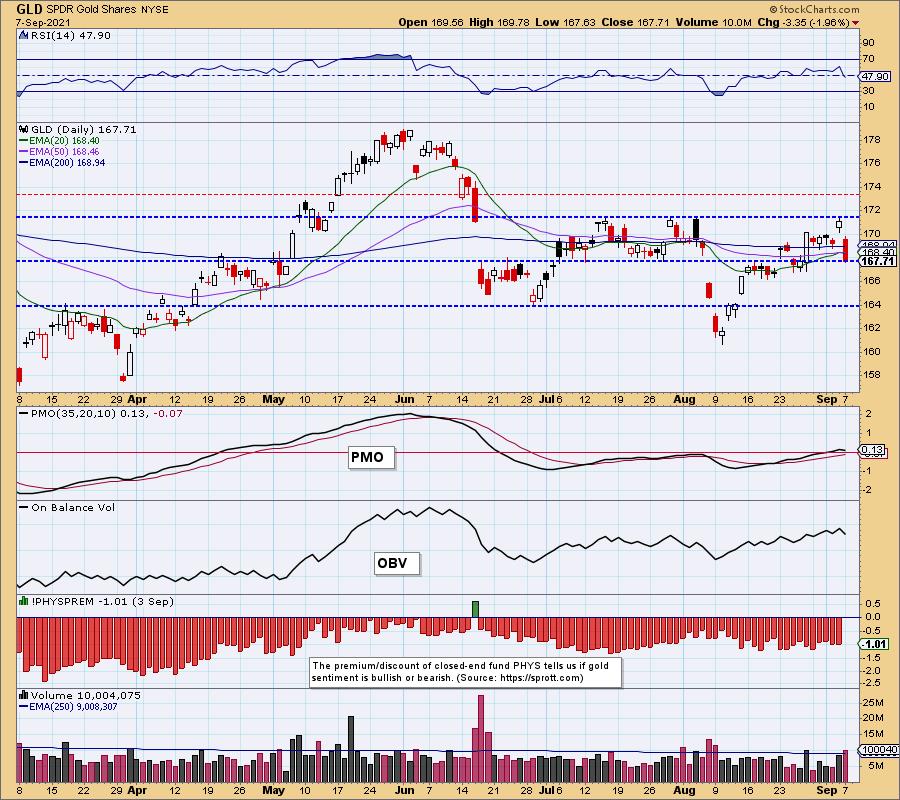
GLD Daily Chart: We were waiting for what we thought was going to be an inevitable IT Trend Model "Silver Cross" BUY signal as the 20-EMA was just hundredths of a point away from a positive cross above the 50-EMA. Instead GLD fell heavily.
(Full disclosure: I own GLD)
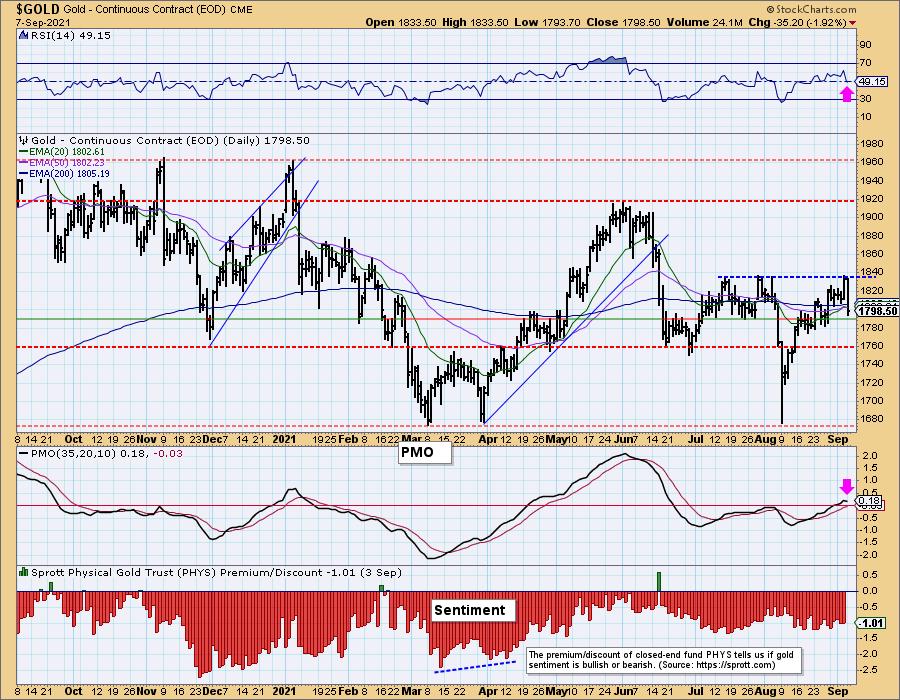
GOLD Daily Chart: We now see a negative RSI and topping PMO on the 1-year chart for $GOLD. Price failed to overcome resistance at the top of the July trading range. Now it is testing the bottom of that range. I think we will be fortunate if $GOLD holds this level of support. More than likely we will have to endure a test of support at the June lows.
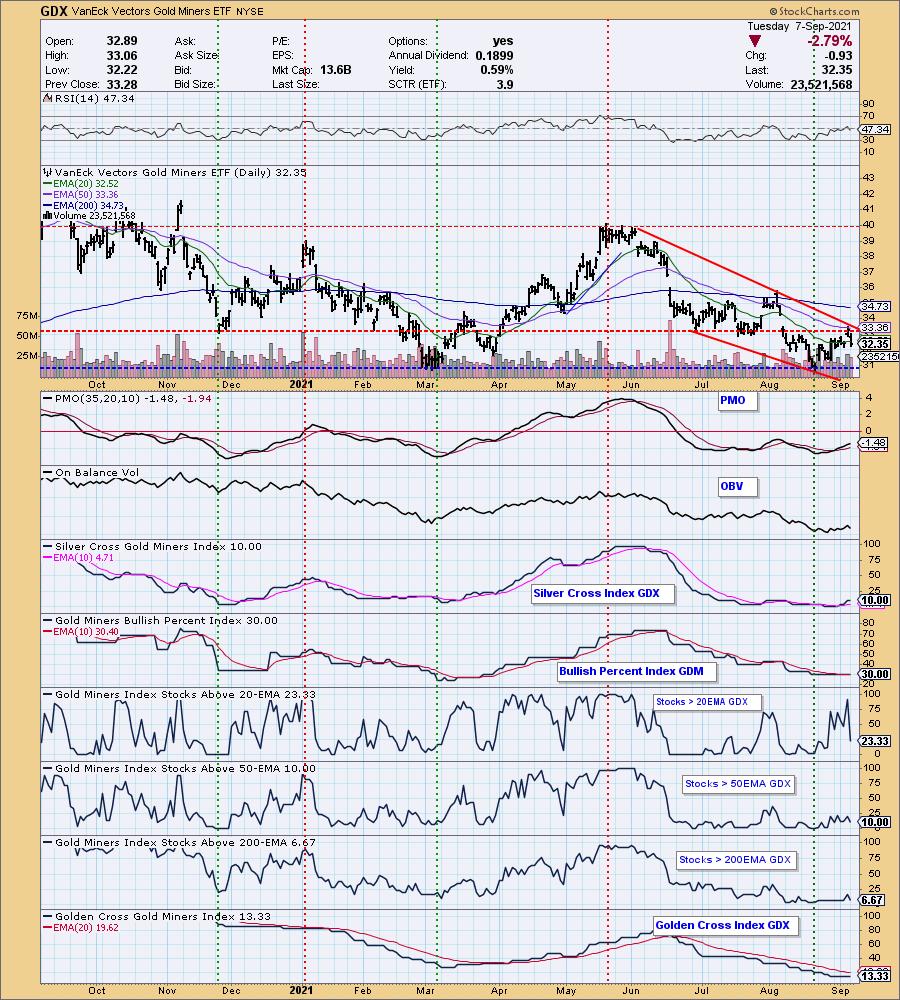
GOLD MINERS Golden and Silver Cross Indexes: Per usual Gold Miners broke down just as they were beginning to look interesting again. Participation had improved greatly and today it was all torn down. The very short-term rising trend out of the August low is still holding up, but given another failure to breakout and the quick destruction of participation, they will likely retreat further.
CRUDE OIL (USO)
IT Trend Model: BUY as of 9/7/2021
LT Trend Model: BUY as of 3/9/2021
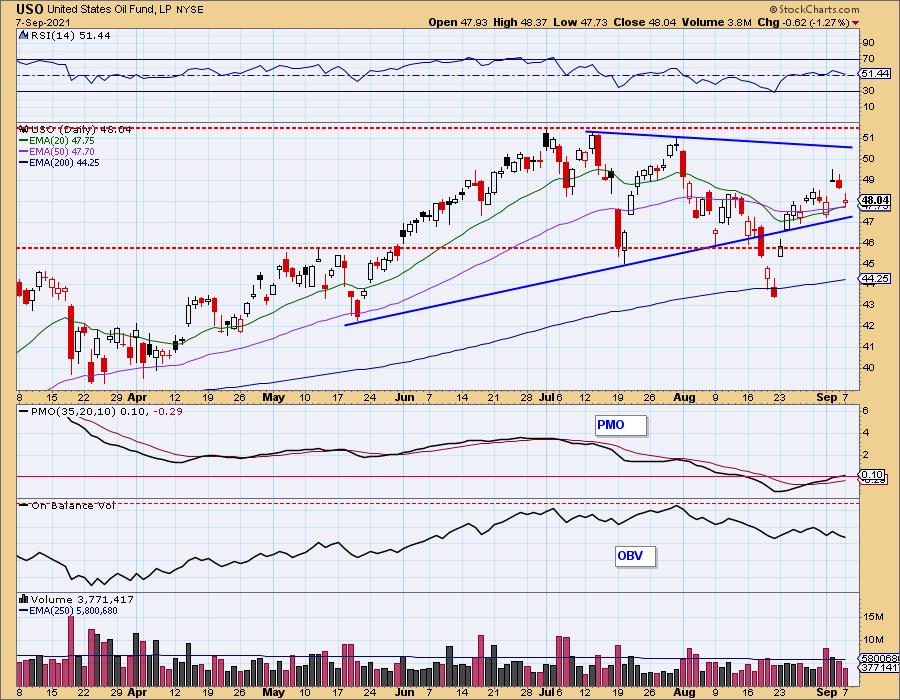
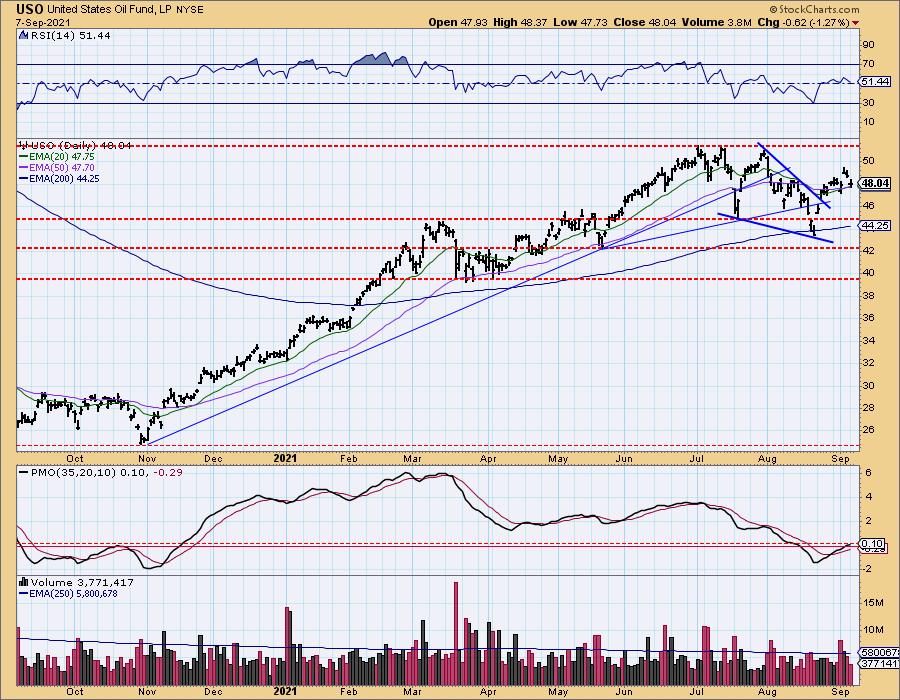
USO Daily Chart: USO pulled back to test the 20/50-EMAs. Price did hold above them both which allowed a "Silver Cross" of the 20/50-EMAs. This gives us a new IT Trend Model BUY signal. The PMO has flattened out, but remains in positive territory just like the RSI. This could be the next upside reversal point.
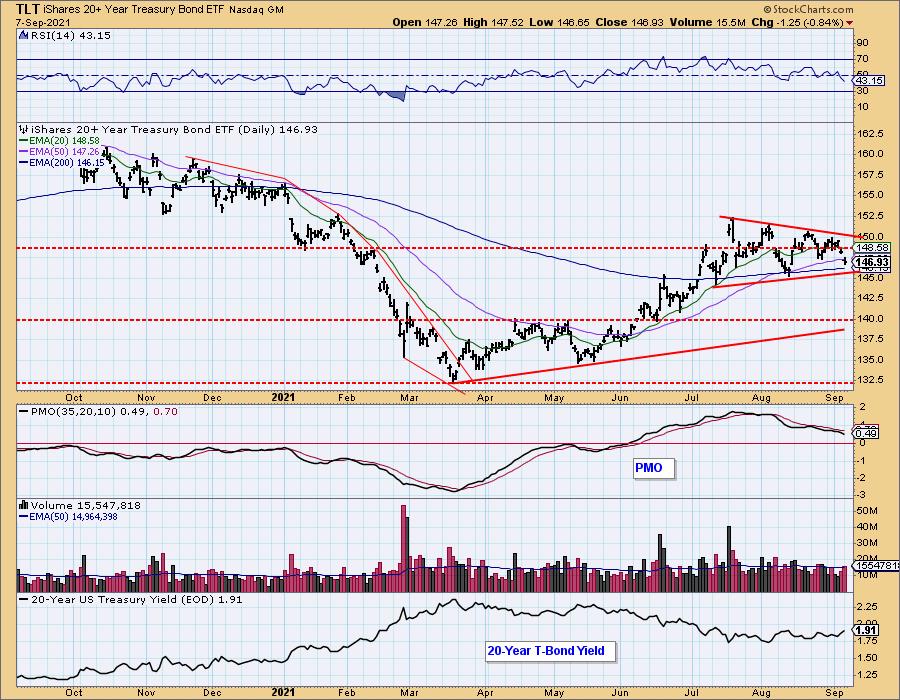
BONDS (TLT)
IT Trend Model: BUY as of 6/10/2021
LT Trend Model: BUY as of 8/10/2021
TLT Daily Chart: Given the rally in long-term yields today we shouldn't be surprised to see TLT continuing lower. It is now reaching overlapping support at the 200-EMA and the bottom of the symmetrical triangle.
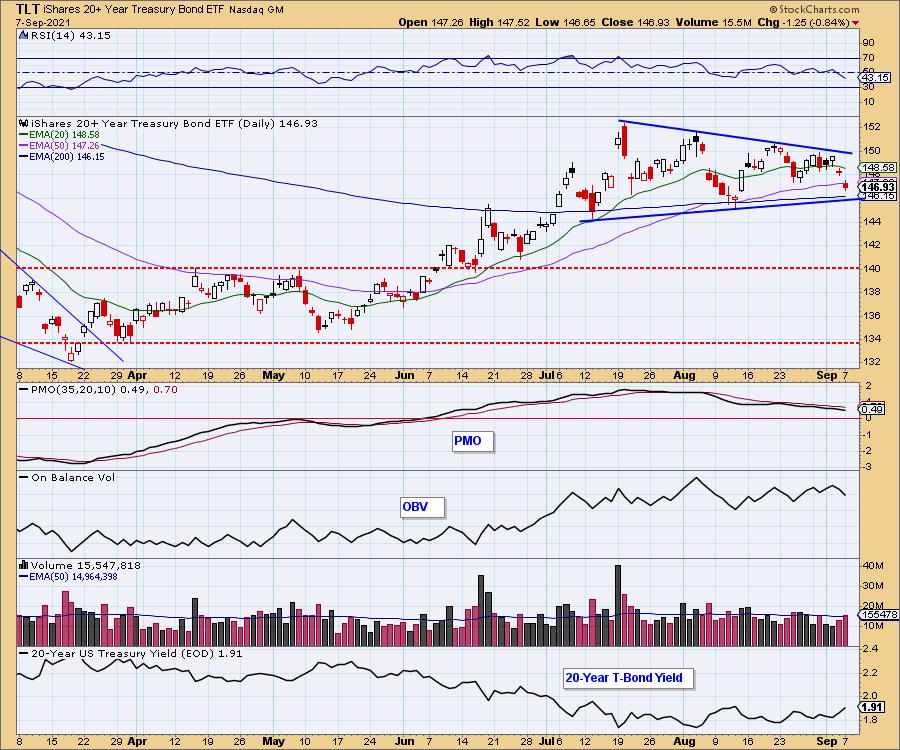
The PMO and RSI are not encouraging. The symmetrical triangle is a continuation pattern which does suggest the rally that started in May will resume. However, the RSI and PMO do not seem to agree. Until the yield chart looks bearish again, I would avoid long bonds.
Technical Analysis is a windsock, not a crystal ball.
--Erin Swenlin
(c) Copyright 2021 DecisionPoint.com
Disclaimer: This blog is for educational purposes only and should not be construed as financial advice. The ideas and strategies should never be used without first assessing your own personal and financial situation, or without consulting a financial professional. Any opinions expressed herein are solely those of the author, and do not in any way represent the views or opinions of any other person or entity.
NOTE: The signal status reported herein is based upon mechanical trading model signals, specifically, the DecisionPoint Trend Model. They define the implied bias of the price index based upon moving average relationships, but they do not necessarily call for a specific action. They are information flags that should prompt chart review. Further, they do not call for continuous buying or selling during the life of the signal. For example, a BUY signal will probably (but not necessarily) return the best results if action is taken soon after the signal is generated. Additional opportunities for buying may be found as price zigzags higher, but the trader must look for optimum entry points. Conversely, exit points to preserve gains (or minimize losses) may be evident before the model mechanically closes the signal.
Helpful DecisionPoint Links:
DecisionPoint Alert Chart List
DecisionPoint Golden Cross/Silver Cross Index Chart List
DecisionPoint Sector Chart List
Price Momentum Oscillator (PMO)
Swenlin Trading Oscillators (STO-B and STO-V)
DecisionPoint is not a registered investment advisor. Investment and trading decisions are solely your responsibility. DecisionPoint newsletters, blogs or website materials should NOT be interpreted as a recommendation or solicitation to buy or sell any security or to take any specific action.