
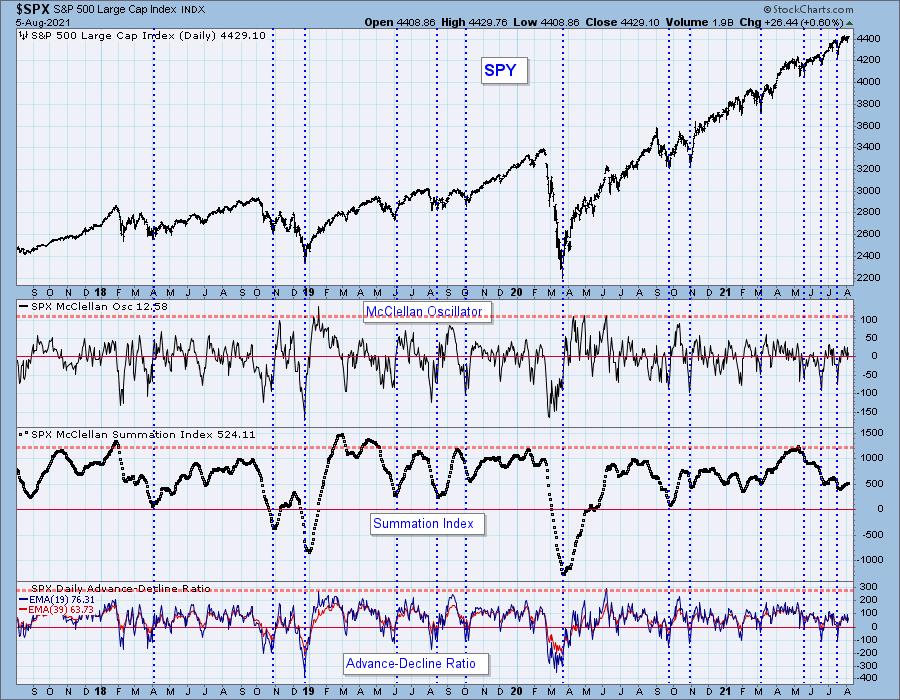
One chart I don't look at too often is the McClellan Oscillator and Summation Index chart. You can get this chart for all of the major indexes in the DecisionPoint ChartPack on StockCharts.com. I had forgotten how prescient these indicators are!
In the chart below I have annotated vertical blue dotted lines at cardinal lows. You can see how the Summation Index catches these market bottoms with lows of its own. Currently it is rising and as long as it continues to rise, the market typically continues to rise.
I will be keeping an eye on this chart to watch for any deterioration of the Summation Index. Right now it looks fairly bullish. To read more about the McClellan Summation Index, check out this ChartSchool article.
The DecisionPoint Alert Weekly Wrap presents an end-of-week assessment of the trend and condition of the Stock Market, the U.S. Dollar, Gold, Crude Oil, and Bonds. The DecisionPoint Alert daily report (Monday through Thursday) is abbreviated and gives updates on the Weekly Wrap assessments.
Watch the latest episode of DecisionPoint on StockCharts TV's YouTube channel here!
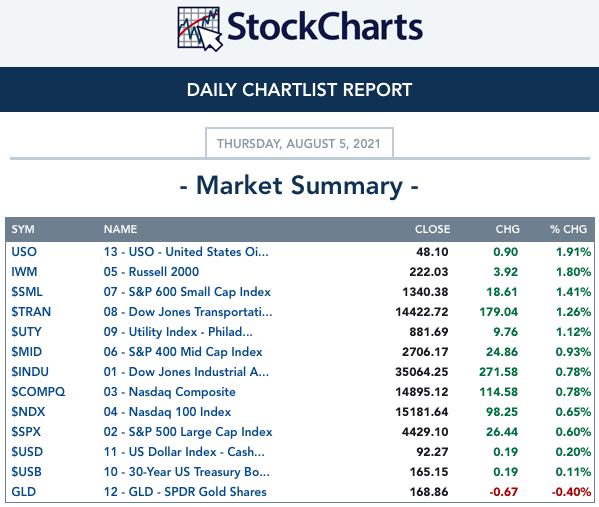
MAJOR MARKET INDEXES
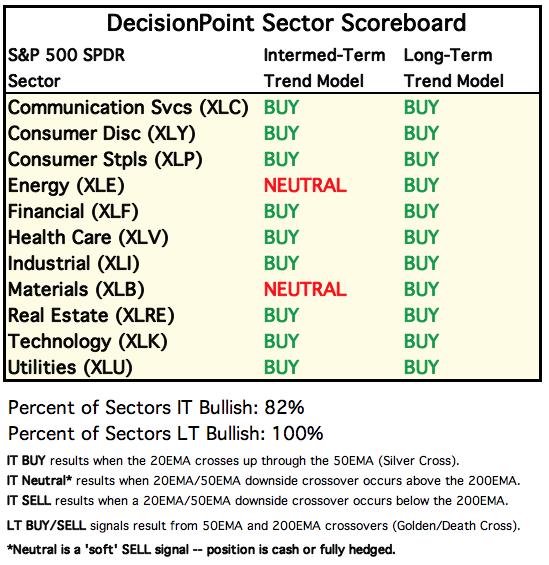
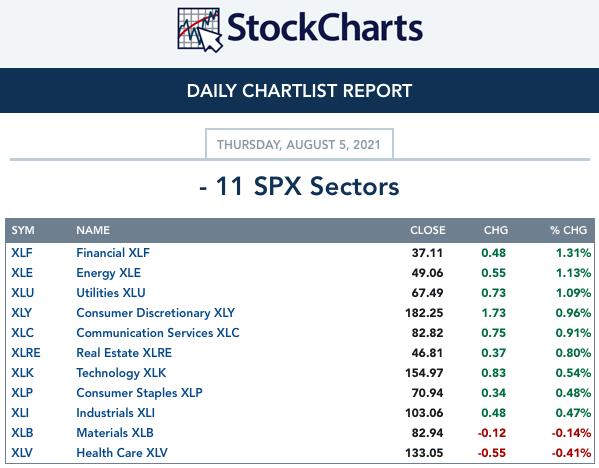
SECTORS
Each S&P 500 Index component stock is assigned to one, and only one, of 11 major sectors. This is a snapshot of the Intermediate-Term (Silver Cross) and Long-Term (Golden Cross) Trend Model signal status for those sectors.
RRG® Chart: XLV and XLU are the only sectors in the Leading category and they continue to head in the positive northeast direction.
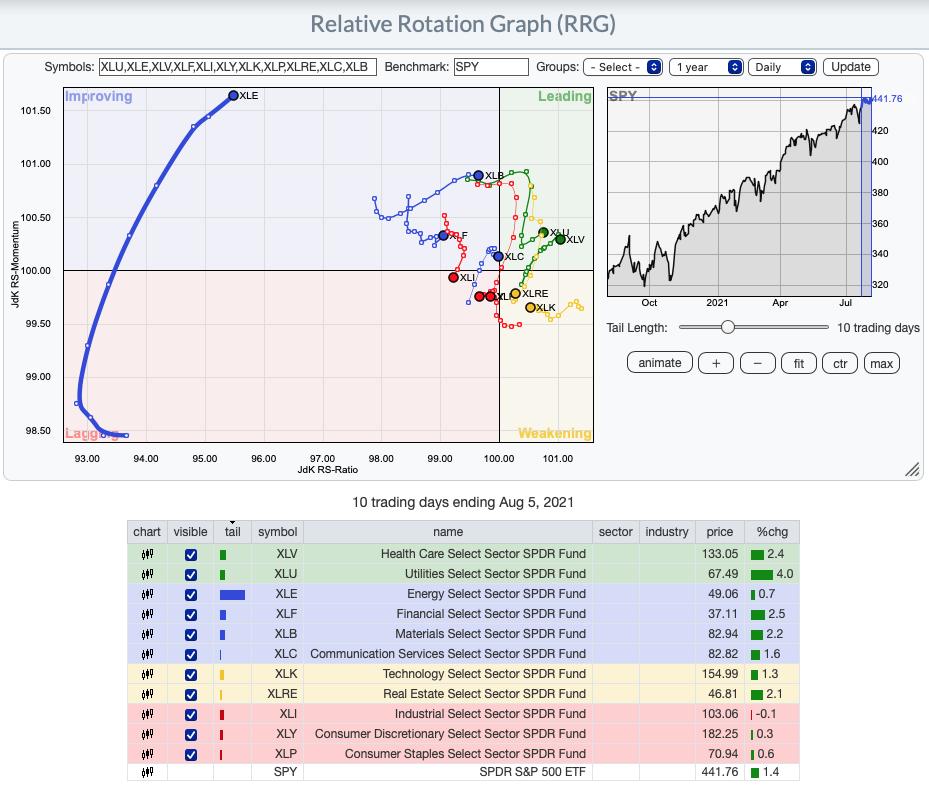
CLICK HERE for an animated version of the RRG chart.
CLICK HERE for Carl's annotated Sector charts.
THE MARKET (S&P 500)
IT Trend Model: BUY as of 5/8/2020
LT Trend Model: BUY as of 6/8/2020
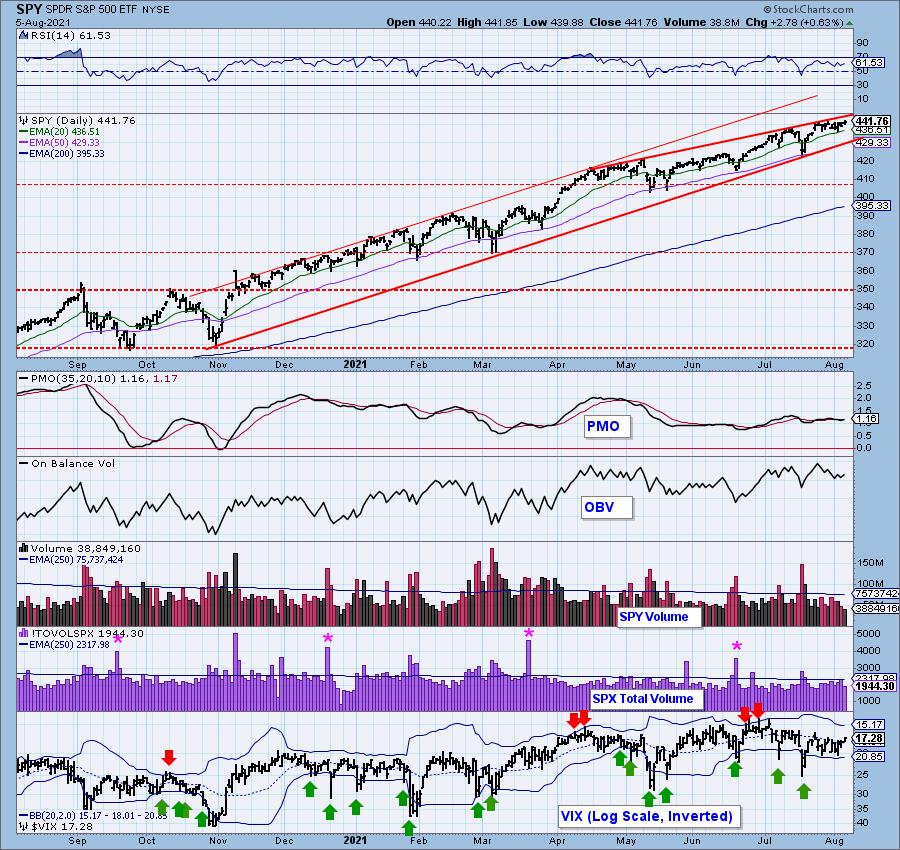
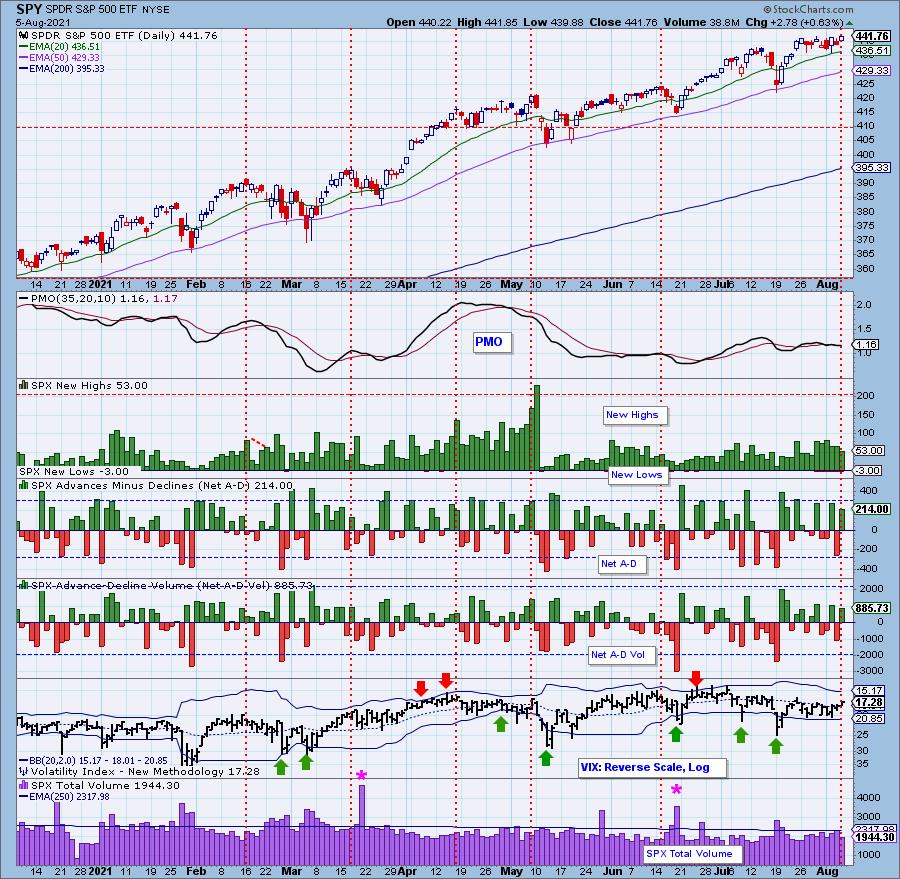
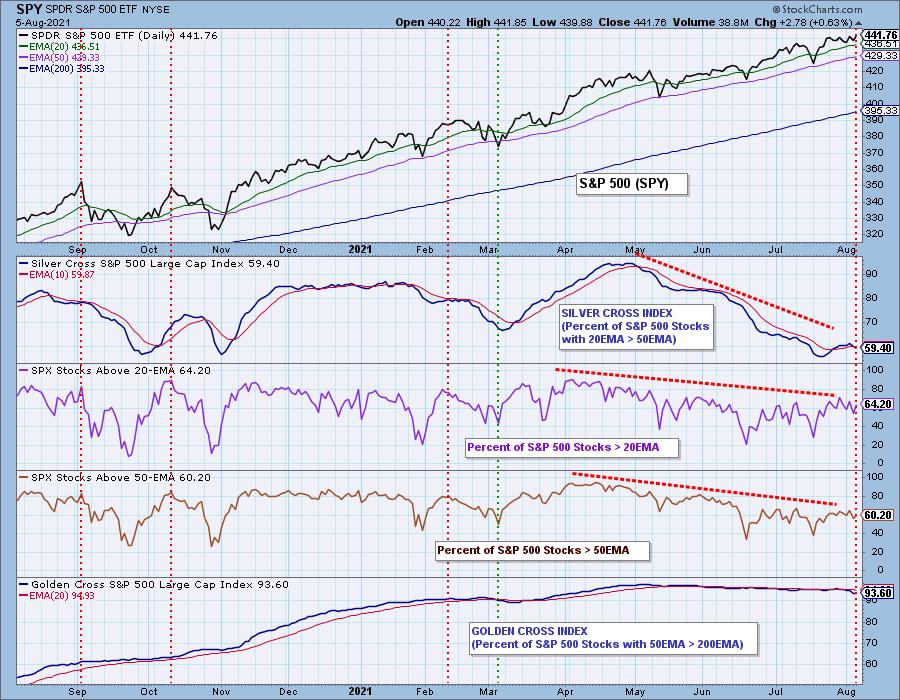
SPY Daily Chart: The PMO didn't whipsaw back into a crossover BUY signal, but it will likely happen tomorrow if new all-time highs continue to be set. Total volume pared back on today's rally but we can see the VIX is finally back above its EMA on the inverted scale.
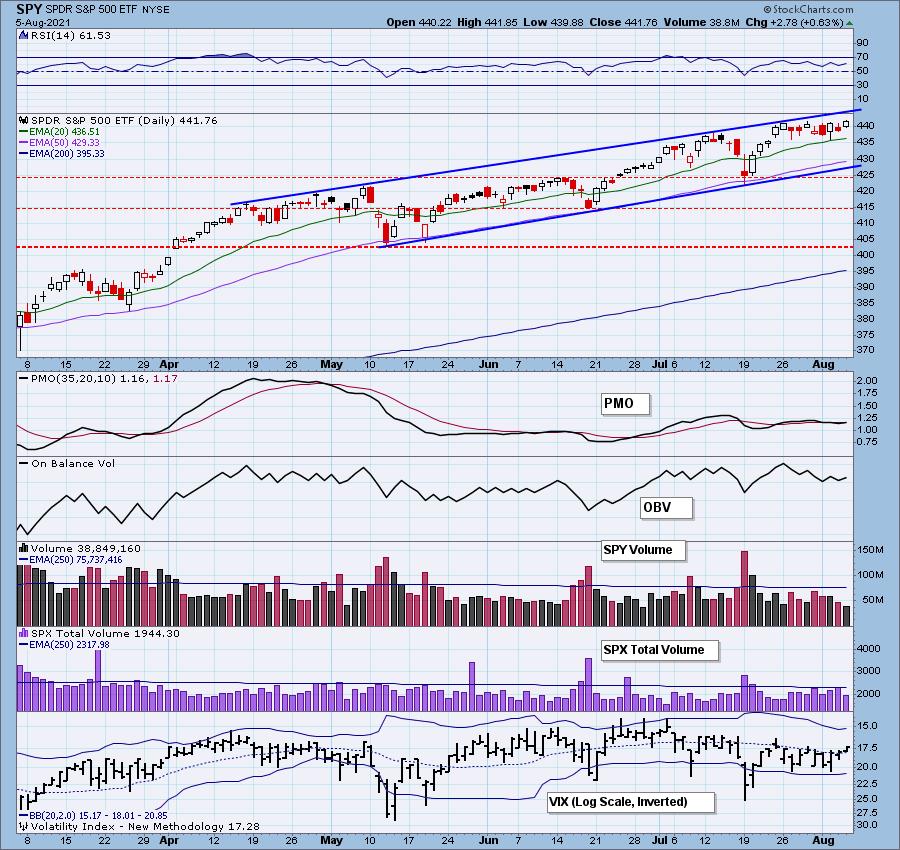
The RSI is positive as price continues to chop away. The 20-EMA is currently holding as support which is bullish, but the rising wedge has not been extinguished.
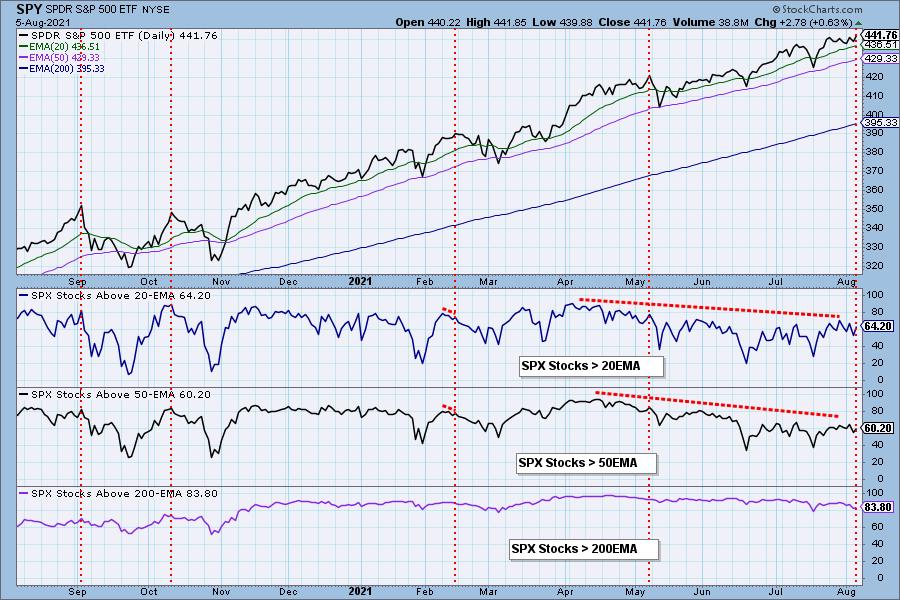
Participation: The following chart uses different methodologies for objectively showing the depth and trend of participation for intermediate- and long-term time frames.
- The Silver Cross Index (SCI) shows the percentage of SPX stocks on IT Trend Model BUY signals (20-EMA > 50-EMA).
- The Golden Cross Index (GCI) shows the percentage of SPX stocks on LT Trend Model BUY signals (50-EMA > 200-EMA).
- The Bullish Percent Index (BPI) shows the percentage of SPX stocks on Point & Figure BUY signals.
The SCI continued lower causing a negative crossover with its signal line. We find that very bearish particularly after a move to new all-time highs. The GCI is inching slowly lower.
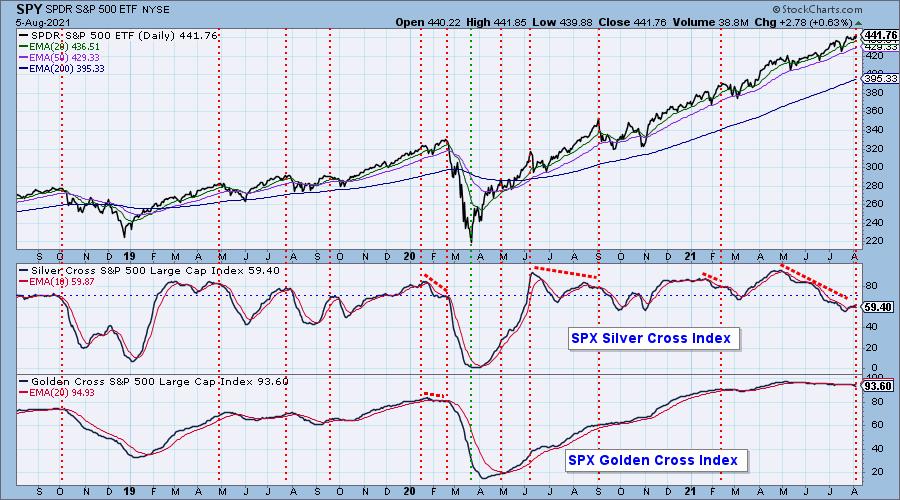
While participation improved slightly, the negative divergences are still there. We are now able to visually detect a declining trend on the %Stocks > 200-EMA. The good news is it is getting near-term oversold.
Climax Analysis: No climax today. However, we did see a contraction on New Highs on a day where new all-time highs were logged. On the bright side, a rising VIX above its EMA generally means rising prices ahead.
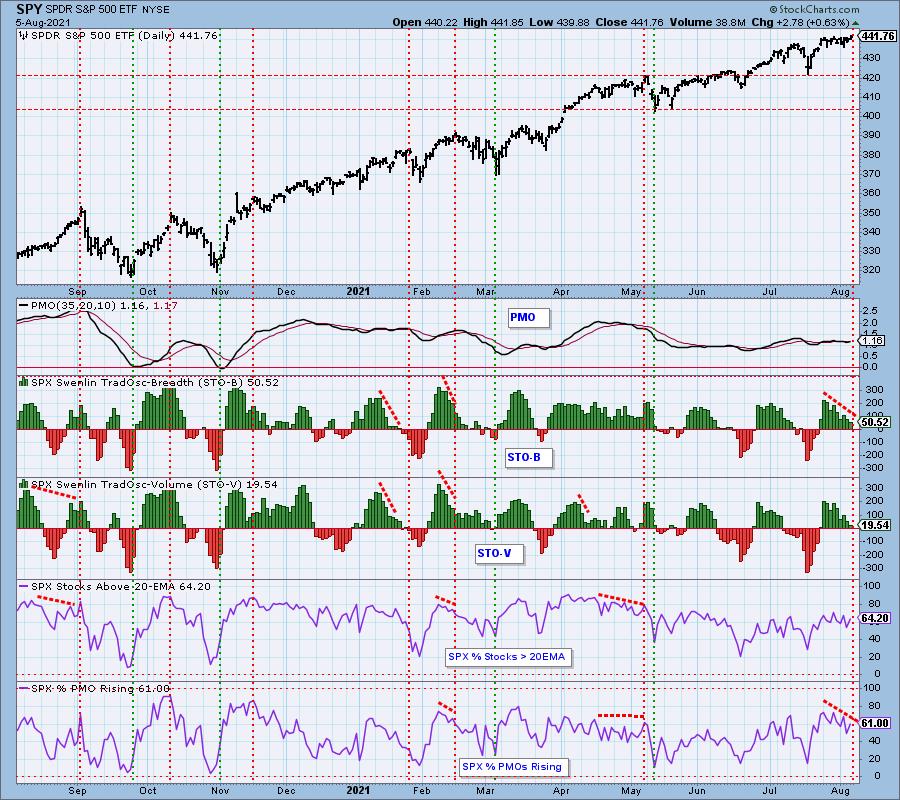
Short-Term Market Indicators: The short-term market trend is NEUTRAL and the condition is NEUTRAL.
No improvement on the STOs as they continue lower despite price rallying almost 0.70%. We have a declining trend on %Stocks with rising momentum.
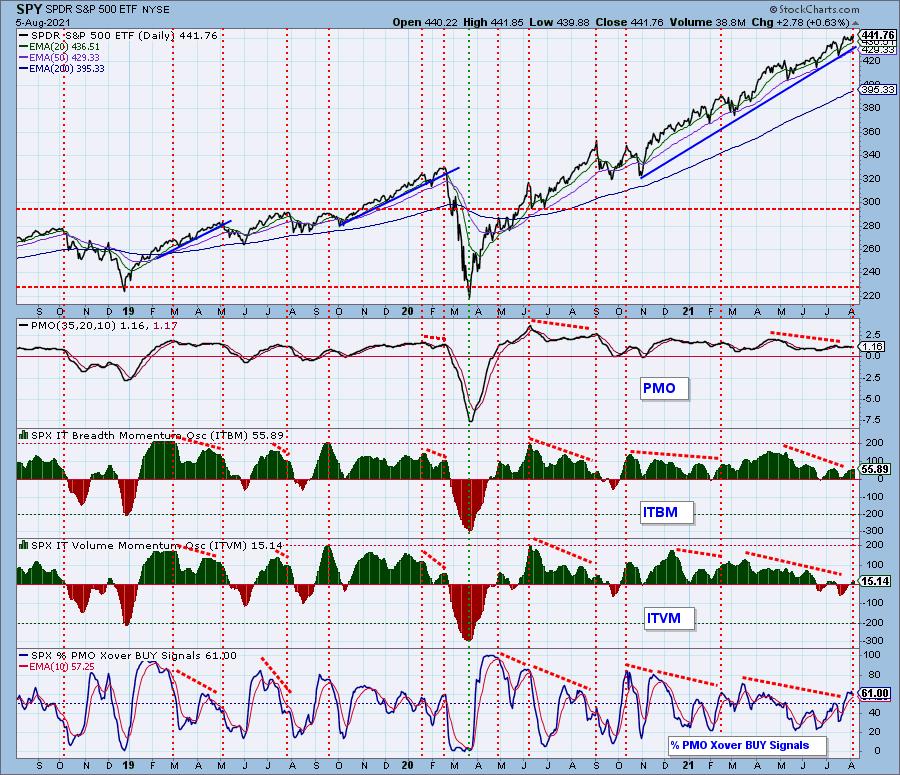
Intermediate-Term Market Indicators: The intermediate-term market trend is UP and the condition is NEUTRAL.
IT indicators rose slightly today, but also sport a negative divergence with price.
Bias Assessment: We've added this new section called "bias assessment". It occurred to me that one of the ways we can measure market bias is to compare the SCI to the percent of stocks above their 20/50-EMAs. When the percentages are lower than the SCI, the market bias is bearish and if they are higher, it is bullish. Any "mechanical" signal requires additional analysis to confirm the numbers.
The market bias is still a tiny bit positive in the short term given 64% of stocks have price > 20-EMA v. 60% SCI reading. Given the negative crossover on the SCI, I wouldn't read too much into that.
CONCLUSION: Price rallied to new all-time highs today, but participation continues to see damage. A negative crossover on the SCI is very problematic. Carl stated it well in an email to me:
The market just seems to want to go up, in spite of really poor participation. I'm guessing that the Fed's liquidity largesse is largely responsible. We're currently in a 6-month period of negative seasonality, which could be the reason the market isn't going up faster. I say we keep watching participation (SCI) – maybe it improves or gets worse – and take our cue from there.
I am now 60% exposed to the market.
Have you subscribed the DecisionPoint Diamonds yet? DP does the work for you by providing handpicked stocks/ETFs from exclusive DP scans! Add it with a discount! Contact support@decisionpoint.com for more information!
BITCOIN
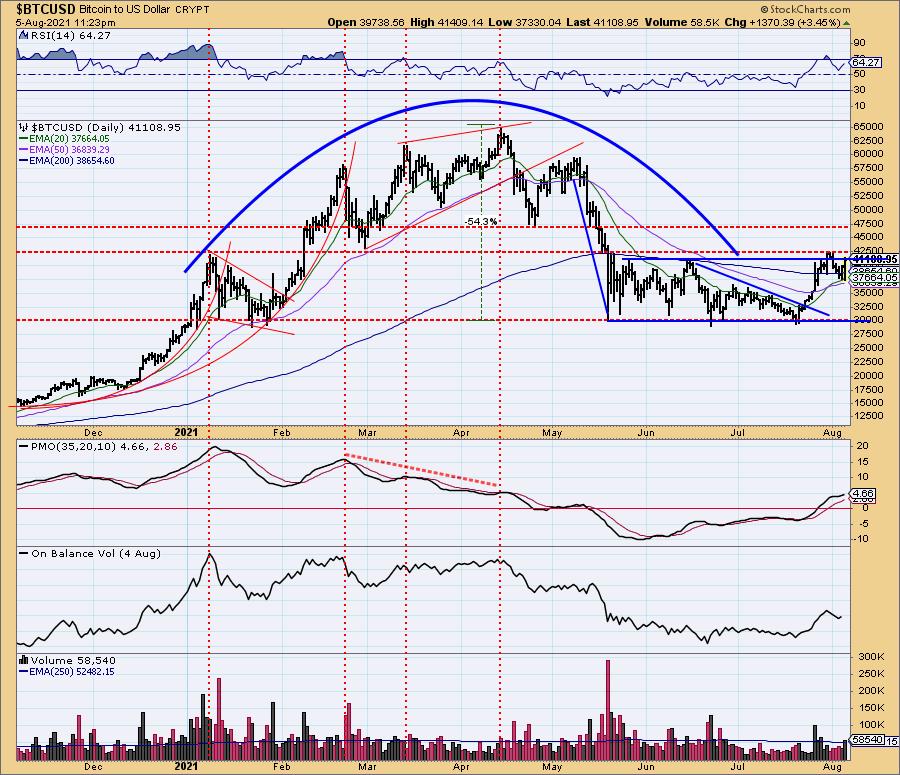
Bitcoin rallied strongly, but continues to push hard on resistance at $42,500. The PMO has bottomed above the signal line and the RSI is positive. Given the bounce off the 20/50-EMAs, this time it could successfully move above resistance.
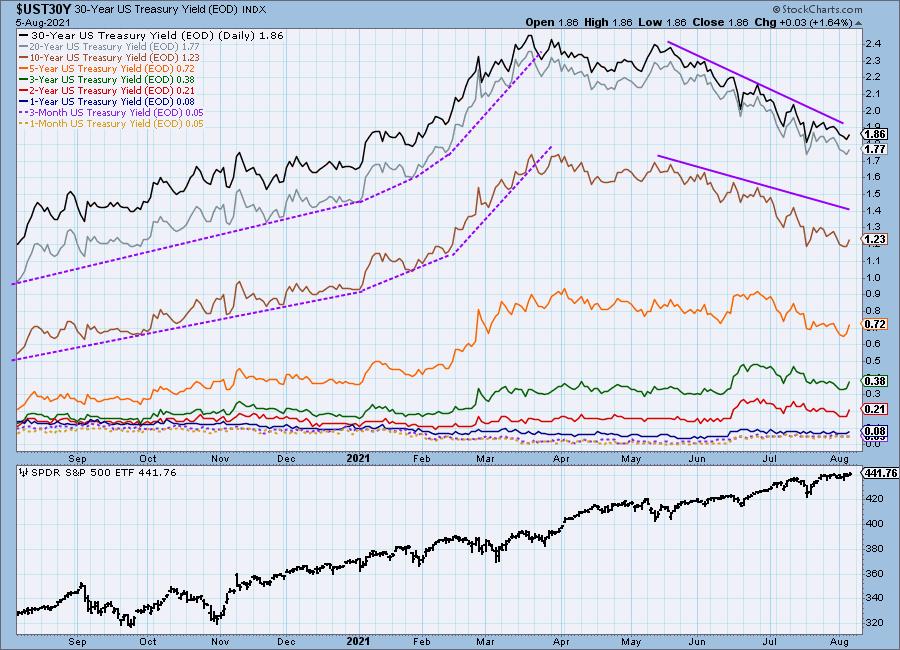
INTEREST RATES
Longer-term rates are continuing in their declining trend.
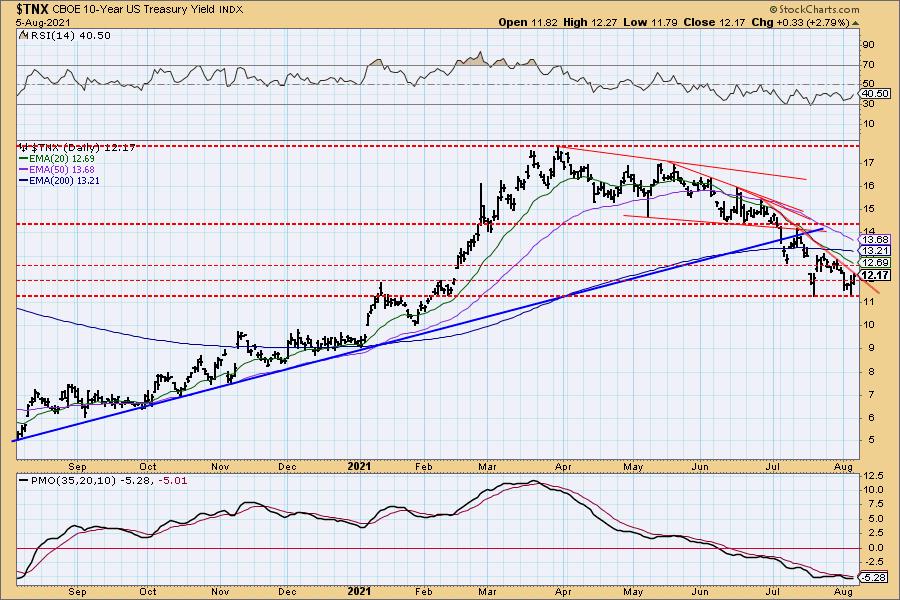
10-YEAR T-BOND YIELD
Yesterday's comments still apply:
"The ten year treasury yield rose today. It didn't make the picture any brighter for yields, except that support held. The steep declining trend is still in play, the RSI is negative and the PMO recently topped below its signal line in very negative territory. There is a high likelihood that this current level of support will not hold. The next solid support level is at 1.0."
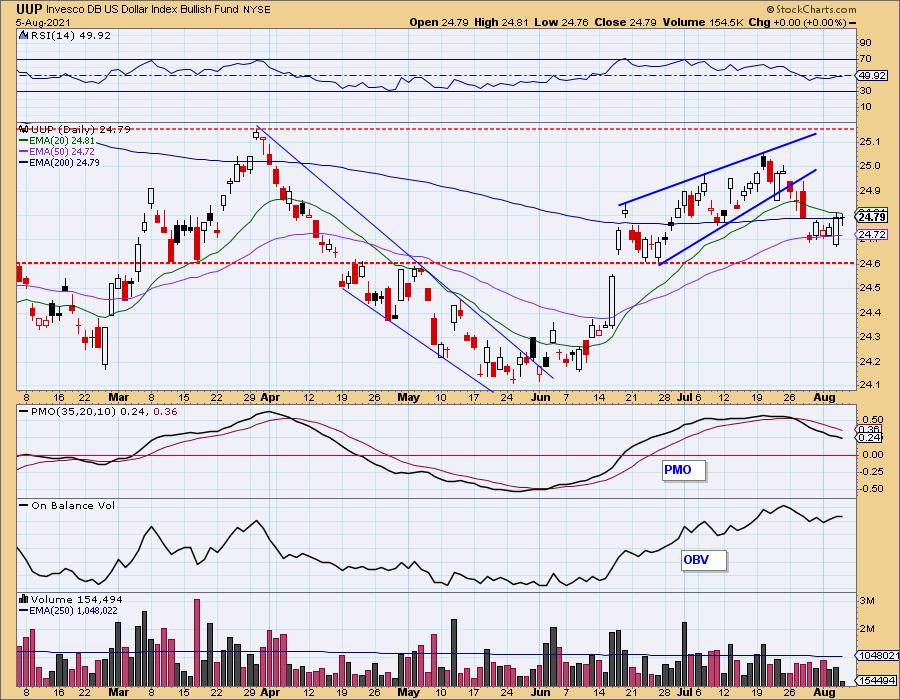
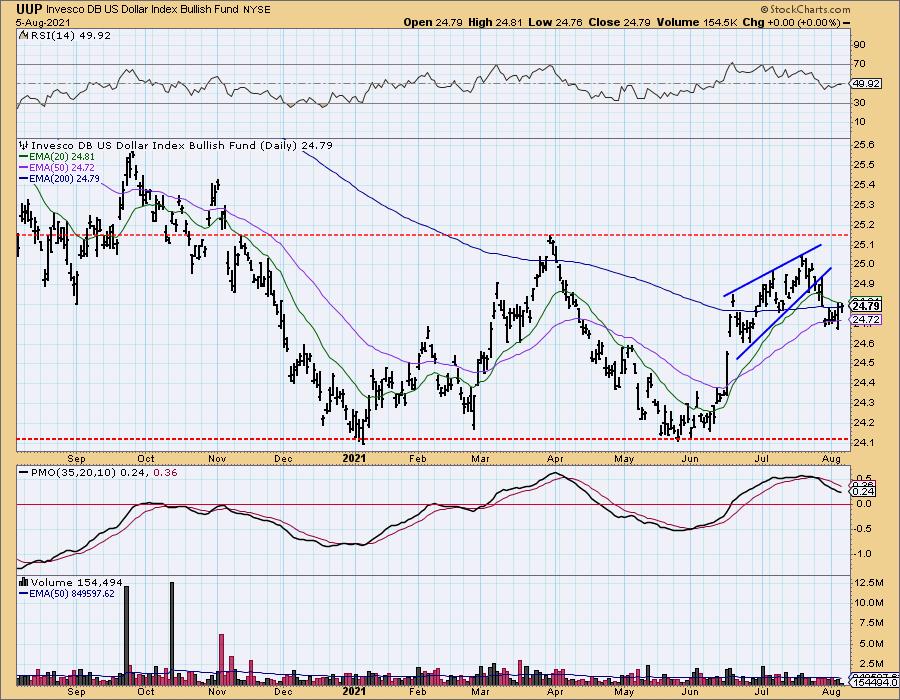
DOLLAR (UUP)
IT Trend Model: BUY as of 6/22/2021
LT Trend Model: SELL as of 7/10/2020
UUP Daily Chart: UUP didn't do much today and closed right on the 200-EMA. The 20-EMA is posing difficult resistance and the RSI is neutral. The PMO continues lower suggesting the 20-EMA will continue to foil price.
GOLD
IT Trend Model: NEUTRAL as of 6/24/2021
LT Trend Model: BUY as of 5/21/2021
GLD Daily Chart: Gold continues to bounce back and forth within a trading range. The RSI hit negative territory. The PMO is still on a BUY signal and we see that the short-term rising bottoms trendline aligns with the bottom of the trading range suggesting we should see a bounce.
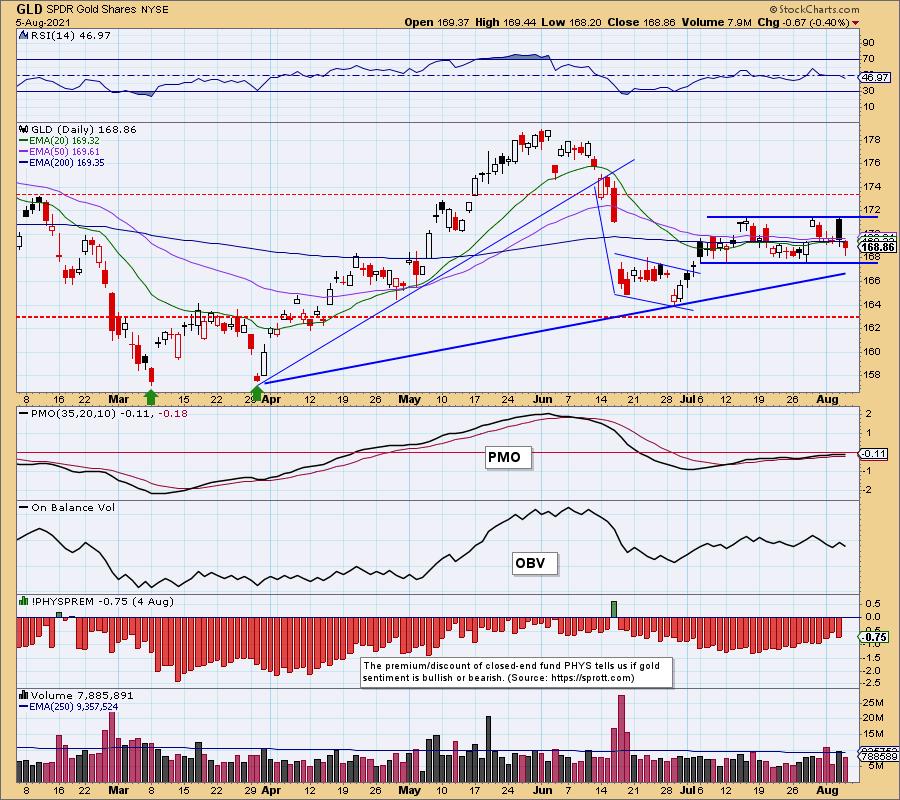
(Full disclosure: I own GLD)
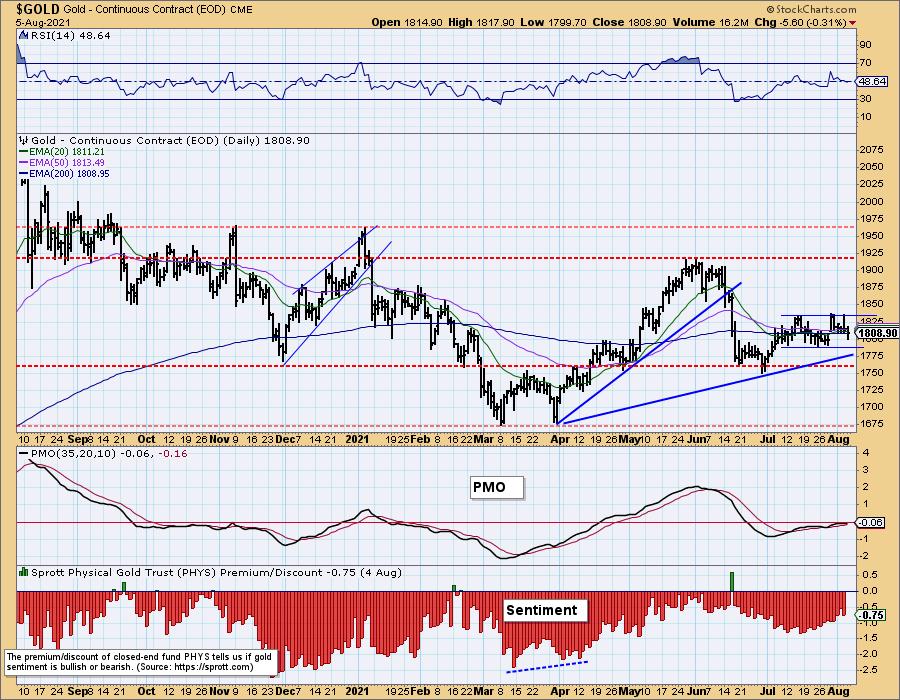
GOLD Daily Chart: The PMO is beginning to look toppy, but this should be expected given price is moving sideways. Discounts are contracting, but that increasing bullish sentiment hasn't translated into a rally.
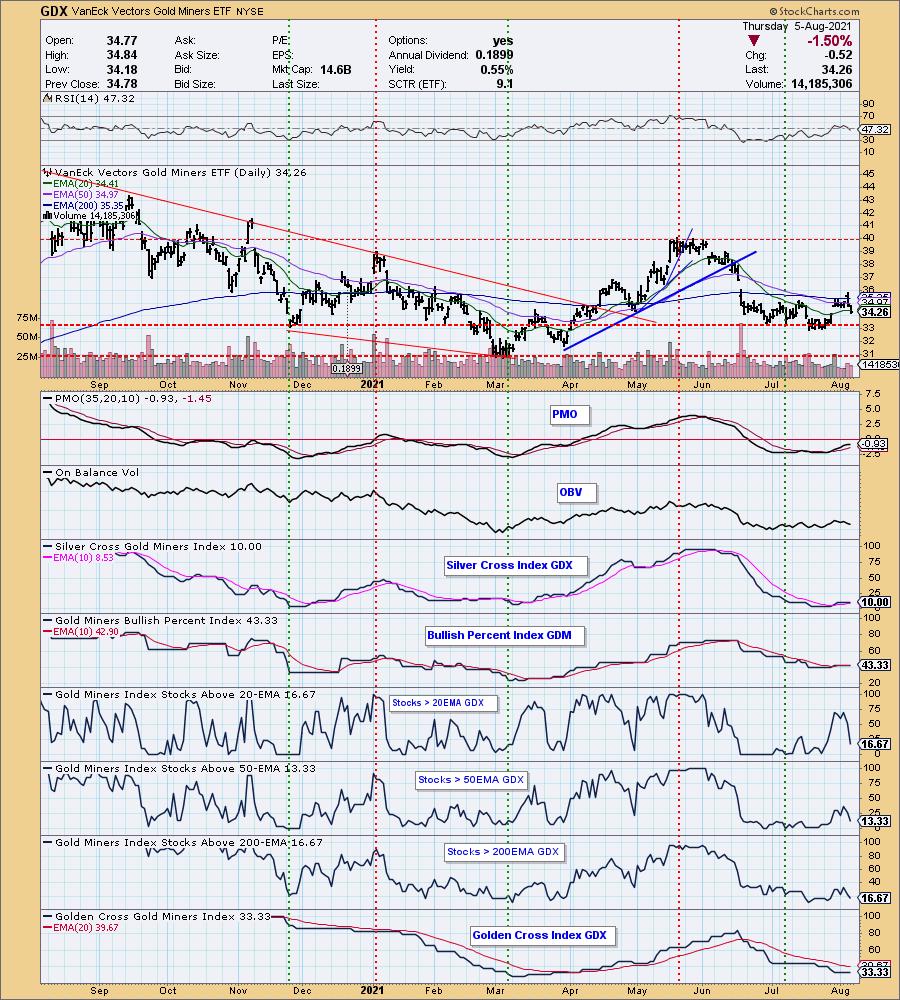
GOLD MINERS Golden and Silver Cross Indexes: Gold Miners pulled way back today. Significant damage was done to participation tarnishing my bullish outlook on this group. With the spotlight on Semiconductors, Software and Biotechs, this group has definitely lost its shine.
CRUDE OIL (USO)
IT Trend Model: BUY as of 11/23/2020
LT Trend Model: BUY as of 3/9/2021
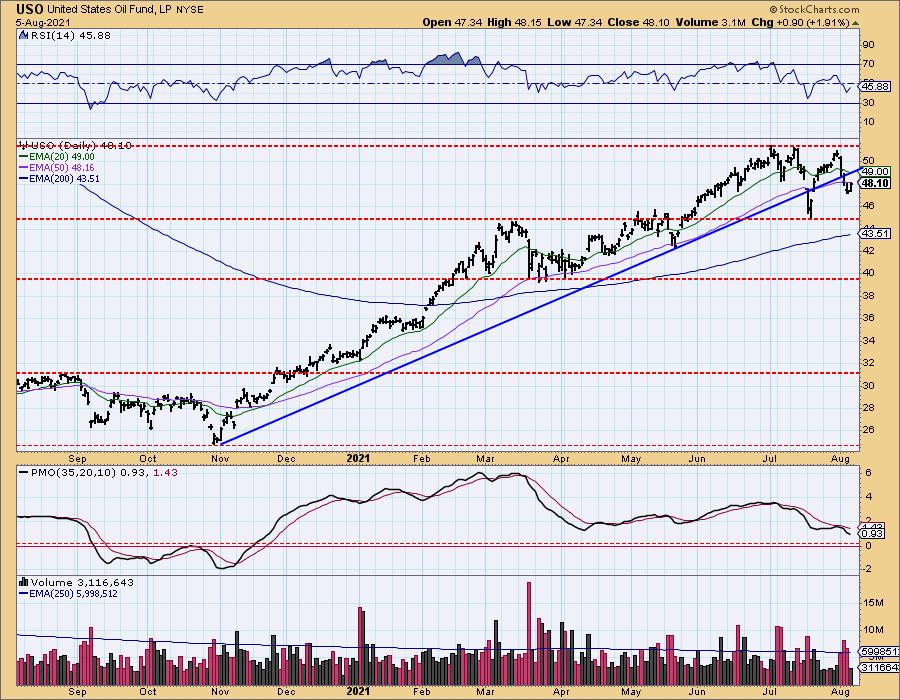
USO Daily Chart: Oil rallied today but didn't manage a break above the 50-EMA. However, if this bottom stays in place, that would be very bullish given the short-term rising bottoms trendline was not tested.
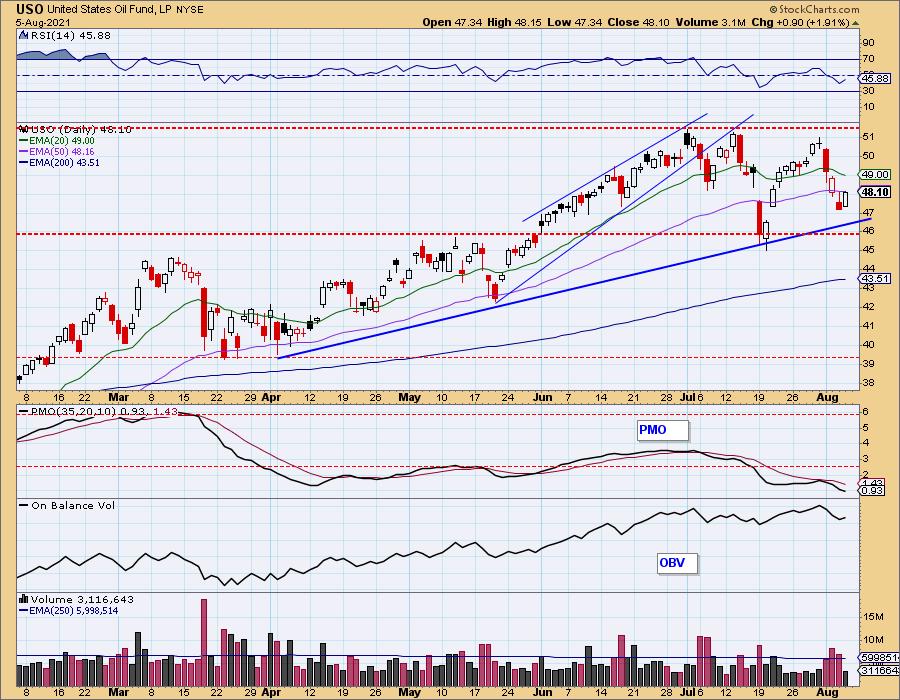
The intermediate-term rising bottoms trendline hasn't been recaptured yet. The PMO top below the signal line does still give the chart a bearish pallor.
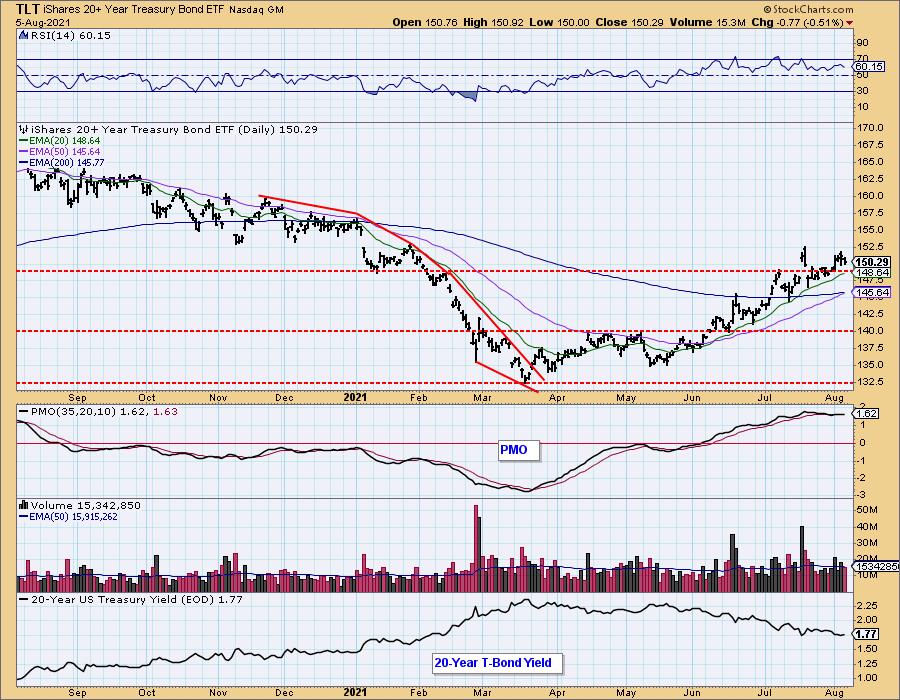
BONDS (TLT)
IT Trend Model: BUY as of 6/10/2021
LT Trend Model: SELL as of 1/8/2021
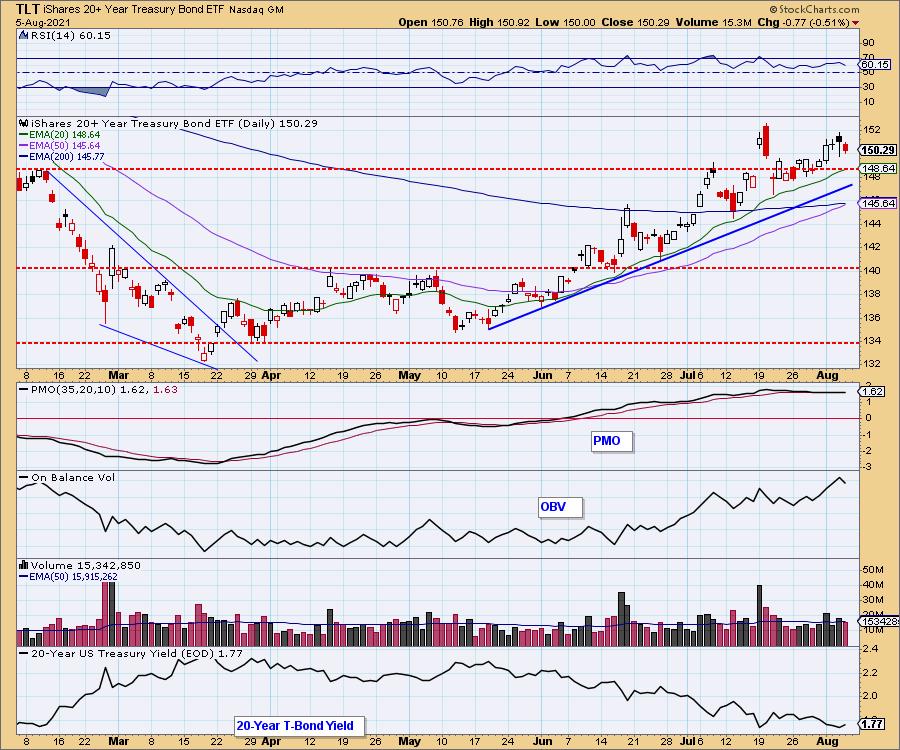
TLT Daily Chart: The PMO whipsawed again and is now on a crossover SELL signal. Not too helpful. Overall the rising trend is intact and we have a LT Trend Model BUY signal on tap for tomorrow or early next week as the 50-EMA is about to cross above the 200-EMA.
Technical Analysis is a windsock, not a crystal ball.
--Erin Swenlin
(c) Copyright 2021 DecisionPoint.com
Disclaimer: This blog is for educational purposes only and should not be construed as financial advice. The ideas and strategies should never be used without first assessing your own personal and financial situation, or without consulting a financial professional. Any opinions expressed herein are solely those of the author, and do not in any way represent the views or opinions of any other person or entity.
NOTE: The signal status reported herein is based upon mechanical trading model signals, specifically, the DecisionPoint Trend Model. They define the implied bias of the price index based upon moving average relationships, but they do not necessarily call for a specific action. They are information flags that should prompt chart review. Further, they do not call for continuous buying or selling during the life of the signal. For example, a BUY signal will probably (but not necessarily) return the best results if action is taken soon after the signal is generated. Additional opportunities for buying may be found as price zigzags higher, but the trader must look for optimum entry points. Conversely, exit points to preserve gains (or minimize losses) may be evident before the model mechanically closes the signal.
Helpful DecisionPoint Links:
DecisionPoint Alert Chart List
DecisionPoint Golden Cross/Silver Cross Index Chart List
DecisionPoint Sector Chart List
Price Momentum Oscillator (PMO)
Swenlin Trading Oscillators (STO-B and STO-V)
DecisionPoint is not a registered investment advisor. Investment and trading decisions are solely your responsibility. DecisionPoint newsletters, blogs or website materials should NOT be interpreted as a recommendation or solicitation to buy or sell any security or to take any specific action.