
A reader wrote to me and expressed his frustration with the SPY PMO bouncing from a PMO BUY to SELL to BUY, etc. He told me that he wishes to make money trading the SPY and he uses the DP Alert to help with that. In his mind, it hasn't been so helpful.
I completely understand his frustration and I told him that when the market gets flat, the PMO will do this back and forth movement. The indicators have been mixed for some time now as well. I feel you. Ultimately I told him that trying to make money trading the SPY is simply not going to get you anywhere right now. There are pockets of strength in the market, they just need to be uncovered. Not to be sales-y, but that is what I do in the DP Diamonds Report.
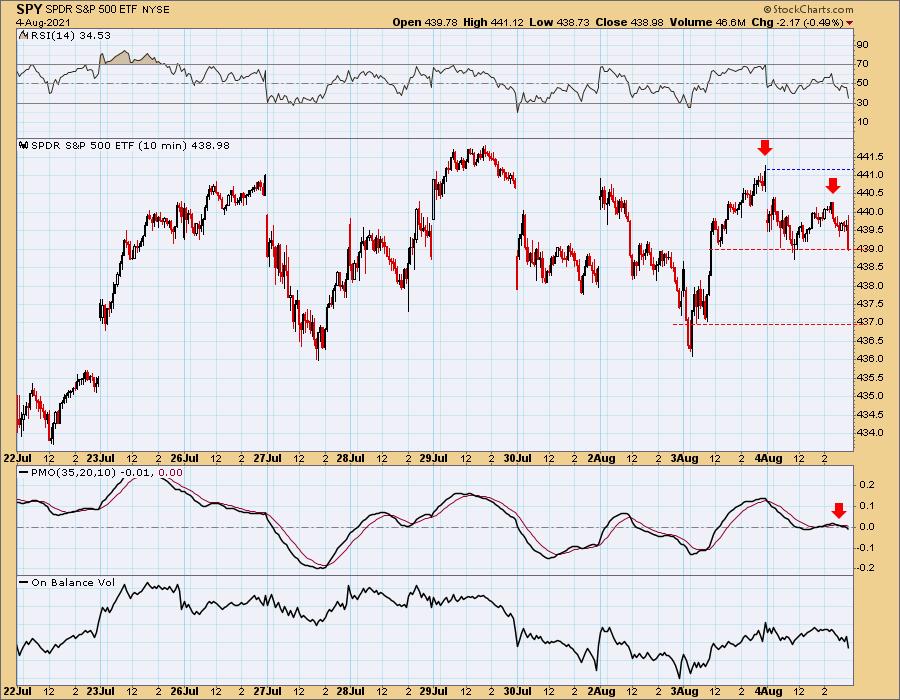
Today's 10-minute candlestick chart shows us the problem with the SPY; it's range bound. Looking at this intraday chart of the SPY, it suggests the SPY will be making its way back down toward the bottom of the current trading range. There is a double-top that formed today and the late day PMO crossover SELL signal suggest lower prices tomorrow. Interestingly, the minimum downside target of the double-top takes price to support at the bottom of the range.
The DecisionPoint Alert Weekly Wrap presents an end-of-week assessment of the trend and condition of the Stock Market, the U.S. Dollar, Gold, Crude Oil, and Bonds. The DecisionPoint Alert daily report (Monday through Thursday) is abbreviated and gives updates on the Weekly Wrap assessments.
Watch the latest episode of DecisionPoint on StockCharts TV's YouTube channel here!
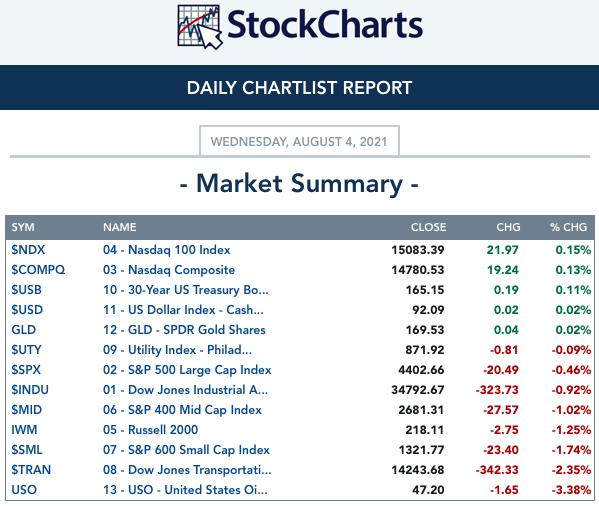
MAJOR MARKET INDEXES
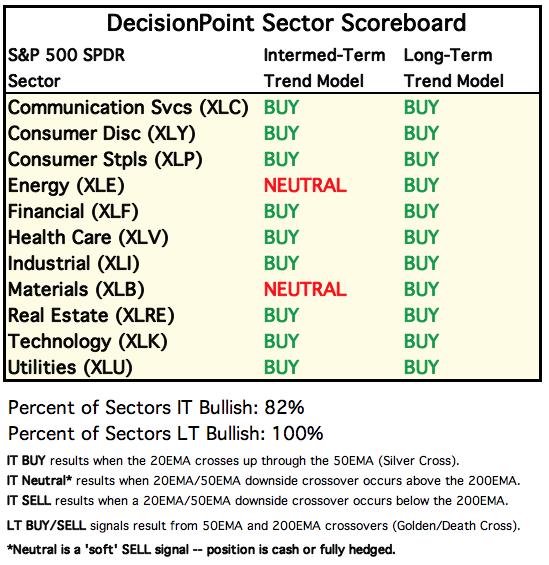
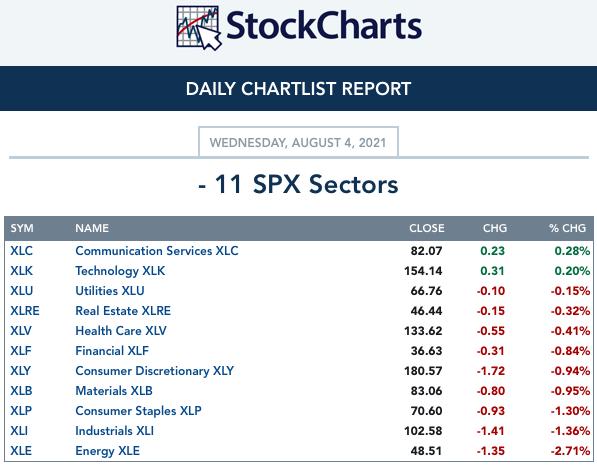
SECTORS
Each S&P 500 Index component stock is assigned to one, and only one, of 11 major sectors. This is a snapshot of the Intermediate-Term (Silver Cross) and Long-Term (Golden Cross) Trend Model signal status for those sectors.
RRG® Chart: The three sectors that are traveling with the northeast heading are XLE (still not liking it though), XLB, XLU and XLV. Concentrating on these sectors should keep you ahead of the market.
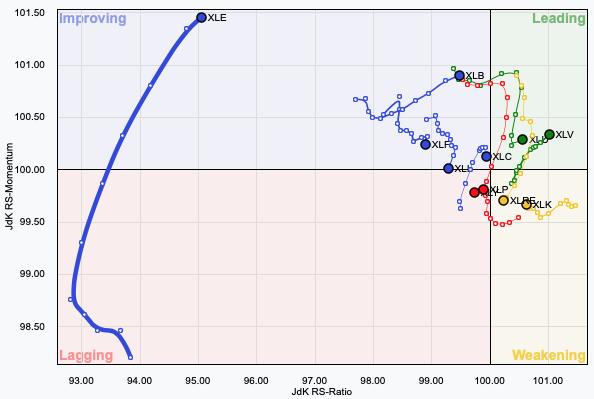
CLICK HERE for an animated version of the RRG chart.
CLICK HERE for Carl's annotated Sector charts.
THE MARKET (S&P 500)
IT Trend Model: BUY as of 5/8/2020
LT Trend Model: BUY as of 6/8/2020
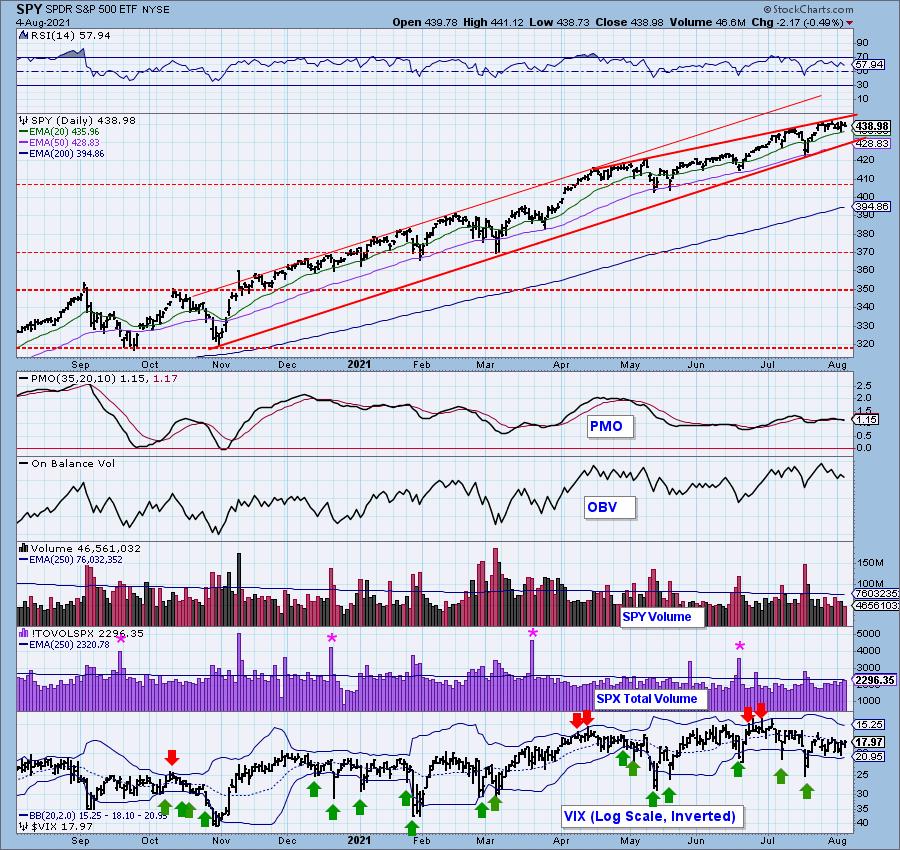
SPY Daily Chart: The PMO is back on a SELL signal. The RSI is positive. We saw an increase in Total Volume today on the decline which confirms my analysis of the 10-minute candlestick.

The 20-EMA is still holding as support and we get the decline to the bottom of the recent trading range, it should still hold.
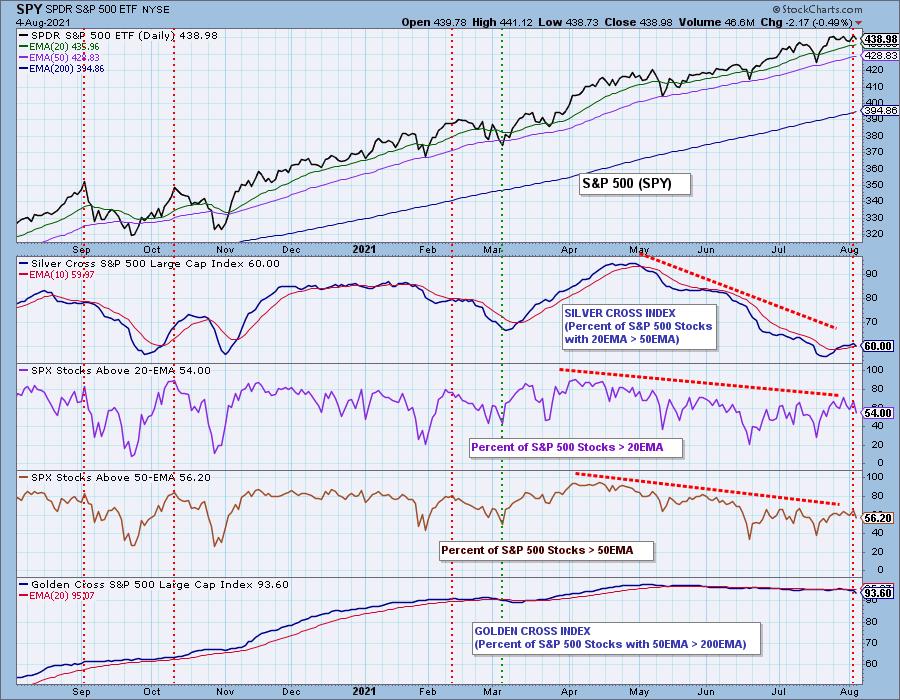
Participation: The following chart uses different methodologies for objectively showing the depth and trend of participation for intermediate- and long-term time frames.
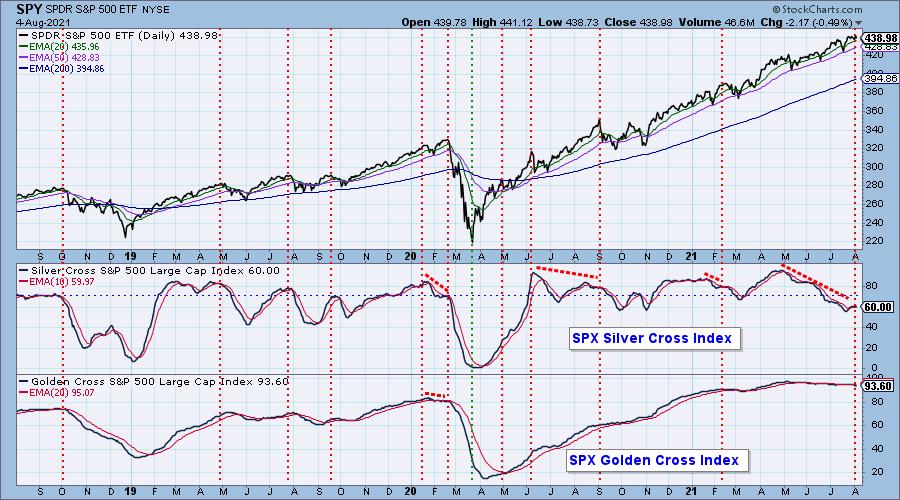
- The Silver Cross Index (SCI) shows the percentage of SPX stocks on IT Trend Model BUY signals (20-EMA > 50-EMA).
- The Golden Cross Index (GCI) shows the percentage of SPX stocks on LT Trend Model BUY signals (50-EMA > 200-EMA).
- The Bullish Percent Index (BPI) shows the percentage of SPX stocks on Point & Figure BUY signals.
The SCI topped as it lost a little more than a percentage point. The GCI is meandering very slowly lower. Neither of these suggest a breakout anytime soon.
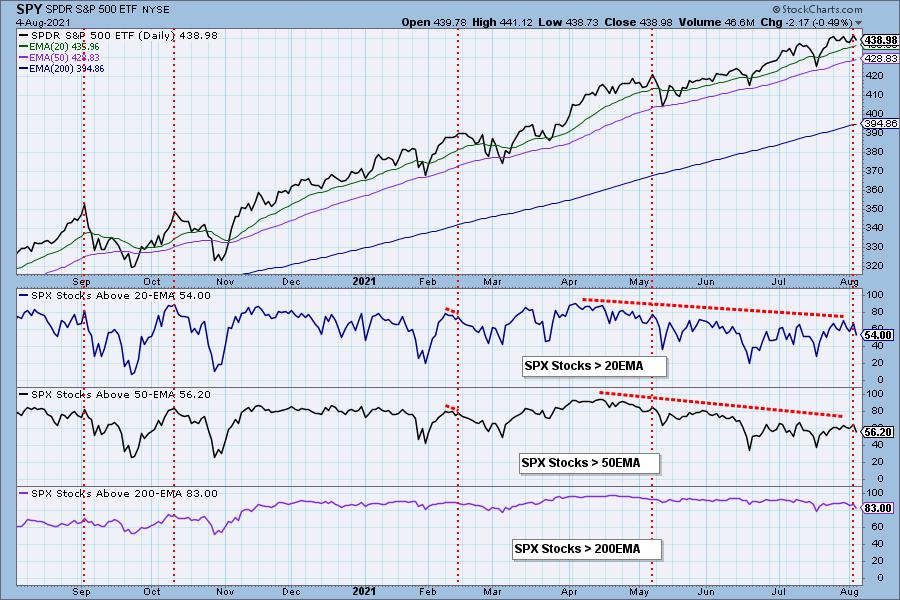
We saw some damage to participation. Just a little more than half of the SPX have price above their 20-EMA.
Climax Analysis: No climax today although we came close on Net A-D. I noticed that the NYSE Volume Ratio also showed elevated Down/Up Volume. This could be signaling an initiation to lower prices, but at this point I'm only looking for a test of the 20-EMA. The VIX continues to oscillate mostly below its EMA on the inverted scale, so there are still some nervous investors out there, just not enough to suggest an upside reversal.
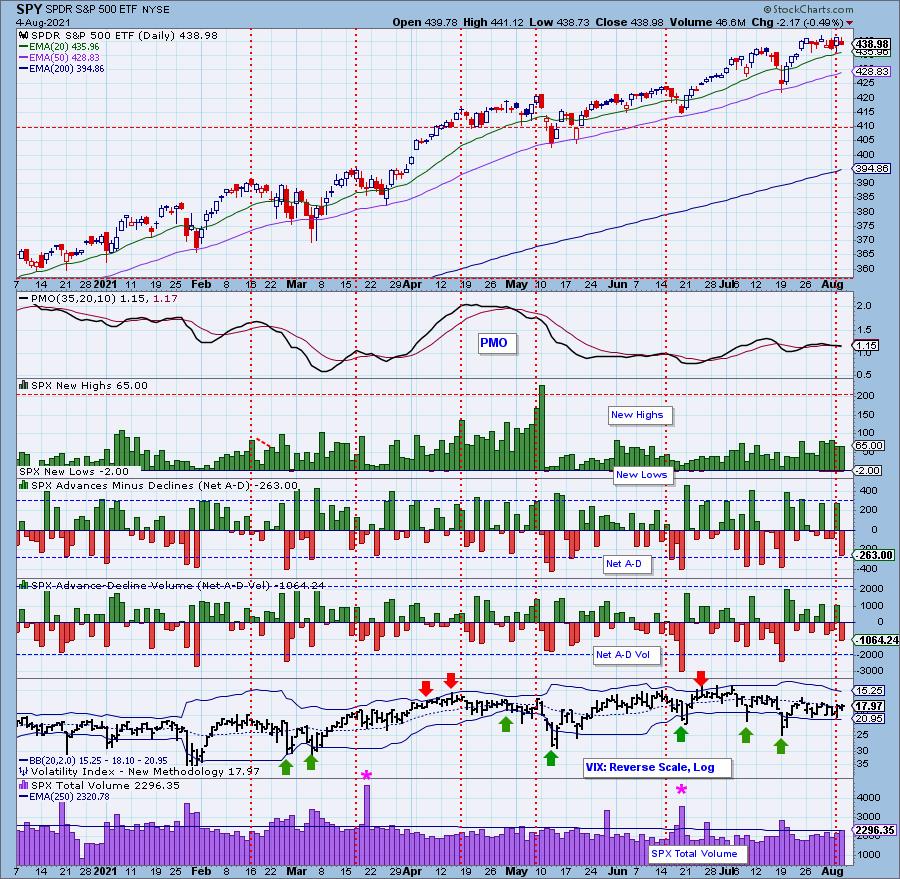
Short-Term Market Indicators: The short-term market trend is NEUTRAL and the condition is NEUTRAL.
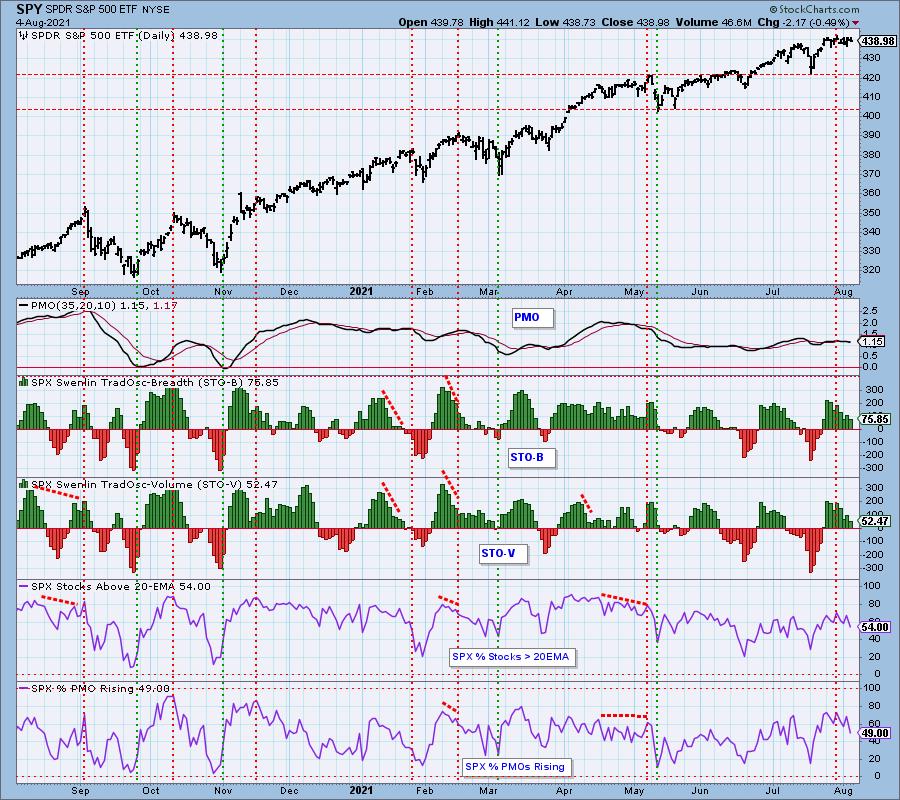
The STOs turned back down solidifying their declining trend. They are sitting in neutral which isn't too helpful, but the overall declining trend does tell me not to expect new all-time highs. We saw more stocks lose positive momentum. Less than half now have rising PMOs.
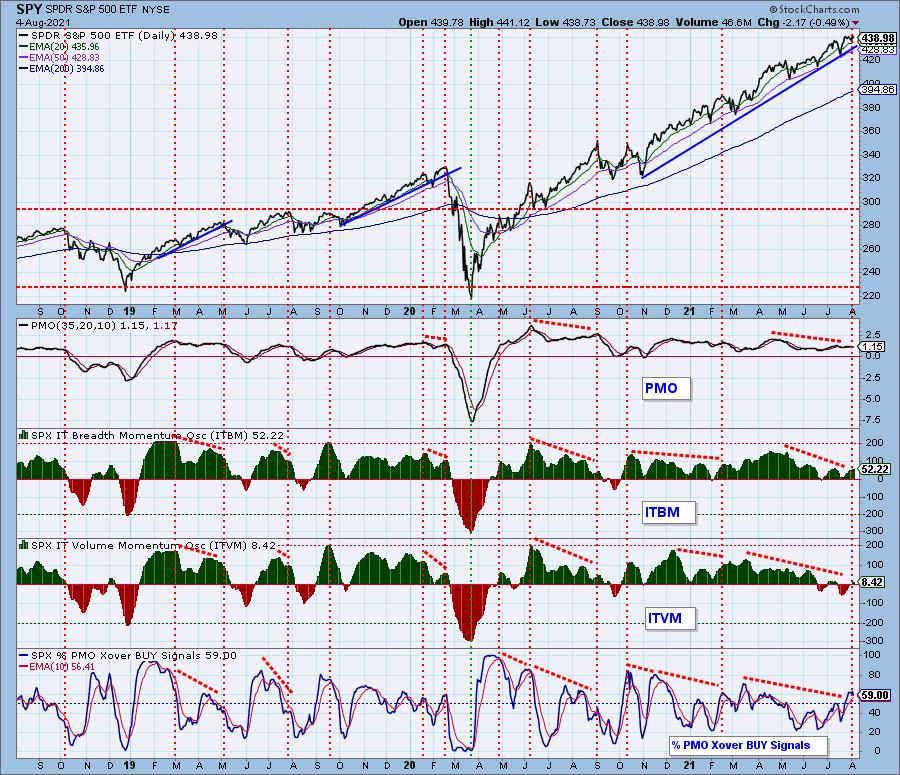
Intermediate-Term Market Indicators: The intermediate-term market trend is UP and the condition is NEUTRAL.
IT indicators were mostly unchanged although the ITBM did move slightly downward today. If they turn, they are technically in near-term overbought territory. We saw the pullback in mid-July when the ITBM/ITVM turned back down.
Bias Assessment: We've added this new section called "bias assessment". It occurred to me that one of the ways we can measure market bias is to compare the SCI to the percent of stocks above their 20/50-EMAs. When the percentages are lower than the SCI, the market bias is bearish and if they are higher, it is bullish. Any "mechanical" signal requires additional analysis to confirm the numbers.
With the SCI turning lower and participation seeing damage, the bias is moving bearish again in the very short term. Anytime the SCI turns down and that is accompanied by a decline in participation, we should exercise caution.
CONCLUSION: The SPY is moving sideways. Indicators are beginning to shift negatively to the downside. With the increase in volume on selling today and the bearish 10-minute chart, I would expect lower prices tomorrow. As noted in the opening, I don't believe there is much money to be made trading the SPY. It is likely going to continue to chop around sideways with a possible trip down to the 50-EMA. I don't think it will fall completely apart yet, but the IT indicators are starting to shift into bearish gear so it isn't out of the question.
I remain 50% exposed to the market.
Have you subscribed the DecisionPoint Diamonds yet? DP does the work for you by providing handpicked stocks/ETFs from exclusive DP scans! Add it with a discount! Contact support@decisionpoint.com for more information!
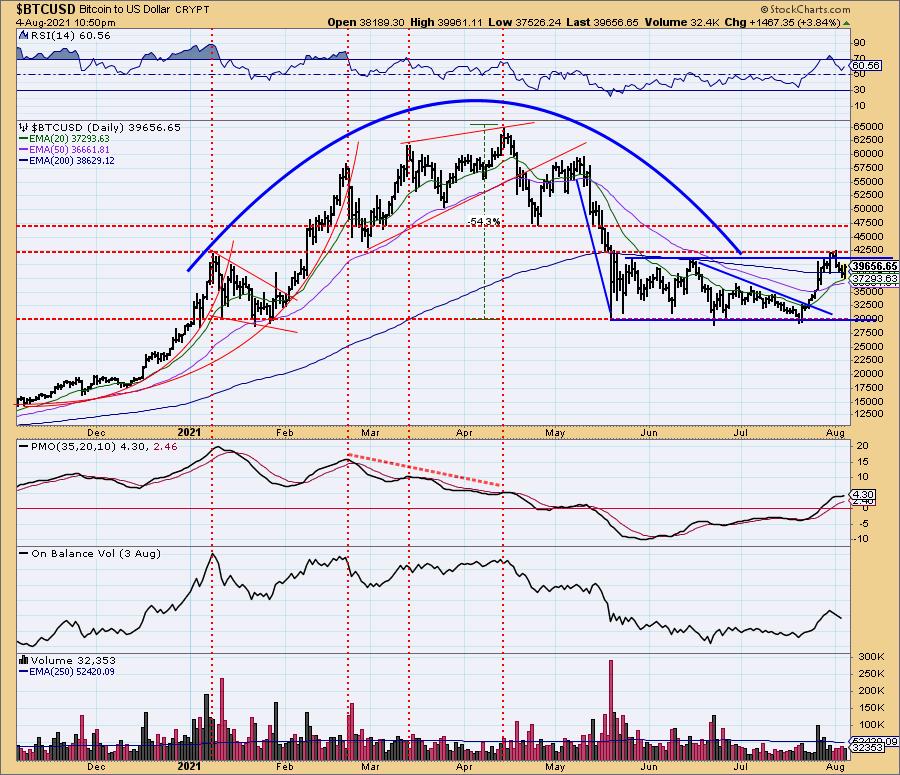
BITCOIN
Bitcoin is moving higher today after bouncing off support at the 20-EMA. The RSI remains positive, but the PMO is flat and we did see volume on yesterday's selling. I wouldn't look for a breakout here.
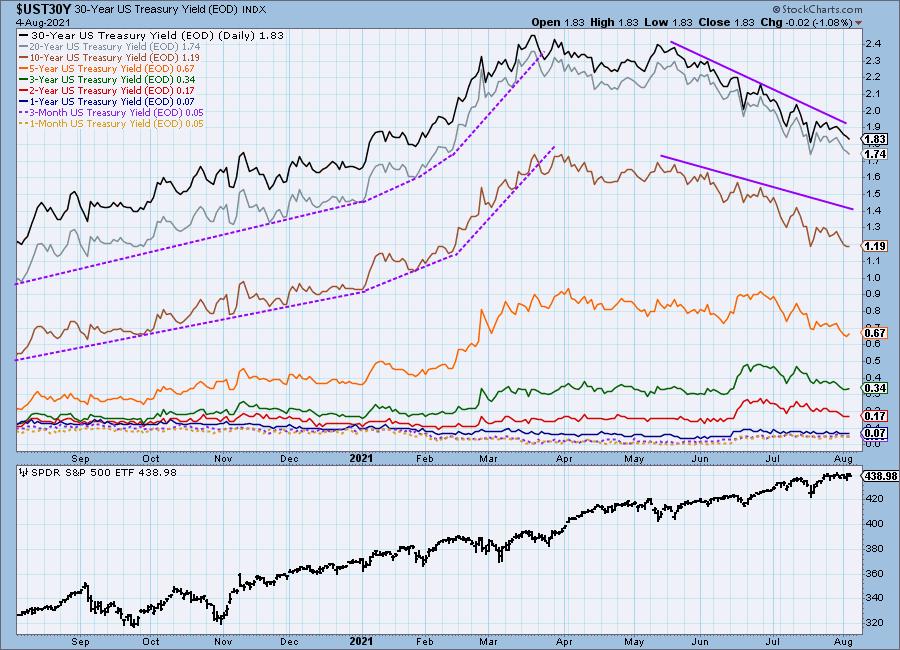
INTEREST RATES
Longer-term rates are continuing in their declining trend.
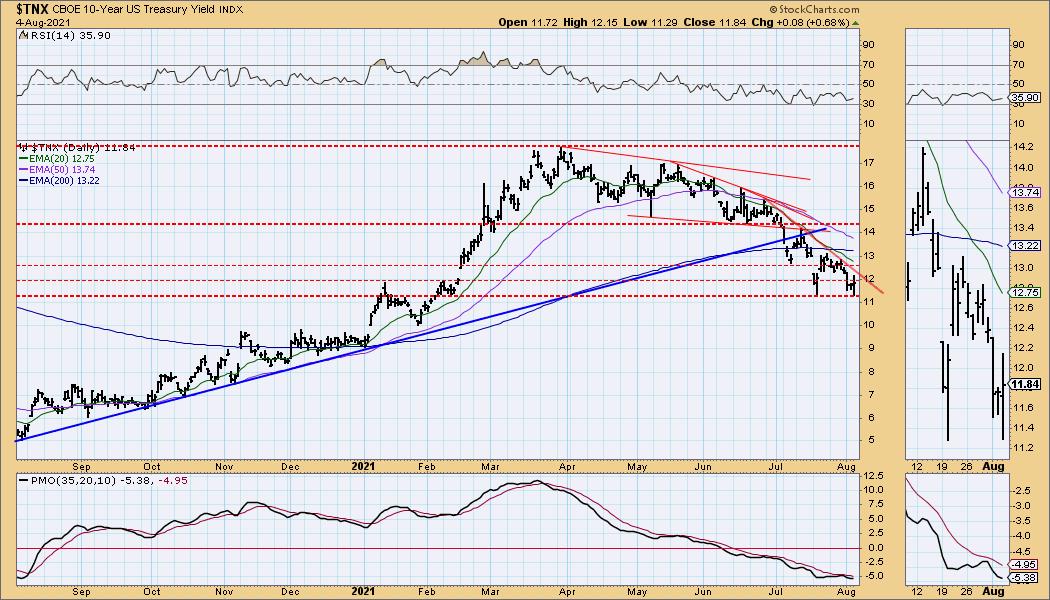
10-YEAR T-BOND YIELD
Yesterday's comments still apply:
"The ten year treasury yield rose today. It didn't make the picture any brighter for yields, except that support held. The steep declining trend is still in play, the RSI is negative and the PMO recently topped below its signal line in very negative territory. There is a high likelihood that this current level of support will not hold. The next solid support level is at 1.0."
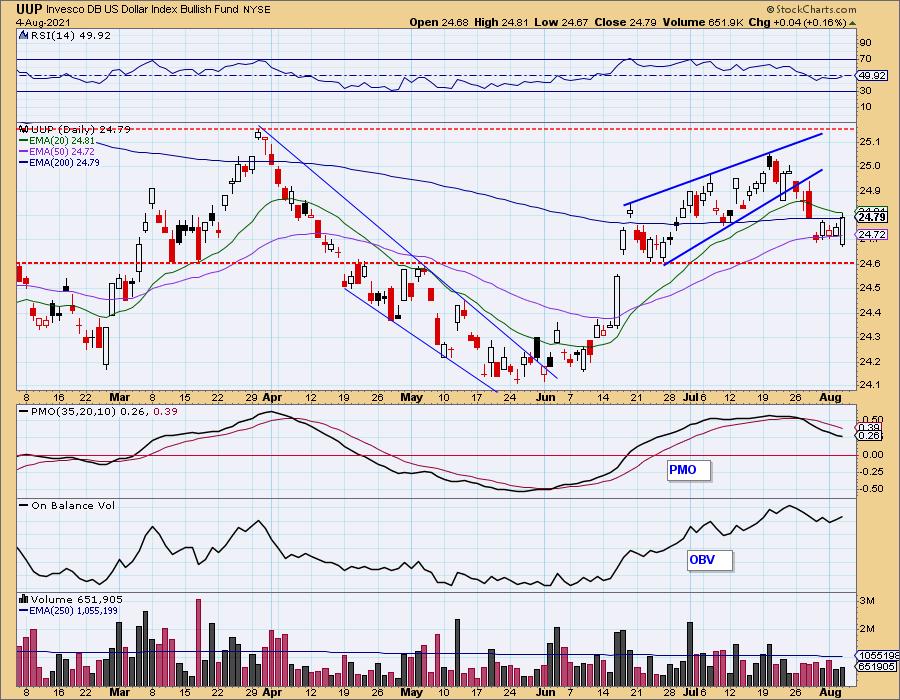
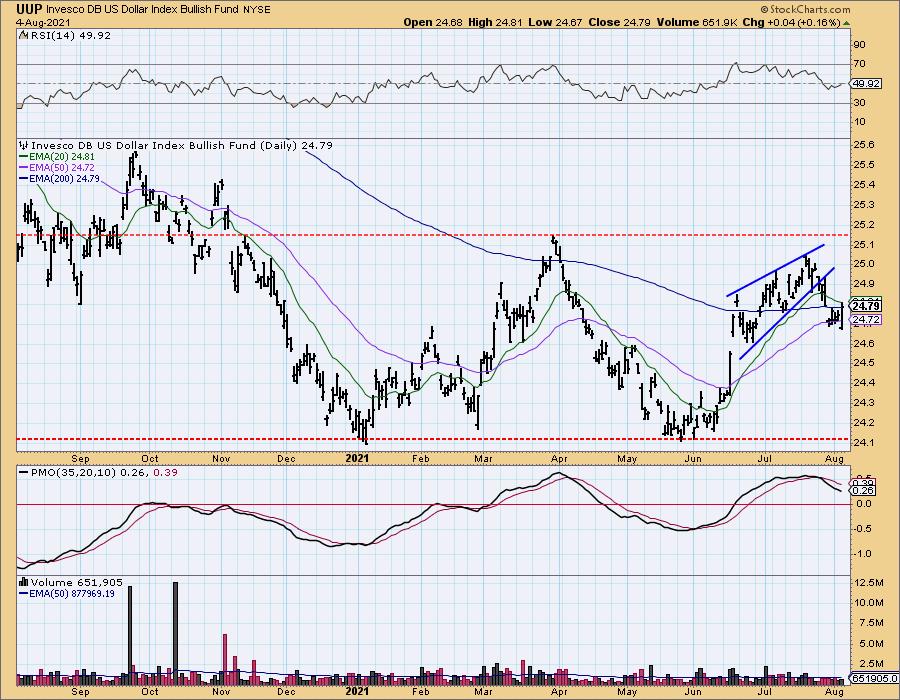
DOLLAR (UUP)
IT Trend Model: BUY as of 6/22/2021
LT Trend Model: SELL as of 7/10/2020
UUP Daily Chart: UUP is sporting a bullish engulfing candlestick. It dipped its toes below the 50-EMA but overall it is still holding above it. It didn't manage to overcome resistance at the 20 and 200-EMAs. The PMO is still declining and the RSI, while rising, is still in negative territory. The candlestick suggests higher prices tomorrow. If we get a nice breakout above the 20-EMA, I'll move from my bearish stance on the Dollar.
GOLD
IT Trend Model: NEUTRAL as of 6/24/2021
LT Trend Model: BUY as of 5/21/2021
GLD Daily Chart: We have a big black candlestick which tells us that GLD rallied significantly but then took nearly all of it back. It still closed above the 20 and 200-EMAs. Overhead resistance is clearly strong at the top of the current trading range.
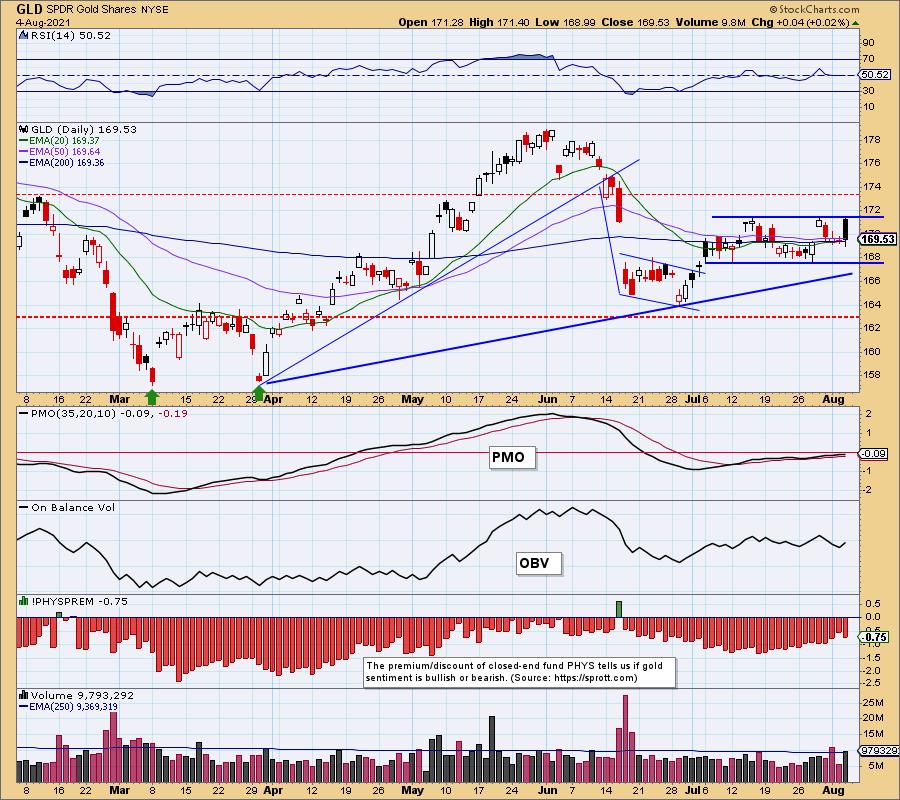
(Full disclosure: I own GLD)
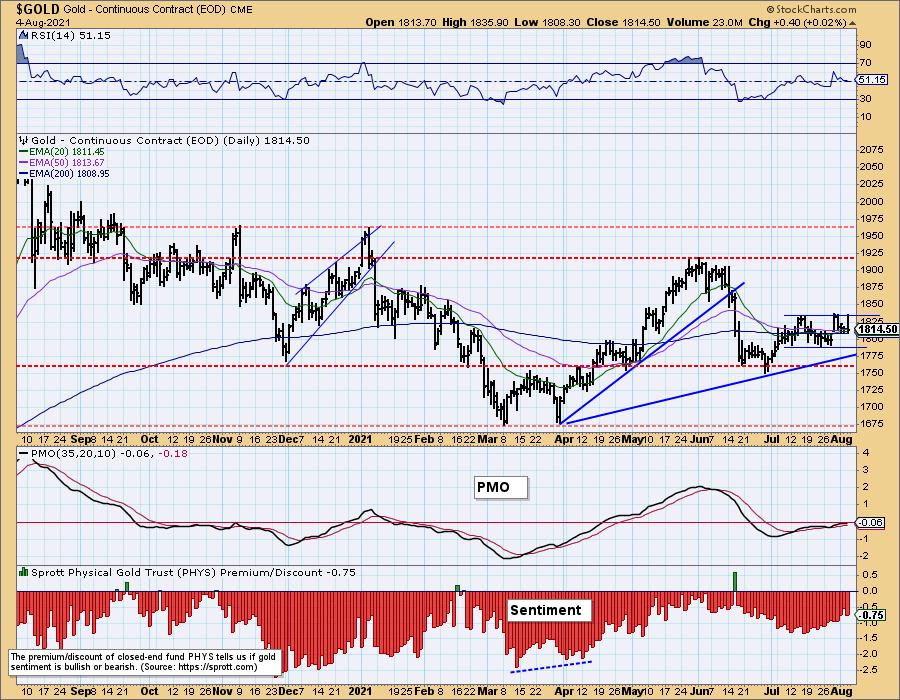
GOLD Daily Chart: The PMO is still rising and the RSI is positive (not by much), but clearly Gold is range-bound. There aren't enough bullish characteristics on this chart to suggest a breakout, but it isn't quite bearish enough to look for a breakdown below the trading range. Like the SPY, we are likely to see more sideways movement.
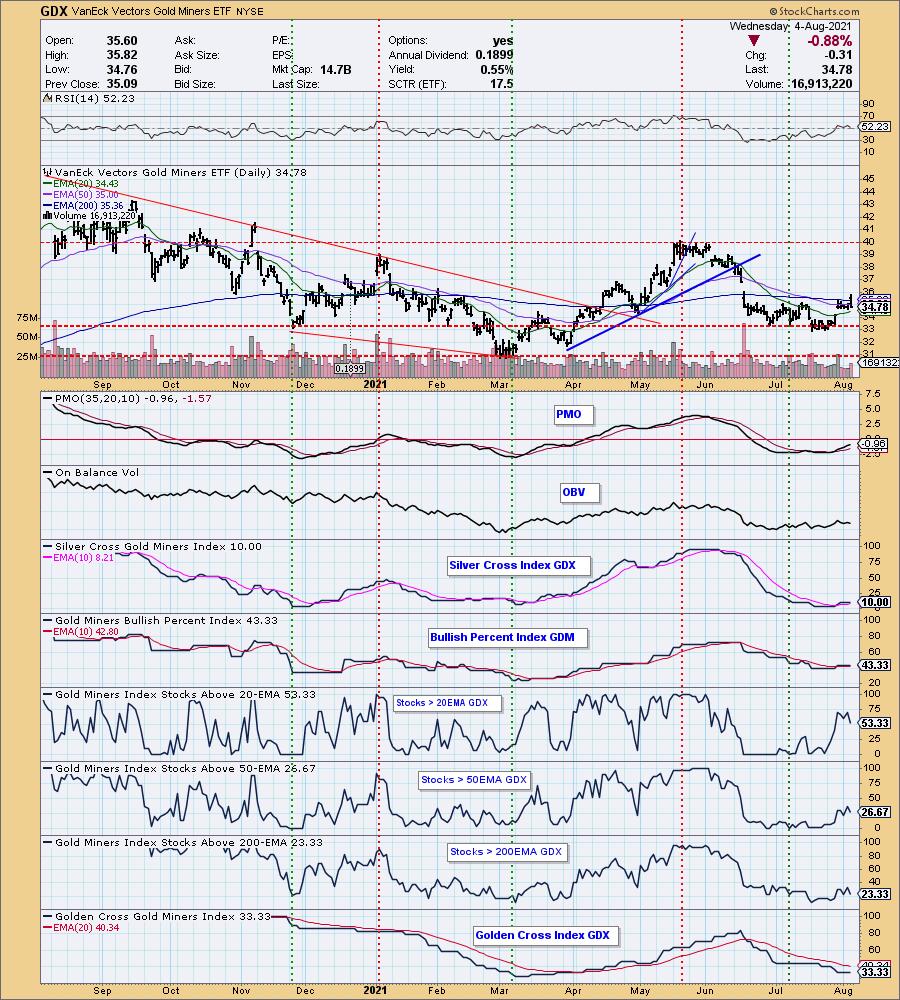
GOLD MINERS Golden and Silver Cross Indexes: Gold Miners pulled back but I can tell you that there were a few Gold Miners that rallied strongly today including AGI and AUY. I never like to see price finish on its lows, but price is holding above the 20-EMA and today price did venture above the 200-EMA. Participation fell back slightly, but I still see a bullish bias given the SCI is at 10% and participation numbers are much higher. The rising PMO also suggests a breakout for GDX ahead.
CRUDE OIL (USO)
IT Trend Model: BUY as of 11/23/2020
LT Trend Model: BUY as of 3/9/2021
USO Daily Chart: Yesterday's comments still apply:
"The drop in Crude Oil continues. [Yesterday] USO closed below the 50-EMA. The RSI is now in negative territory and the PMO top below the signal line looks ominous. I believe the short-term rising bottoms trendline will continue to hold; the problem is that it still requires a lot more downside to reach it."
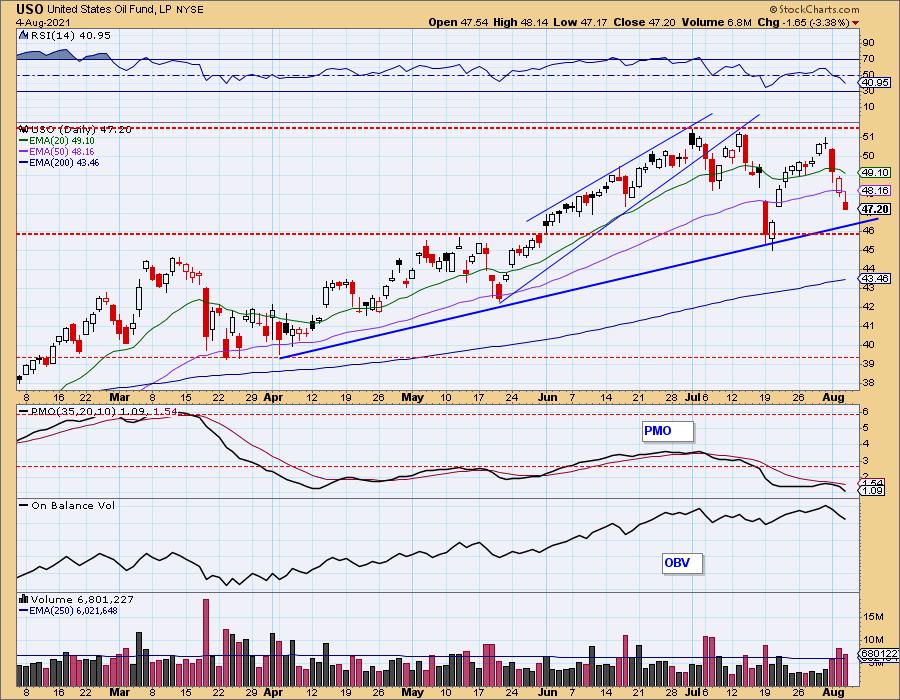
"The intermediate-term rising bottoms trendline has been breached with today's decline. Lower prices seem inevitable."

BONDS (TLT)
IT Trend Model: BUY as of 6/10/2021
LT Trend Model: SELL as of 1/8/2021
TLT Daily Chart: The PMO whipsawed back into a crossover BUY signal. The rally continues for long-term Bonds as yields continue to drop.
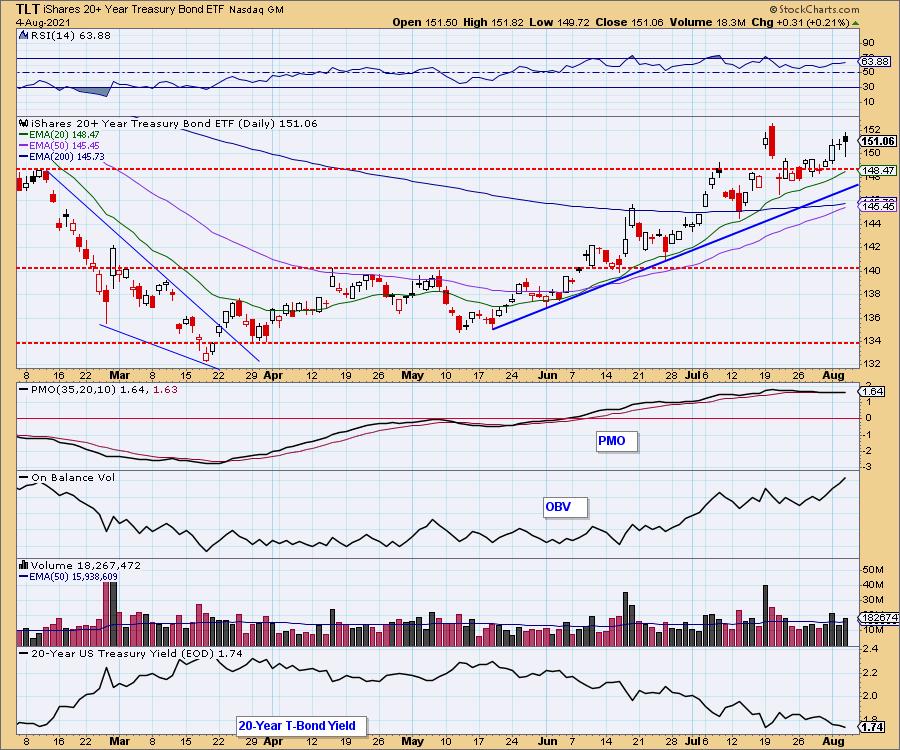
A new LT Trend Model BUY signal is on tap and the price is now staying above support at the January low. Until yields break their declining trend, TLT will be continue to be a good place to hide out.
Technical Analysis is a windsock, not a crystal ball.
--Erin Swenlin
(c) Copyright 2021 DecisionPoint.com
Disclaimer: This blog is for educational purposes only and should not be construed as financial advice. The ideas and strategies should never be used without first assessing your own personal and financial situation, or without consulting a financial professional. Any opinions expressed herein are solely those of the author, and do not in any way represent the views or opinions of any other person or entity.
NOTE: The signal status reported herein is based upon mechanical trading model signals, specifically, the DecisionPoint Trend Model. They define the implied bias of the price index based upon moving average relationships, but they do not necessarily call for a specific action. They are information flags that should prompt chart review. Further, they do not call for continuous buying or selling during the life of the signal. For example, a BUY signal will probably (but not necessarily) return the best results if action is taken soon after the signal is generated. Additional opportunities for buying may be found as price zigzags higher, but the trader must look for optimum entry points. Conversely, exit points to preserve gains (or minimize losses) may be evident before the model mechanically closes the signal.
Helpful DecisionPoint Links:
DecisionPoint Alert Chart List
DecisionPoint Golden Cross/Silver Cross Index Chart List
DecisionPoint Sector Chart List
Price Momentum Oscillator (PMO)
Swenlin Trading Oscillators (STO-B and STO-V)
DecisionPoint is not a registered investment advisor. Investment and trading decisions are solely your responsibility. DecisionPoint newsletters, blogs or website materials should NOT be interpreted as a recommendation or solicitation to buy or sell any security or to take any specific action.