
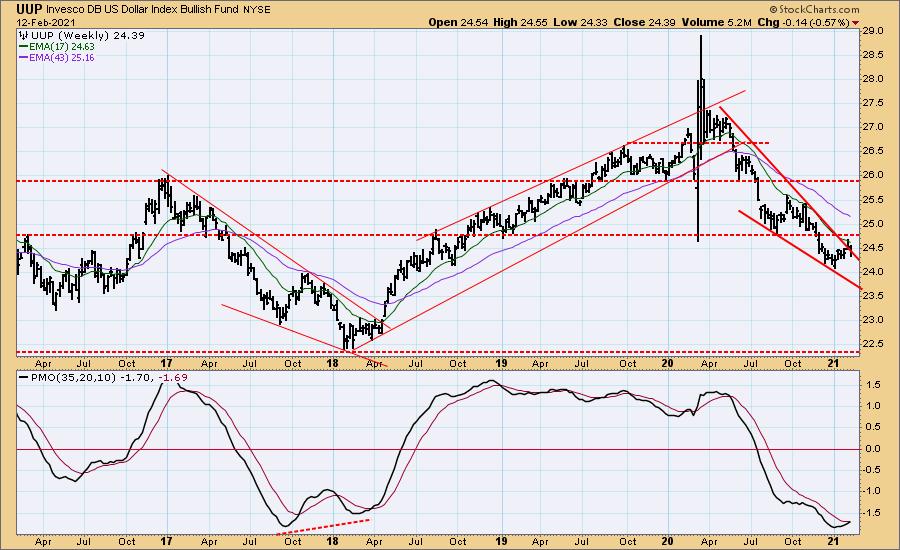
Today's lead story is that the Dollar (UUP) triggered a new weekly PMO BUY signal. Looking at the weekly chart, it had appeared last week that we would see a continuation of the breakout from the bullish falling wedge. Instead, it sunk back within it. More than likely this weekly PMO BUY signal is late to the game. However, it does suggest this falling wedge will see an upside resolution. Given the likelihood of more money being printed for stimulus etc, a reversal could prove difficult.
The DecisionPoint Alert Weekly Wrap presents an end-of-week assessment of the trend and condition of the Stock Market, the U.S. Dollar, Gold, Crude Oil, and Bonds. The DecisionPoint Alert daily report (Monday through Thursday) is abbreviated and gives updates on the Weekly Wrap assessments.
Watch the latest episode of DecisionPoint on StockCharts TV's YouTube channel here!
MAJOR MARKET INDEXES
For Friday: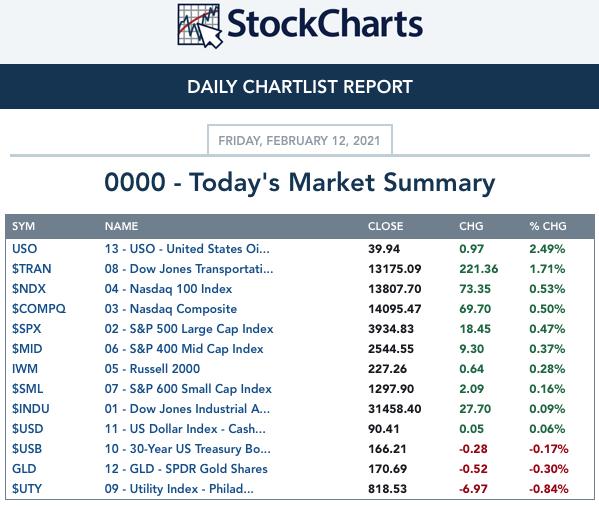
For the week: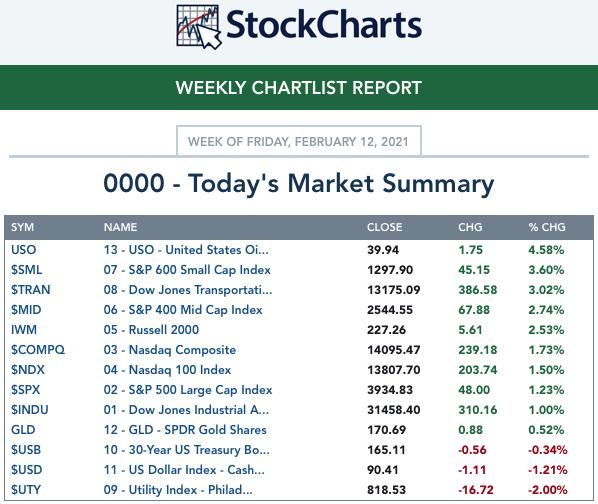
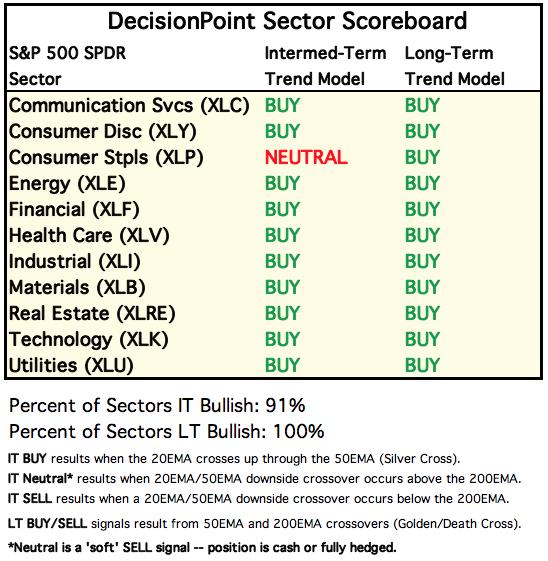
SECTORS
Each S&P 500 Index component stock is assigned to one, and only one, of 11 major sectors. This is a snapshot of the Intermediate-Term (Silver Cross) and Long-Term (Golden Cross) Trend Model signal status for those sectors.
For Today: 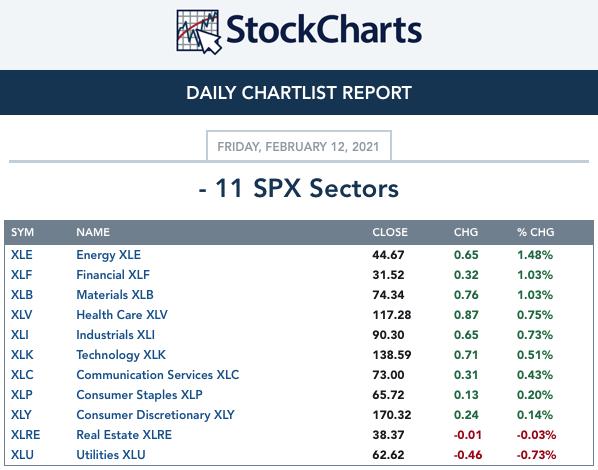
For the Week: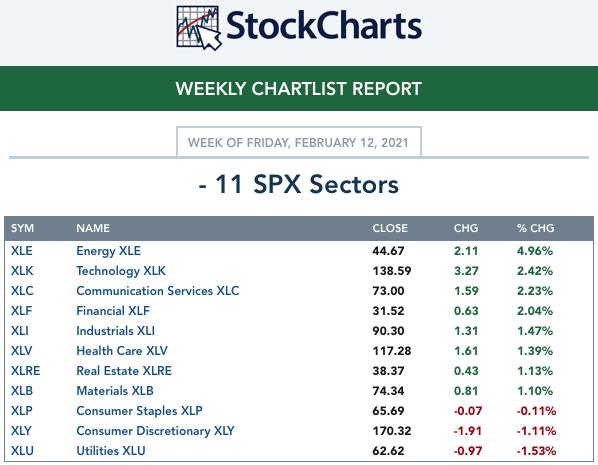
CLICK HERE for Carl's annotated Sector charts.
THE MARKET (S&P 500)
IT Trend Model: BUY as of 5/8/2020
LT Trend Model: BUY as of 6/8/2020
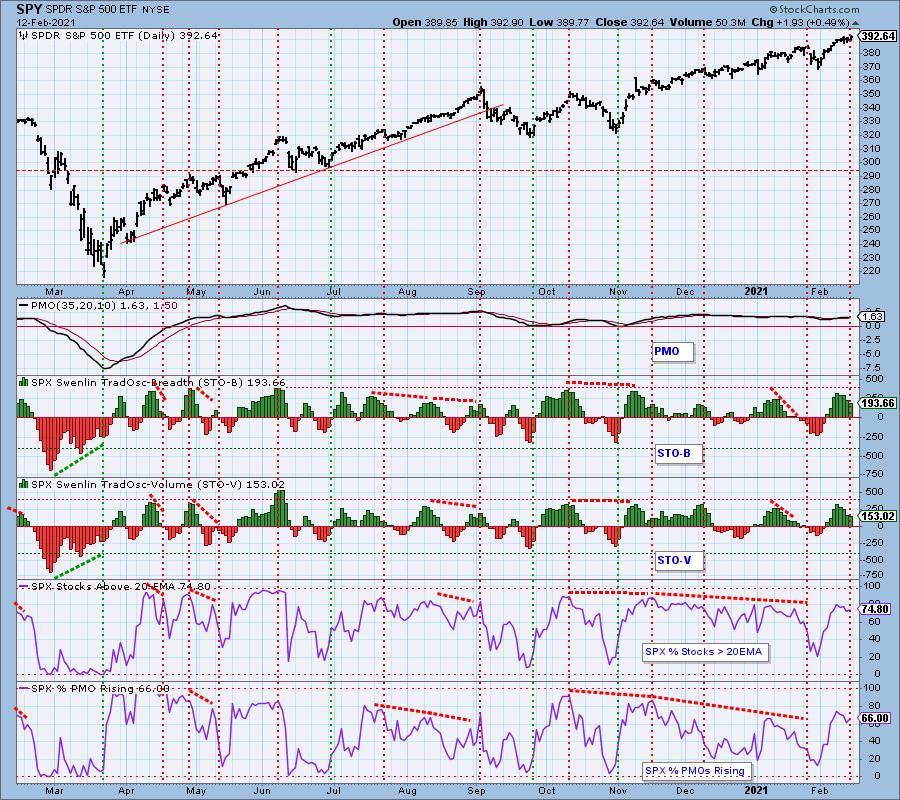
SPY Daily Chart: We've updated the annotations on the SPY. A rising wedge in the intermediate-term is the dominant pattern. It is a bearish formation and suggests a breakdown from the wedge. Today, we saw a bullish engulfing candle. The PMO is on a BUY signal. At issue would be the shrinking volume as new all-time highs were set. Price continues to press against the top of the wedge (formerly a rising trend channel).
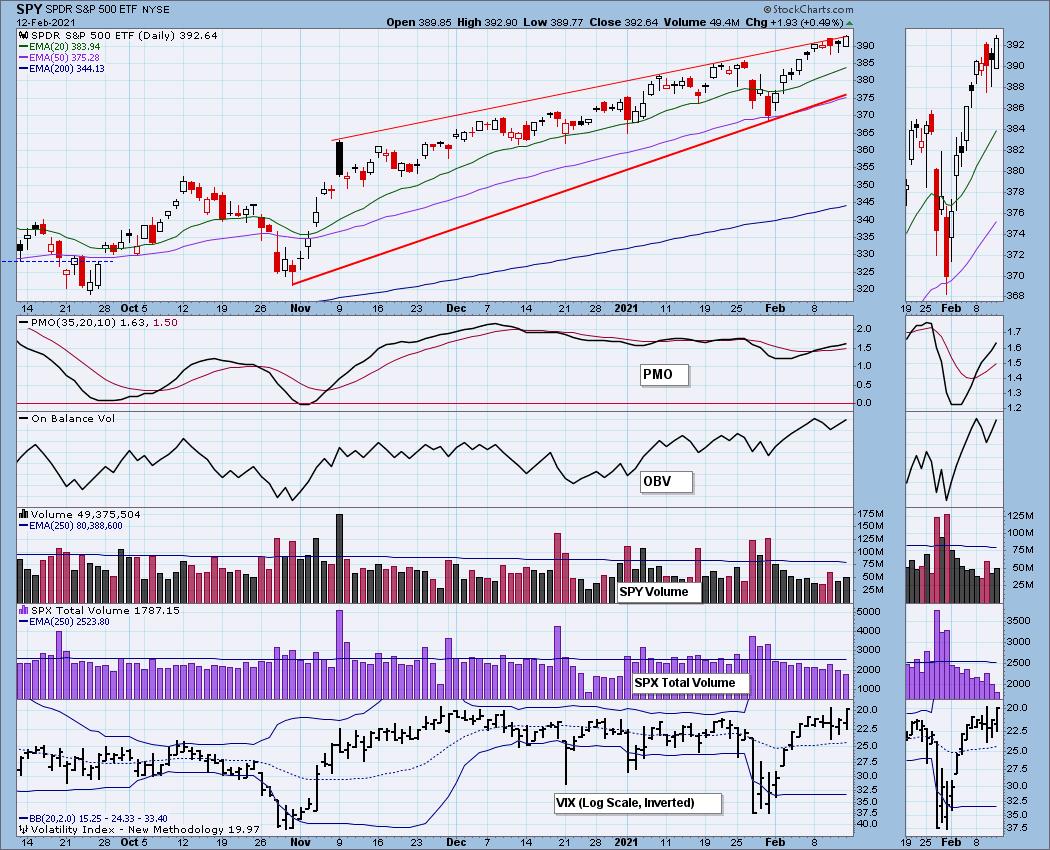
The market is stretched. The RSI is still positive but it is getting very close to overbought territory. The VIX is sitting in highly overbought territory.
Due to Monday Holiday - Trading Room on Tuesday!

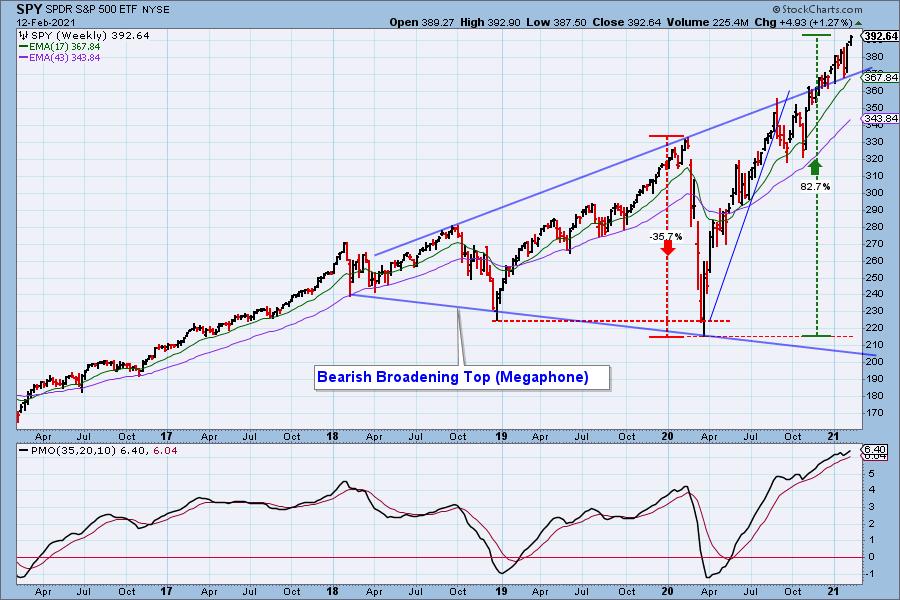
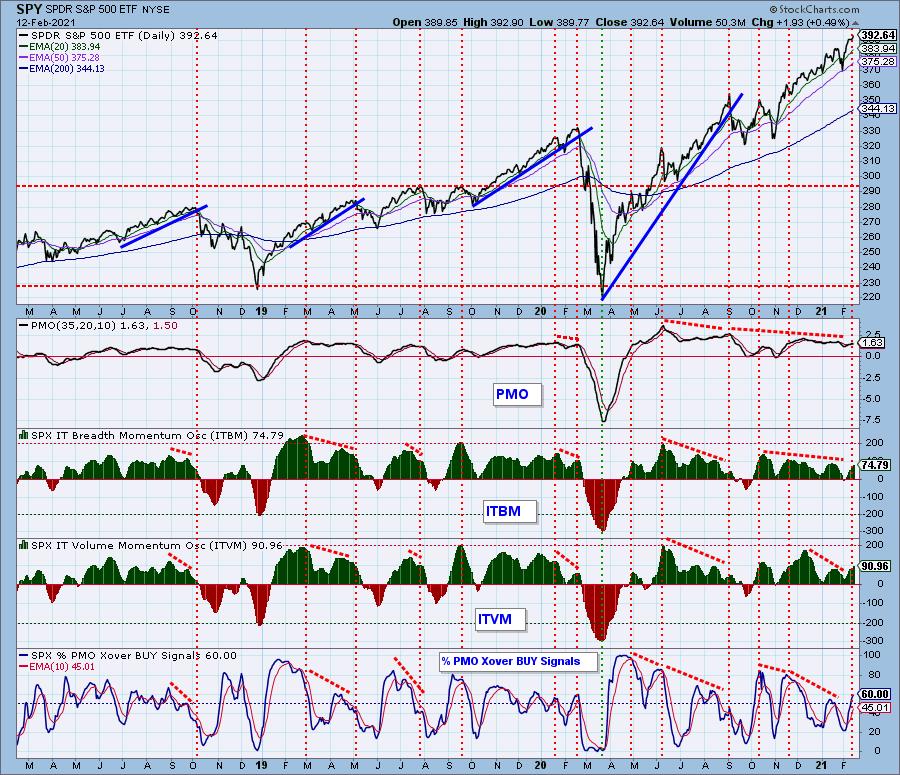
SPY Weekly Chart: Price continues to defy gravity pushing ever higher outside the bearish megaphone pattern. PMO bottoms above the signal line is very bullish, but given the weekly PMO is very overbought, caution is still warranted.
Participation: The following chart uses different methodologies for objectively showing the depth and trend of participation for intermediate- and long-term time frames.
- The Silver Cross Index (SCI) shows the percentage of SPX stocks on IT Trend Model BUY signals (20-EMA > 50-EMA).
- The Golden Cross Index (GCI) shows the percentage of SPX stocks on LT Trend Model BUY signals (50-EMA > 200-EMA).
- The Bullish Percent Index (BPI) shows the percentage of SPX stocks on Point & Figure BUY signals.
Negative divergences are still in play as the market makes new all-time highs. The GCI topped today which could be an early warning signal.
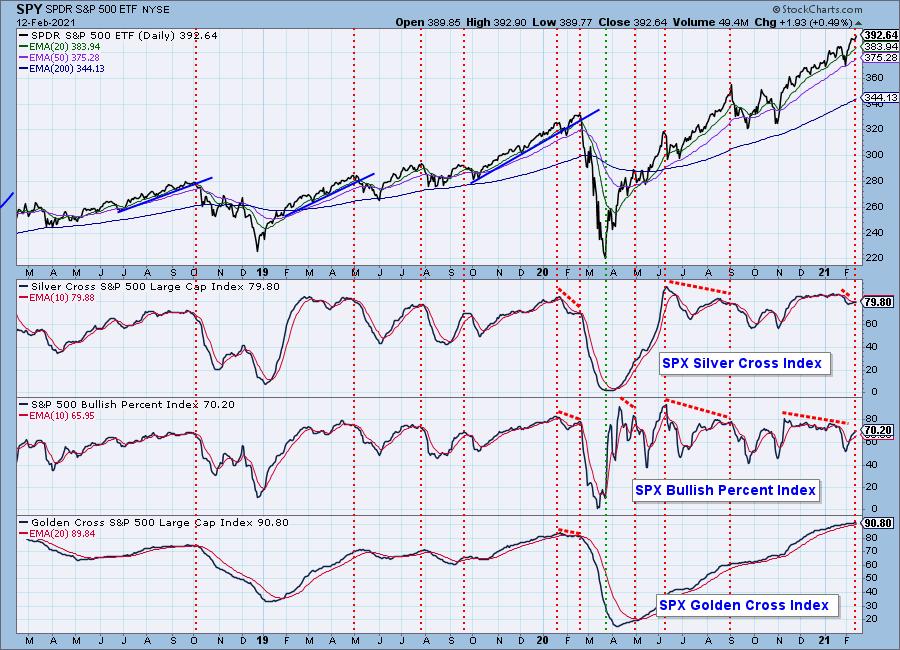
Despite making new all-time highs, participation is dropping.
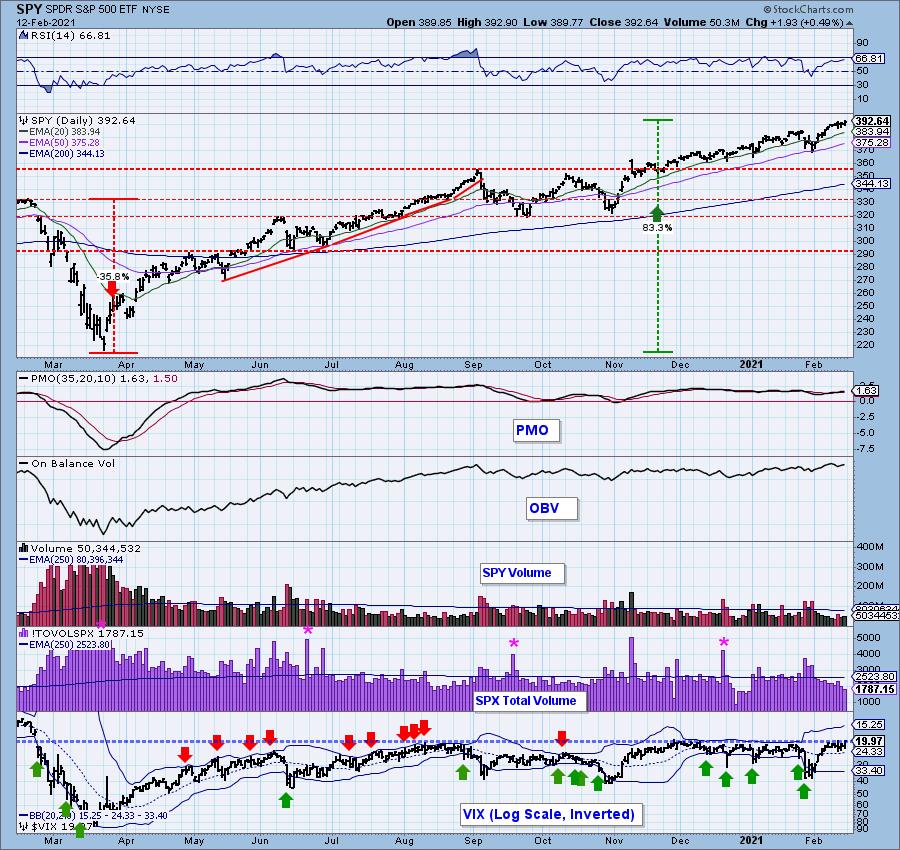
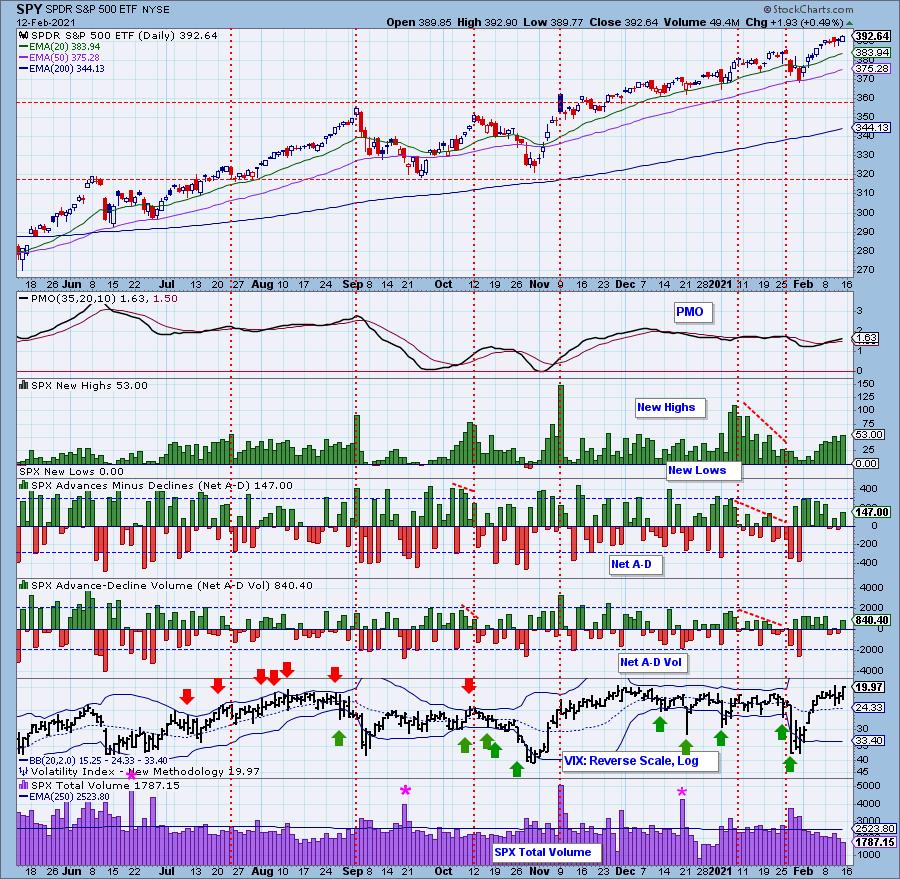
Climax Analysis: As noted earlier, the VIX is highly overbought. It hasn't reached the upper Bollinger Band, but the Band may come down to meet it soon given the tight readings. We didn't see any climaxes this week.
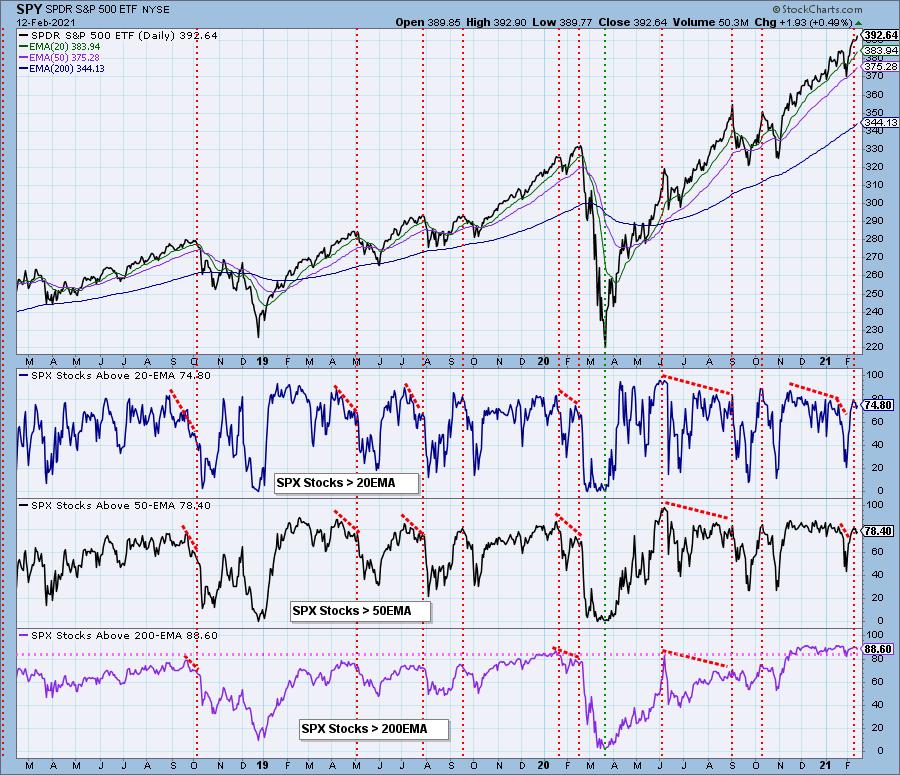
Short-Term Market Indicators: The short-term market trend is UP and the condition is SOMEWHAT OVERBOUGHT.
The STOs continue to fall suggesting the market will too. On a week where we made all-time highs, participation waned.
Intermediate-Term Market Indicators: The intermediate-term market trend is UP and the condition is OVERBOUGHT. The market bias is BULLISH.
All three IT indicators continued to rise this week. The ITBM and ITVM are getting overbought, but overall the intermediate term still has a strong bullish bias.
CONCLUSION: Despite making new all-time highs this week many of our indicators declined or have negative divergences. Price is struggling against the top of the bearish rising wedge. With short-term indicators looking bearish, we would expect a decline to at least test the bottom of the wedge. That would put price right on the 50-EMA. The intermediate-term looks slightly less bearish given rising IT indicators. More than likely we will experience more topping price behavior in the form of a pullback or at best, consolidation given the bullish bias. Stay cautious and consider setting "hard" stops versus "mental" stops going into next week.
Note: Options expiration is next week. Expect low volatility toward the end of the week.
Have you subscribed the DecisionPoint Diamonds yet? DP does the work for you by providing handpicked stocks/ETFs from exclusive DP scans! Add it with a discount! Contact support@decisionpoint.com for more information!
BITCOIN
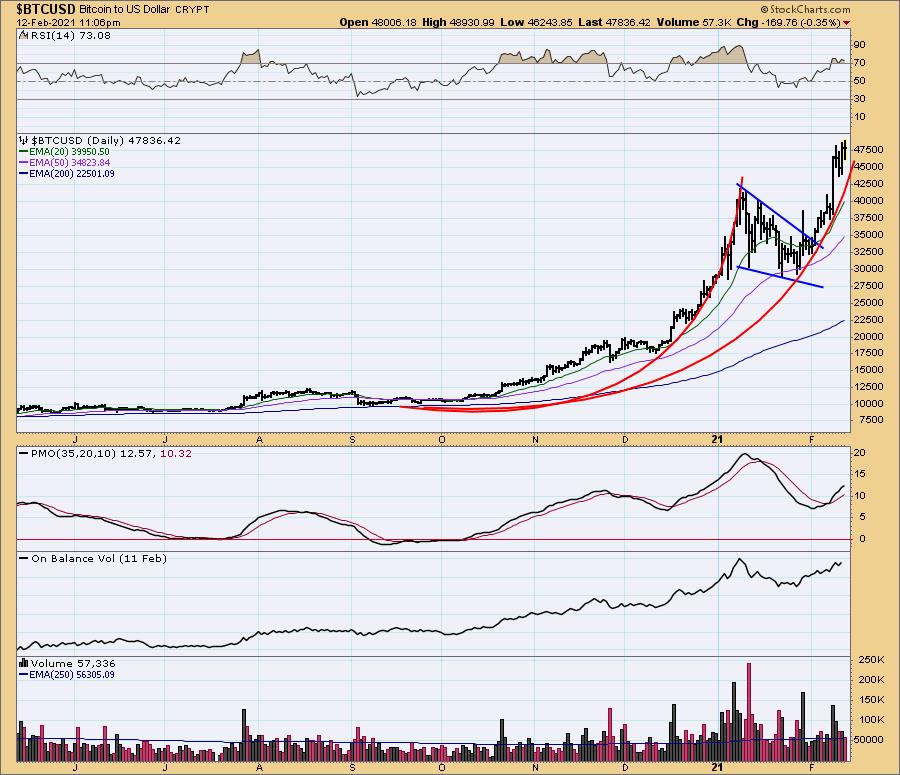
Bitcoin is flying higher again. After the Elon Musk pop on Monday price consolidated. It appears ready to break out once again given the strong PMO. The concern would be the overbought RSI. However, we note that Bitcoin can remain overbought and still rise. The chart suggests more upside on the parabolic move.
INTEREST RATES
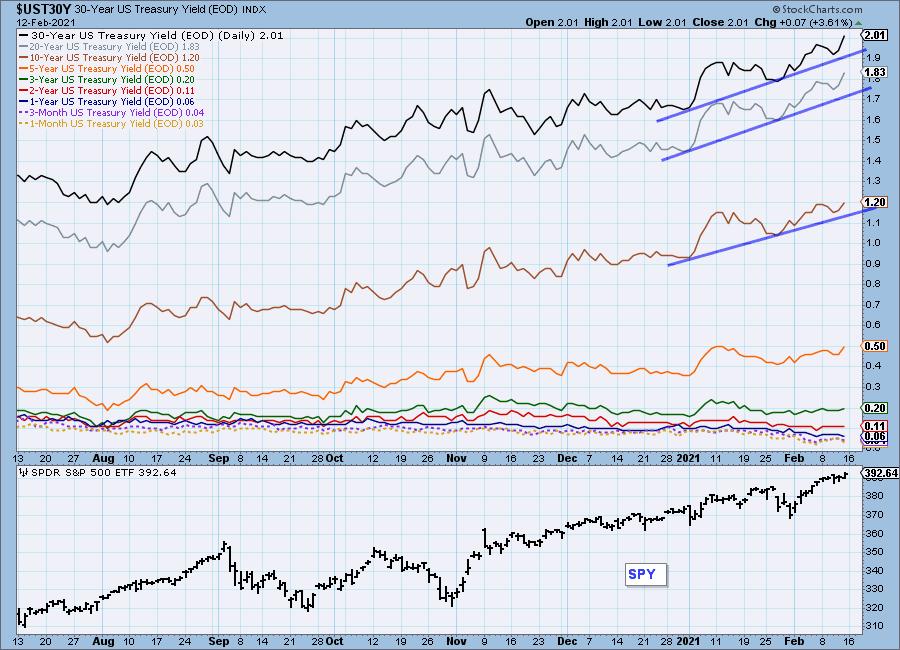
This chart is included so we can monitor rate inversions. In normal circumstances the longer money is borrowed the higher the interest rate that must be paid. When rates are inverted, the reverse is true.
Rates are rising and that is putting pressure on longer-term Bonds.
DOLLAR (UUP)
IT Trend Model: NEUTRAL as of 5/28/2020
LT Trend Model: SELL as of 7/10/2020
UUP Daily Chart: We noted in the introduction that the weekly chart on the Dollar saw a weekly PMO crossover BUY signal. The daily PMO is not as favorable. However, the price pattern is looking bullish with a cup and handle. The PMO is still declining after topping below the zero line (especially bearish). The 20-EMA is still holding as overhead resistance. While we have a bullish bottoming formation, the technicals still suggest lower prices.
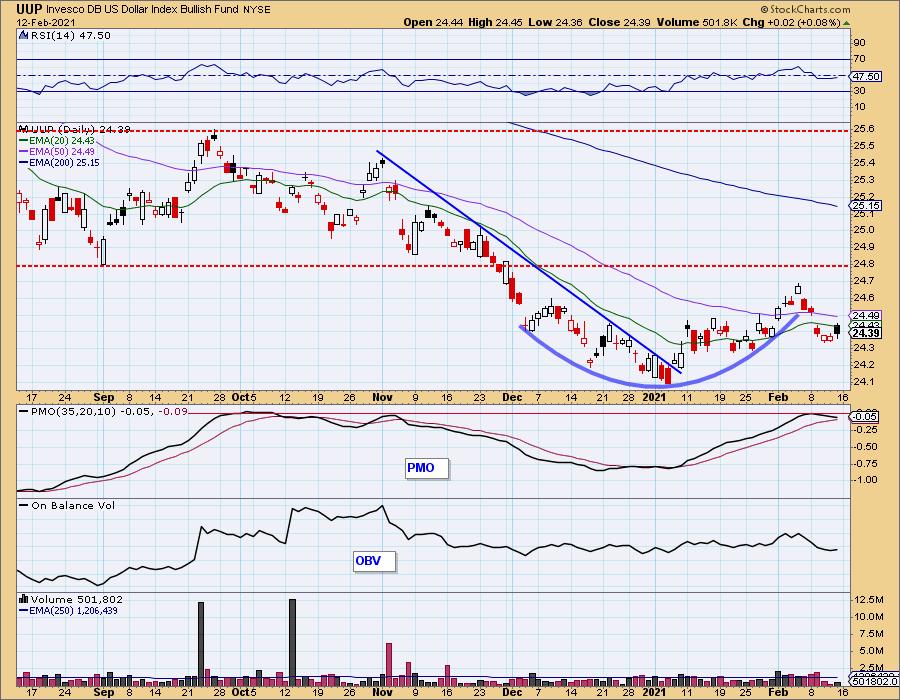
There is a bearish reverse flag visible on the one-year daily chart.
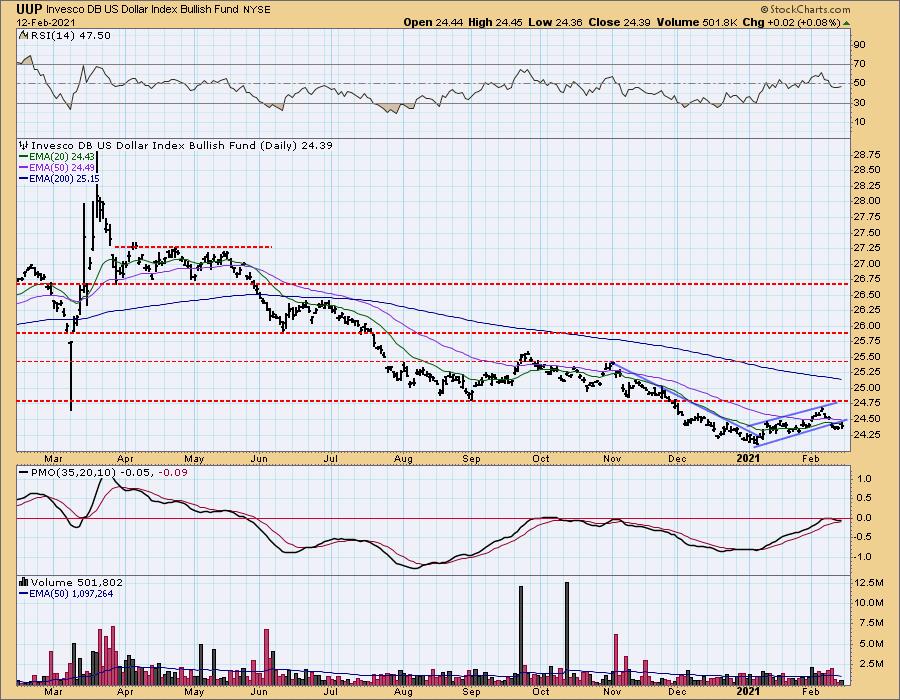
UUP Weekly Chart: We looked at the weekly chart already. Again, there is a bullish chart pattern and a new weekly PMO BUY signal. Price action isn't reflecting this yet. Overhead resistance lies very close at the July bottom.

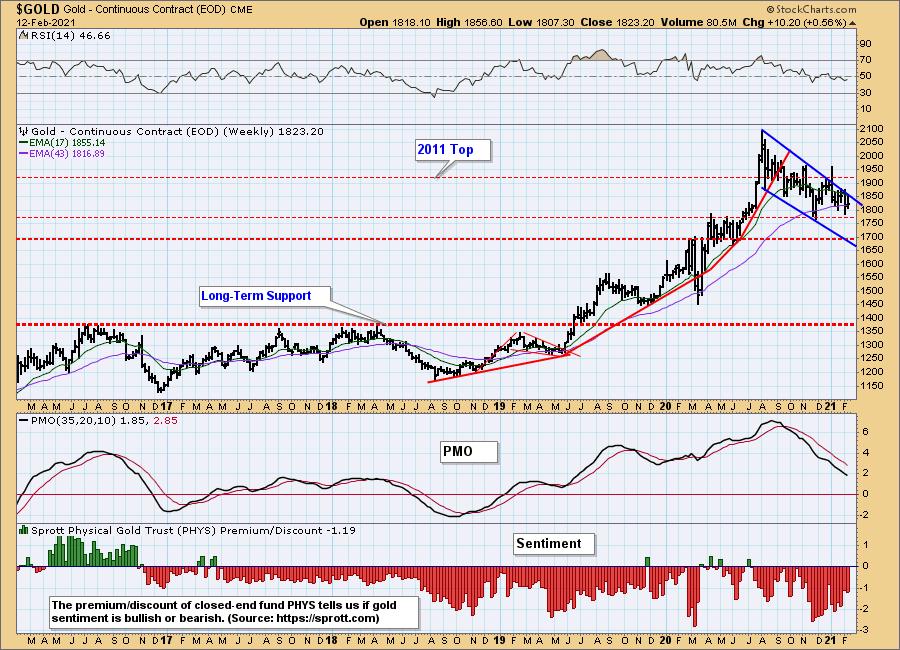
GOLD
IT Trend Model: NEUTRAL as of 1/13/2021
LT Trend Model: BUY as of 1/8/2019
GOLD Daily Chart: Gold is all over the place. After rallying, price failed at the 20-EMA. Today's candle dropped below the 200-EMA and closed the earlier gap up. The PMO is in negative territory and falling. We had a bearish spike on discounts which suggests investors are less interested. However, bearish sentiment is strong enough to look for an upside reversal.
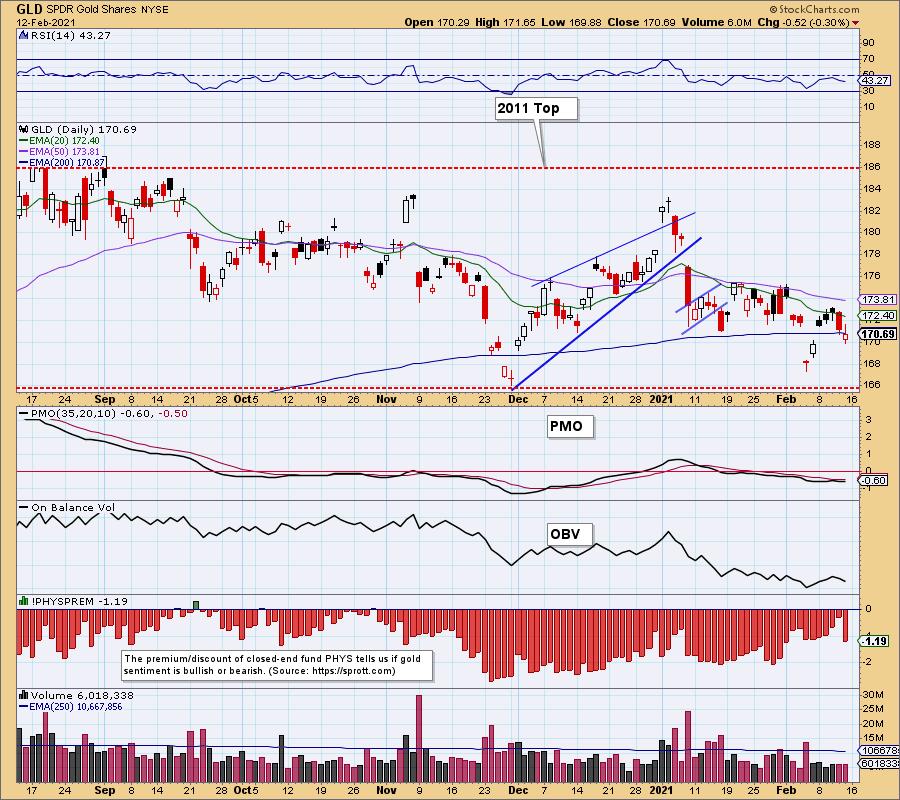
The RSI remains negative. With a break of the 200-EMA, we would expect to see price ride down to the February low.
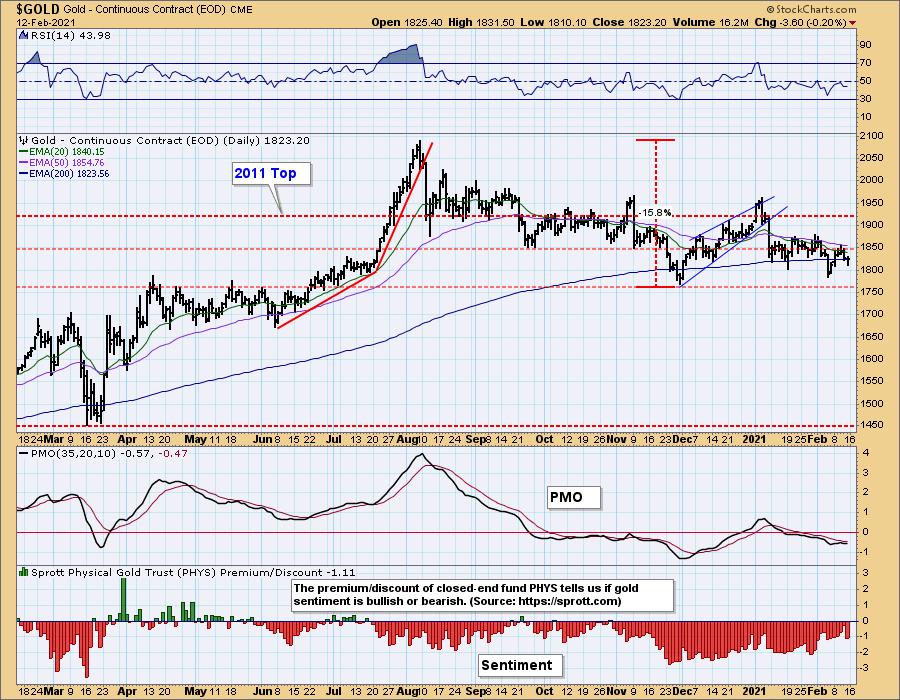
GOLD Weekly Chart: There is a large bull flag on the Gold weekly chart, but given the PMO and RSI a trending lower, this isn't likely a reversal point.
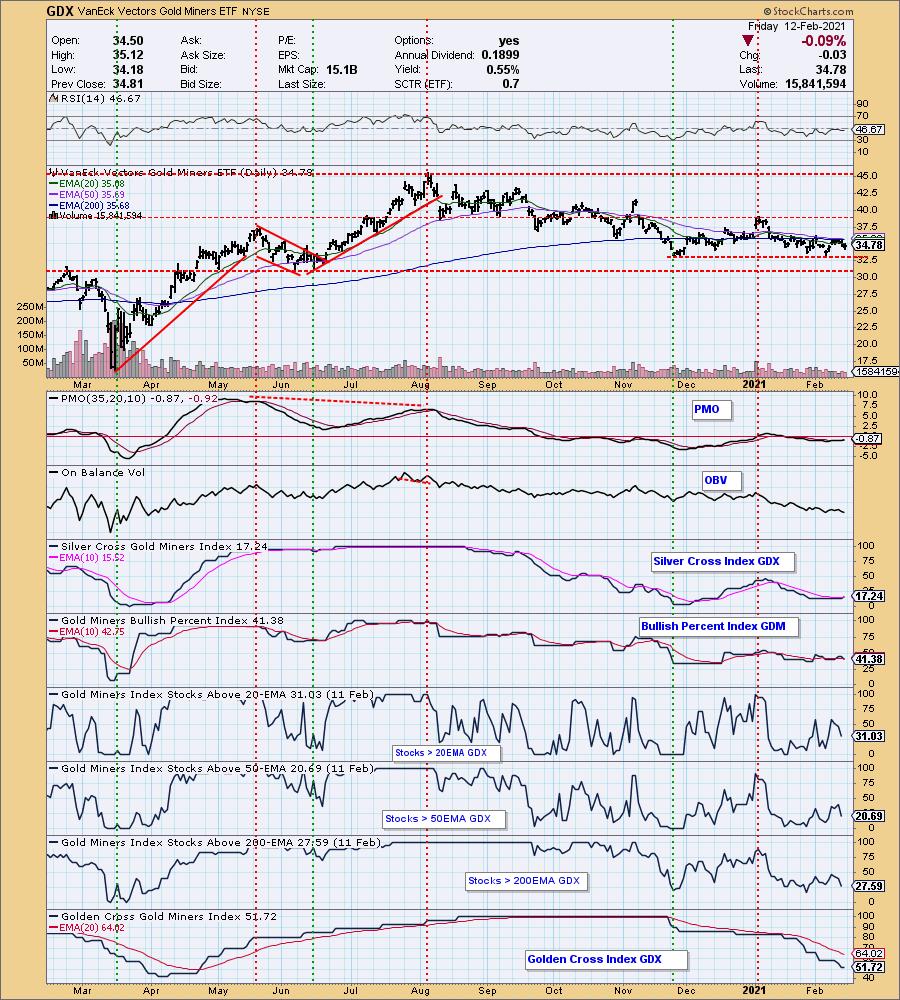
GOLD MINERS Golden and Silver Cross Indexes: Gold Miners just missed a negative 50/200-EMA crossover. That crossover, which should occur on Tuesday, would trigger a Long-Term Trend Model SELL signal. Most of the indicators are in decline. However, the SCI did have a positive crossover, so we may have some strength building under the surface. Watch for the BPI to trend upward not sideways. An improvement on the GCI is much needed as well.
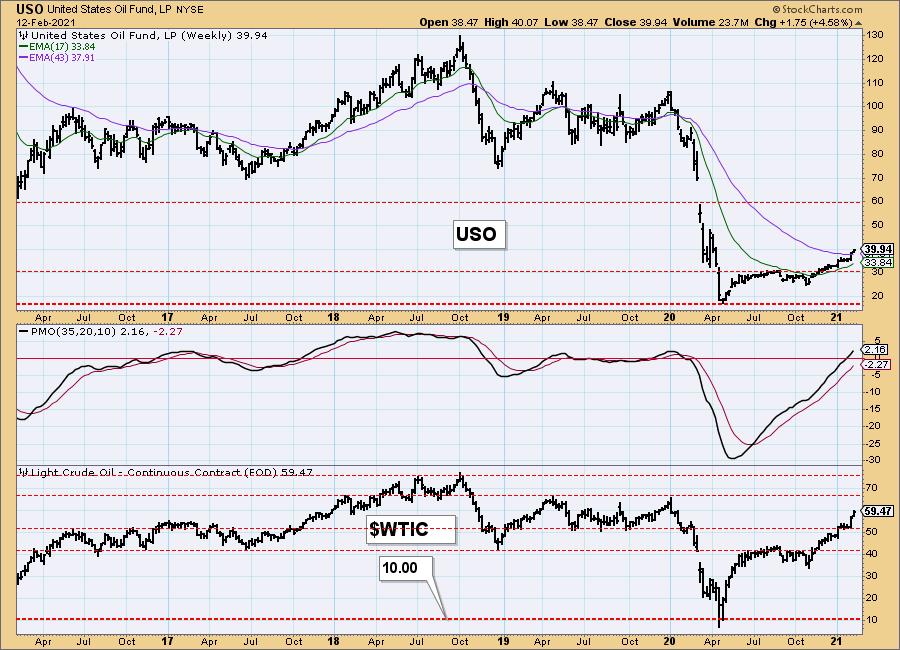
CRUDE OIL (USO)
IT Trend Model: BUY as of 11/23/2020
LT Trend Model: SELL as of 2/3/2020
USO Daily Chart: The Energy sector was the best performer this week and crude oil is one of the reasons why. Price is still pressing against the top of a rising trend channel and price is very overbought based on the RSI and overbought PMO. Price won't likely fall apart and with strong upside momentum, we would look for consolidation or a small pullback at worst. That would bring the RSI out of overbought territory and flatten the PMO.
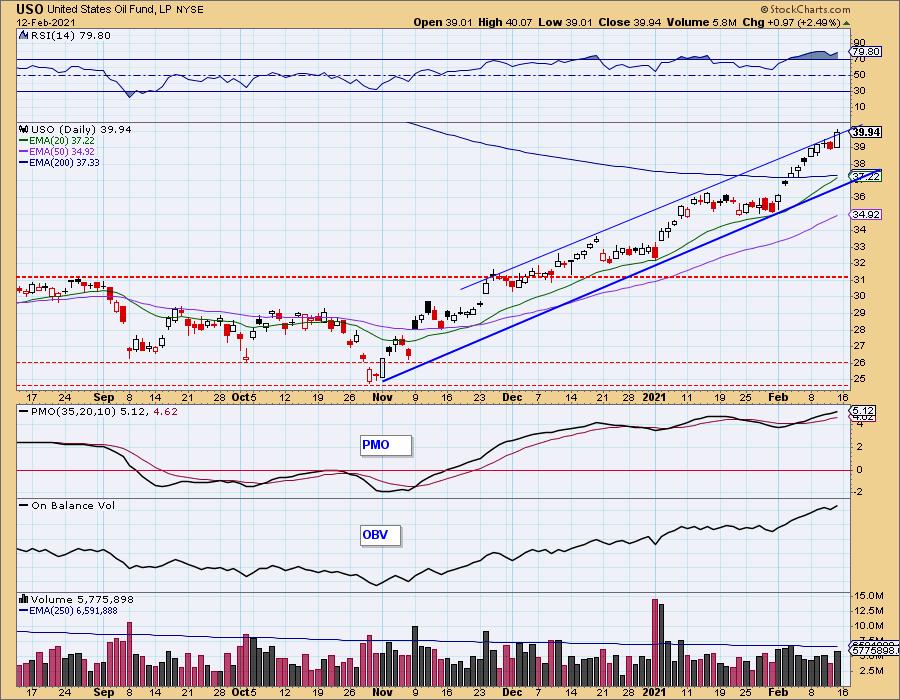
Now that price has made it back above the 200-EMA, the 50-EMA is chugging toward it, preparing for an upside crossover. That would trigger a Long-Term Trend Model BUY signal.
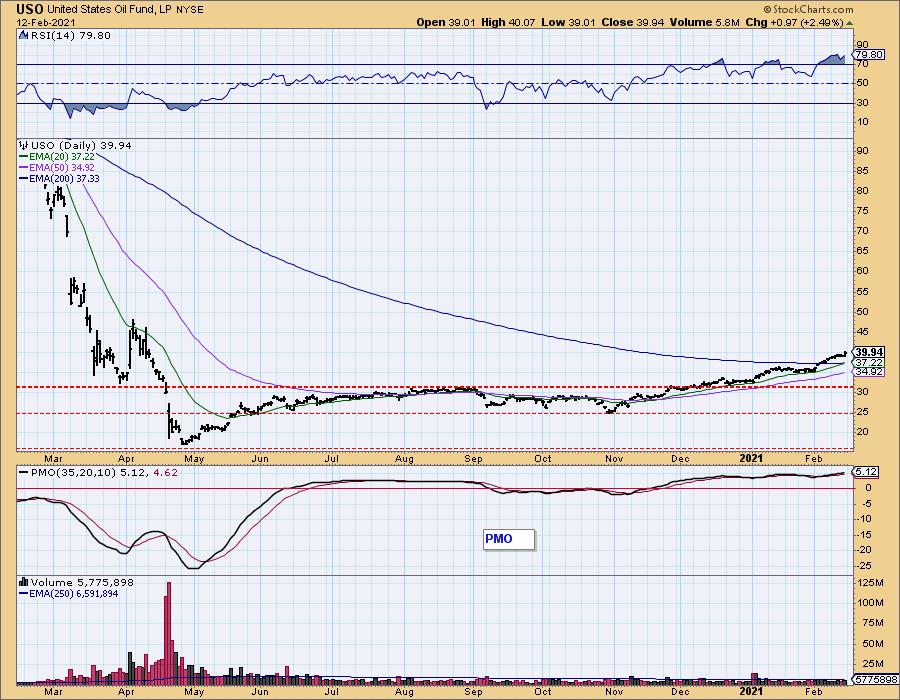
USO/$WTIC Weekly Chart: The weekly chart is very favorable with the PMO now reaching into positive territory and price staying above the 43-week EMA. $WTIC will likely challenge overhead resistance at the 2019 highs before turning back down.
BONDS (TLT)
IT Trend Model: NEUTRAL as of 8/27/2020
LT Trend Model: SELL as of 1/8/2021
TLT Daily Chart: Longer-term yields continue to trend higher. Today they jumped higher and as a consequence, TLT fell and gapped down. Price couldn't push past overhead resistance. The PMO has now topped below its signal line which is especially bearish.
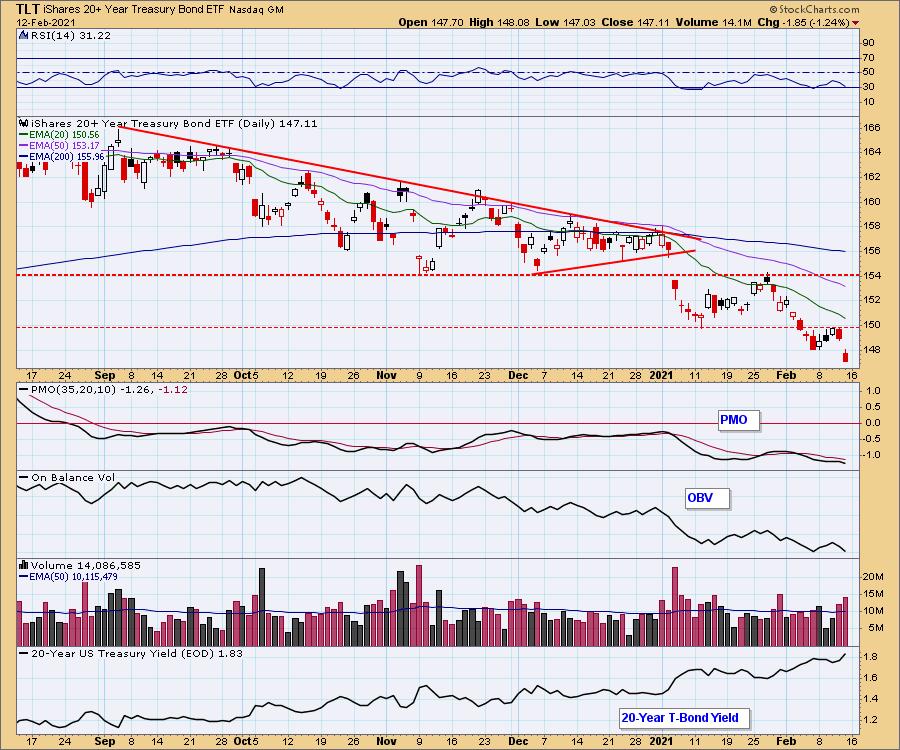
The RSI is nearing oversold territory below 30, but seeing the drop below support and a topping PMO, this isn't a reversal point.
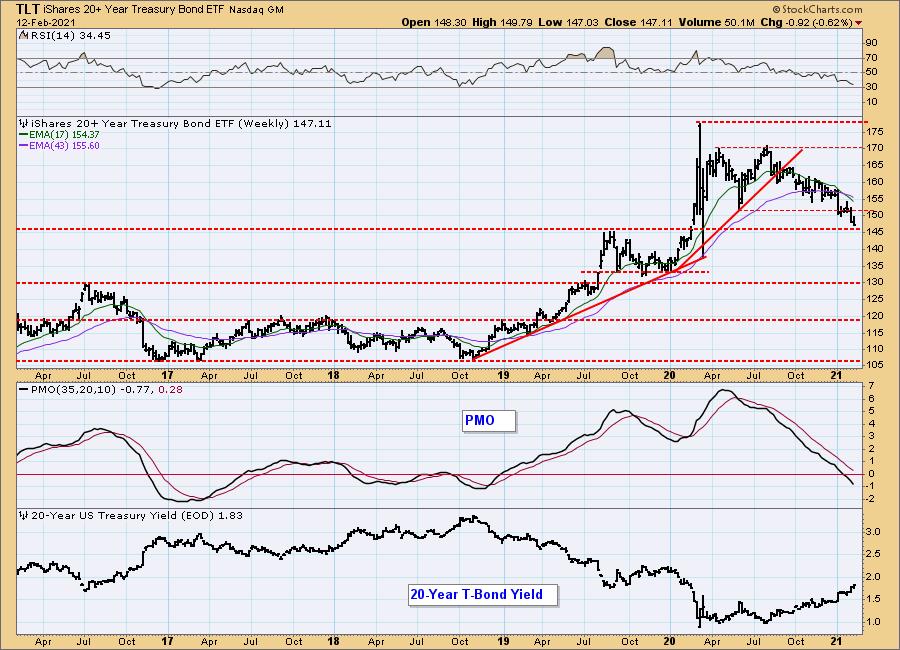
TLT Weekly Chart: Important support will be arriving soon in the form of the 2019 top. Given the now negative weekly PMO, it won't likely hold that price level.
Technical Analysis is a windsock, not a crystal ball.
-- Carl & Erin Swenlin
Disclaimer: This blog is for educational purposes only and should not be construed as financial advice. The ideas and strategies should never be used without first assessing your own personal and financial situation, or without consulting a financial professional. Any opinions expressed herein are solely those of the author(s), and do not in any way represent the views or opinions of any other person or entity.
NOTE: The signal status reported herein is based upon mechanical trading model signals, specifically, the DecisionPoint Trend Model. They define the implied bias of the price index based upon moving average relationships, but they do not necessarily call for a specific action. They are information flags that should prompt chart review. Further, they do not call for continuous buying or selling during the life of the signal. For example, a BUY signal will probably (but not necessarily) return the best results if action is taken soon after the signal is generated. Additional opportunities for buying may be found as price zigzags higher, but the trader must look for optimum entry points. Conversely, exit points to preserve gains (or minimize losses) may be evident before the model mechanically closes the signal.
Helpful DecisionPoint Links:
DecisionPoint Alert Chart List
DecisionPoint Golden Cross/Silver Cross Index Chart List
DecisionPoint Sector Chart List
Price Momentum Oscillator (PMO)
Swenlin Trading Oscillators (STO-B and STO-V)
DecisionPoint is not a registered investment advisor. Investment and trading decisions are solely your responsibility. DecisionPoint newsletters, blogs or website materials should NOT be interpreted as a recommendation or solicitation to buy or sell any security or to take any specific action.