
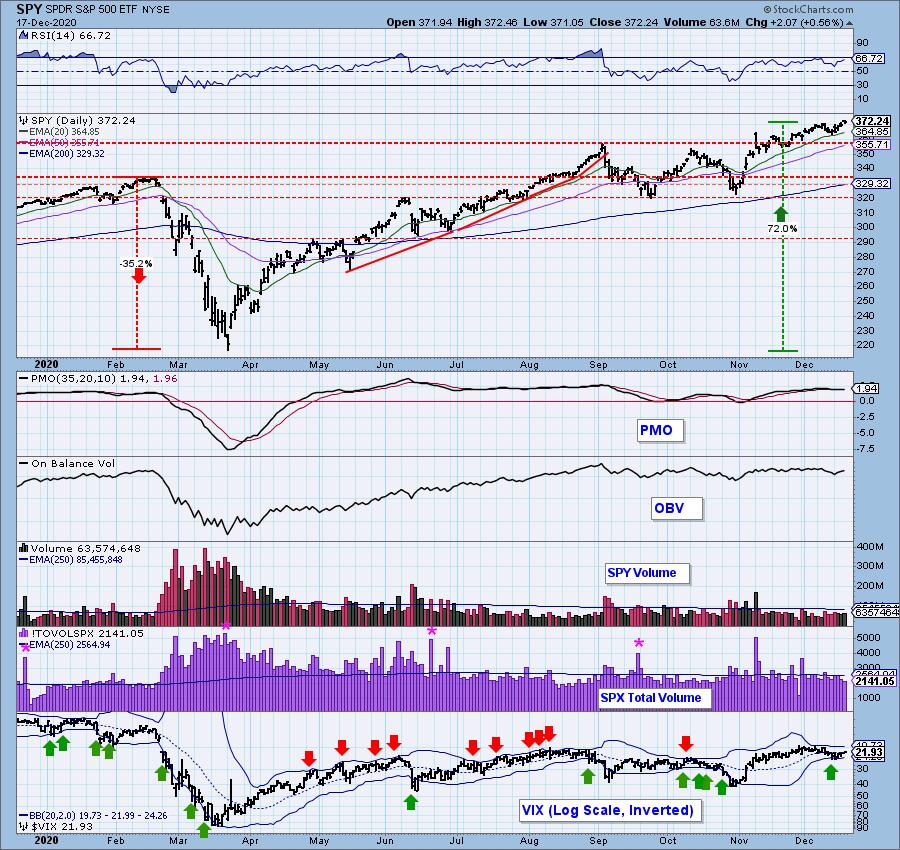
In today's Chartwise Women show, Mary Ellen and I reviewed the broad market index chart below to give us an idea of what index had the most potential moving into 2021. I decided to mark and measure the percentage gains from the bear market lows to current prices. You'll note that the best performers were actually in the mid- and small-caps. I knew they were outperforming, but I didn't realize by how much! Overall, the Nasdaq (ONEQ) has gained over 98% and has been the top performer. Mary Ellen and I agreed that this is likely the index with the most growth potential. Part of the reason is simple, it is tech heavy. Technology should continue to outperform going into the new year now that it can be considered a sector for all seasons.

The DecisionPoint Alert Weekly Wrap presents an end-of-week assessment of the trend and condition of the Stock Market, the U.S. Dollar, Gold, Crude Oil, and Bonds. The DecisionPoint Alert daily report (Monday through Thursday) is abbreviated and gives updates on the Weekly Wrap assessments.
Watch the latest episode of DecisionPoint on StockCharts TV's YouTube channel here!
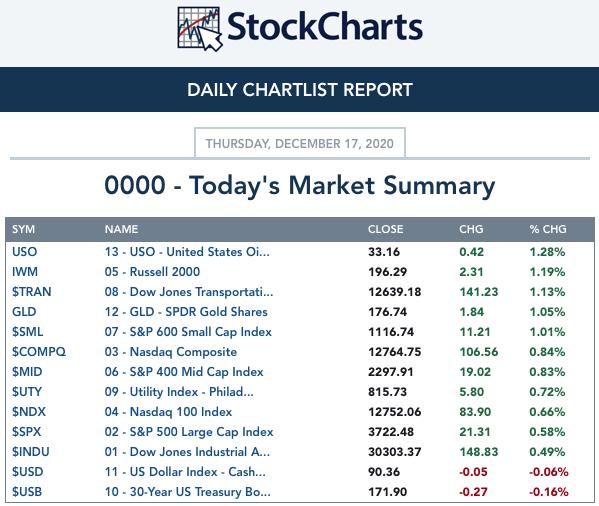
MAJOR MARKET INDEXES
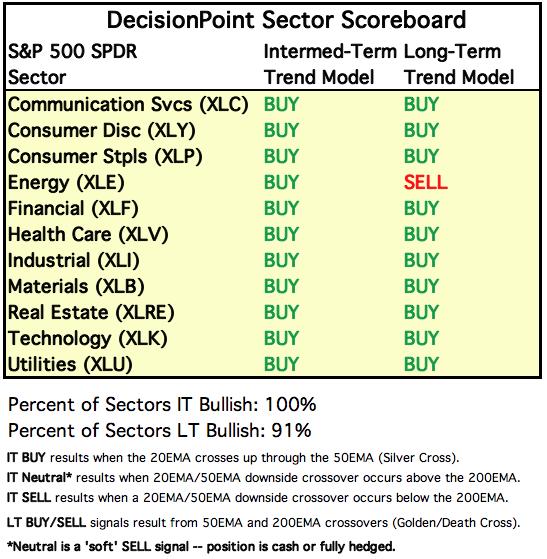
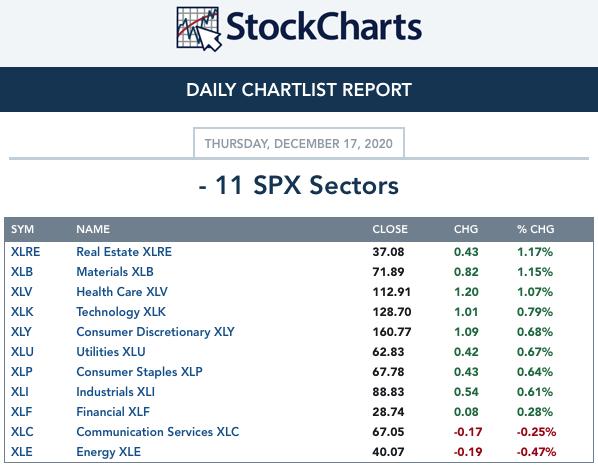
SECTORS
Each S&P 500 Index component stock is assigned to one, and only one, of 11 major sectors. This is a snapshot of the Intermediate-Term (Silver Cross) and Long-Term (Golden Cross) Trend Model signal status for those sectors.
CLICK HERE for Carl's annotated Sector charts.
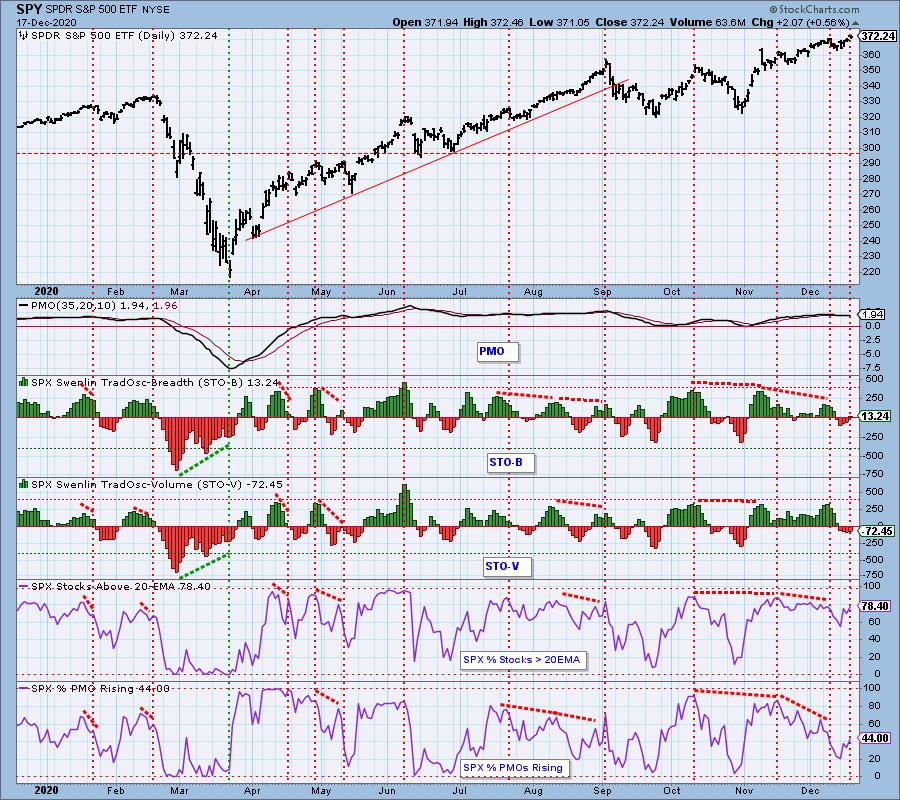
THE MARKET (S&P 500)
IT Trend Model: BUY as of 5/8/2020
LT Trend Model: BUY as of 6/8/2020
SPY Daily Chart: I decided to redraw the rising bottoms trendline on the 5-month candlestick. It is still a bearish rising wedge, but it appears Santa is coming to the rescue and we likely won't see it resolve downward until January. Total volume was low on today's rally. Tomorrow is options expiration so we would expect to see high volume with little price movement. The VIX has made it above its EMA and that suggests internal strength. If we see it puncture the upper Bollinger Band, that would be our indication that the rally might be on its last legs.
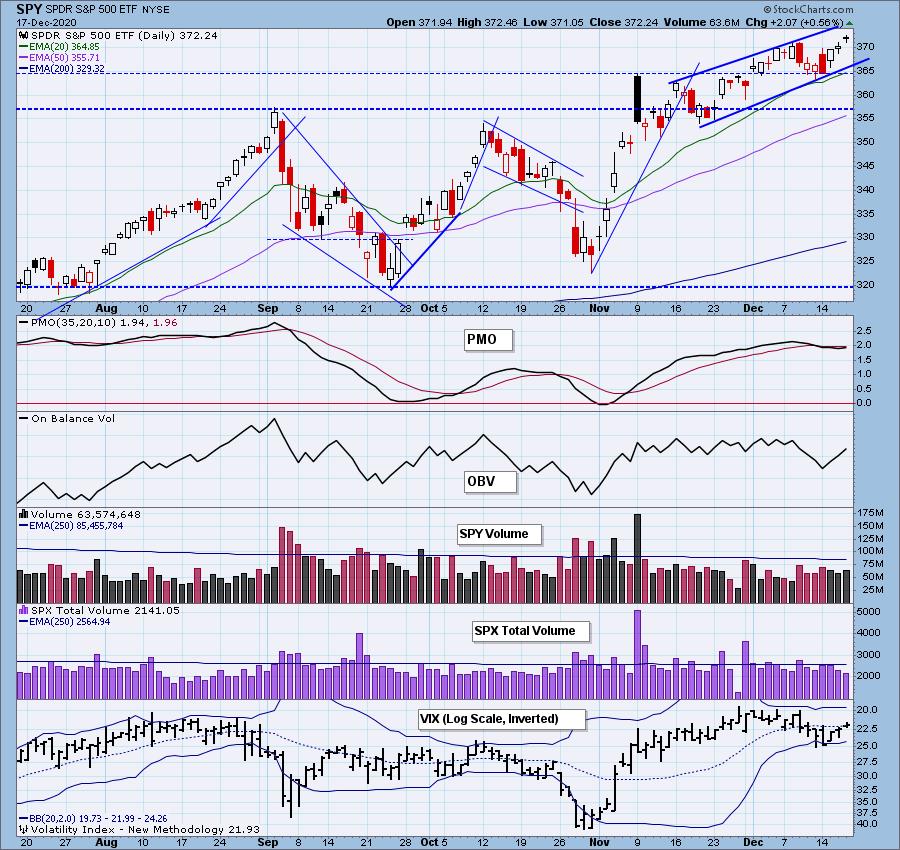
The PMO is ready to trigger a crossover BUY signal and the RSI remains very positive and not overbought.

It's Free!
***Click here to register for this recurring free DecisionPoint Trading Room on Mondays at Noon ET!***
Did you miss the 12/14 trading room? Here is a linkto the recording -- access code: 7dJNVe6+
For best results, copy and paste the access code to avoid typos.
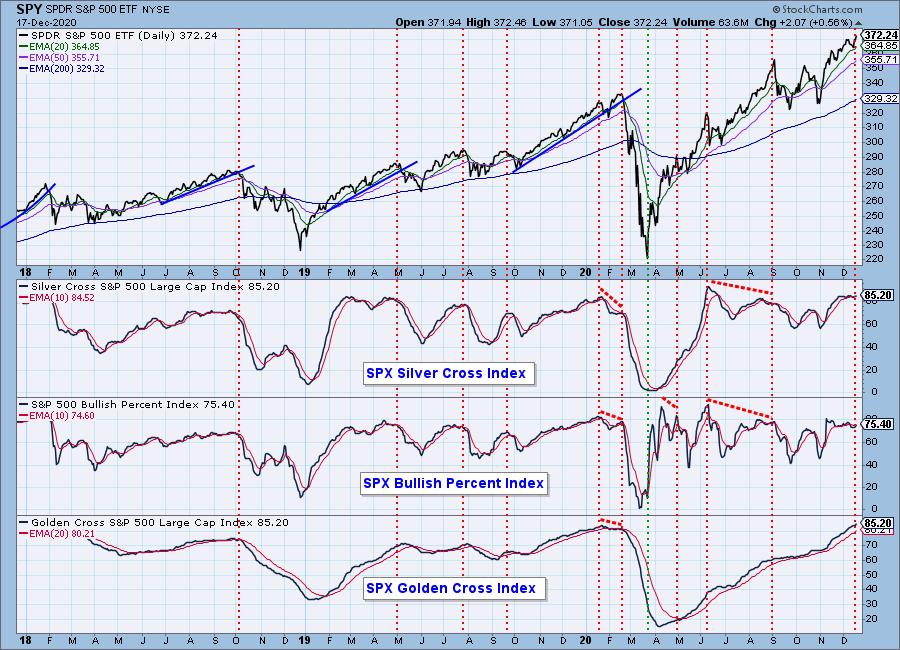
Participation: The following chart uses different methodologies for objectively showing the depth and trend of participation for intermediate- and long-term time frames.
- The Silver Cross Index (SCI) shows the percentage of SPX stocks on IT Trend Model BUY signals (20-EMA > 50-EMA).
- The Golden Cross Index (GCI) shows the percentage of SPX stocks on LT Trend Model BUY signals (50-EMA > 200-EMA).
- The Bullish Percent Index (BPI) shows the percentage of SPX stocks on Point & Figure BUY signals.
All of these indicators have are rising. The GCI is particularly overbought. The SCI is also overbought while the BPI isn't that overbought. It is positive to see them all rising, but overbought conditions are a problem as usual.
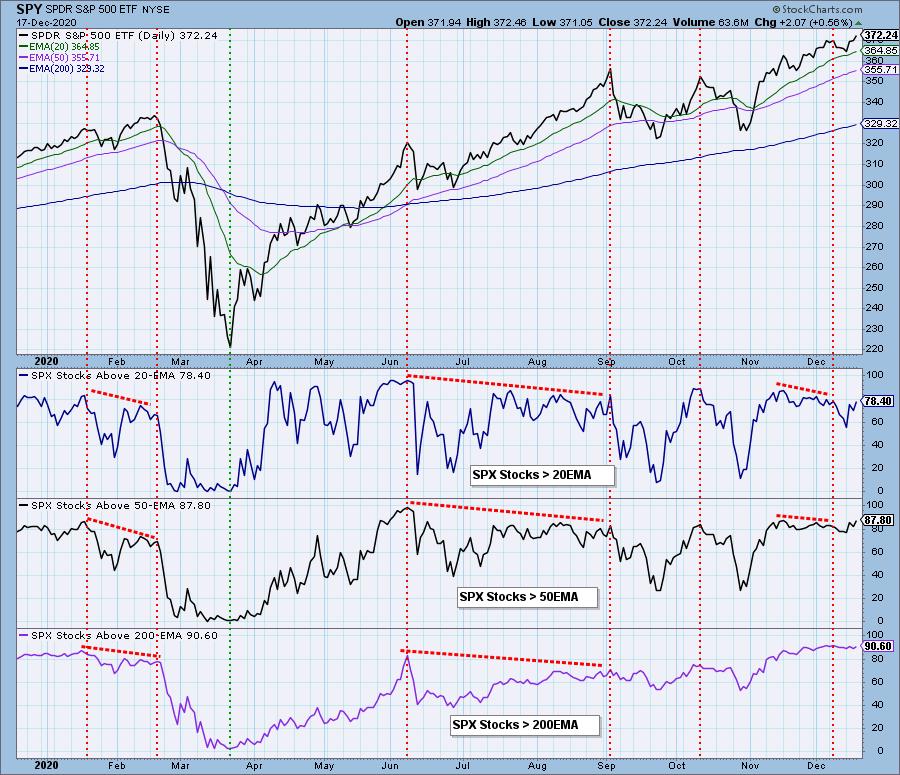
We saw these indicators finally turn back up on today's rally. They are in a rising trend which is positive, but the %Stocks above their 50/200-EMAs are very overbought.
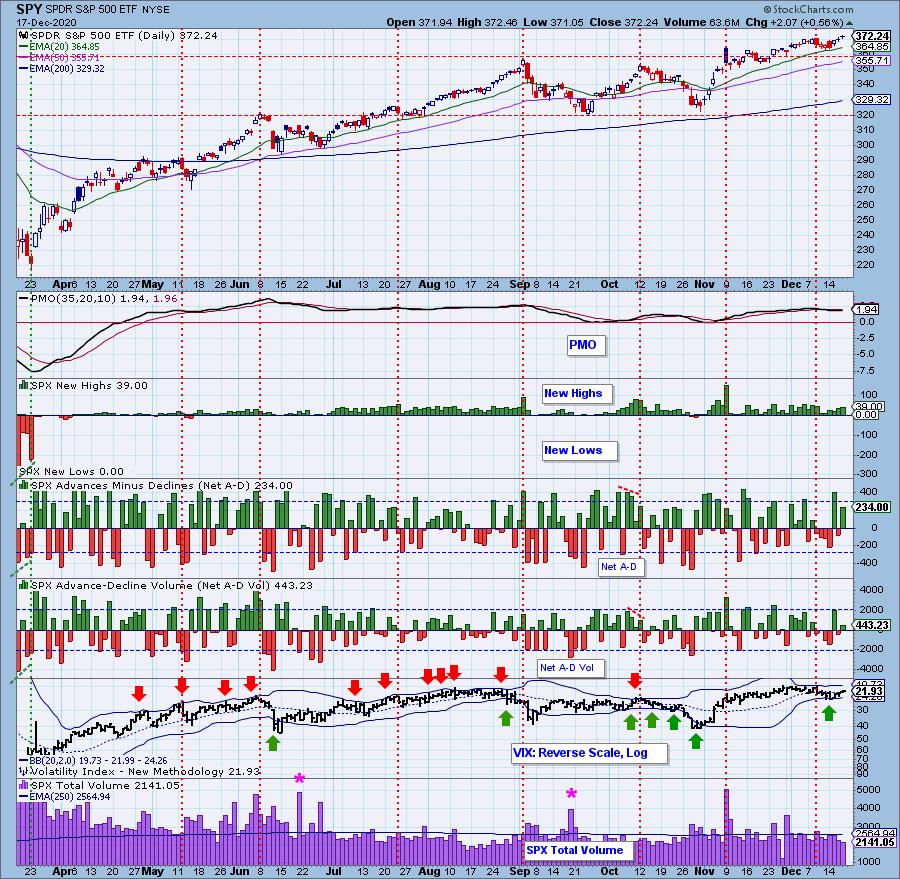
Climactic Market Indicators: Positive breadth today on this rally and an increase in New Highs. While we don't have a climax here, the readings overall are bullish.
Short-Term Market Indicators: The short-term market trend is UP and the condition is NEUTRAL.
Today both STOs rose with the STO-B back in positive territory. Rising from somewhat oversold territory is also positive and does suggest there is upside potential. Participation is growing with 44% of stocks with rising momentum. This can support higher prices.
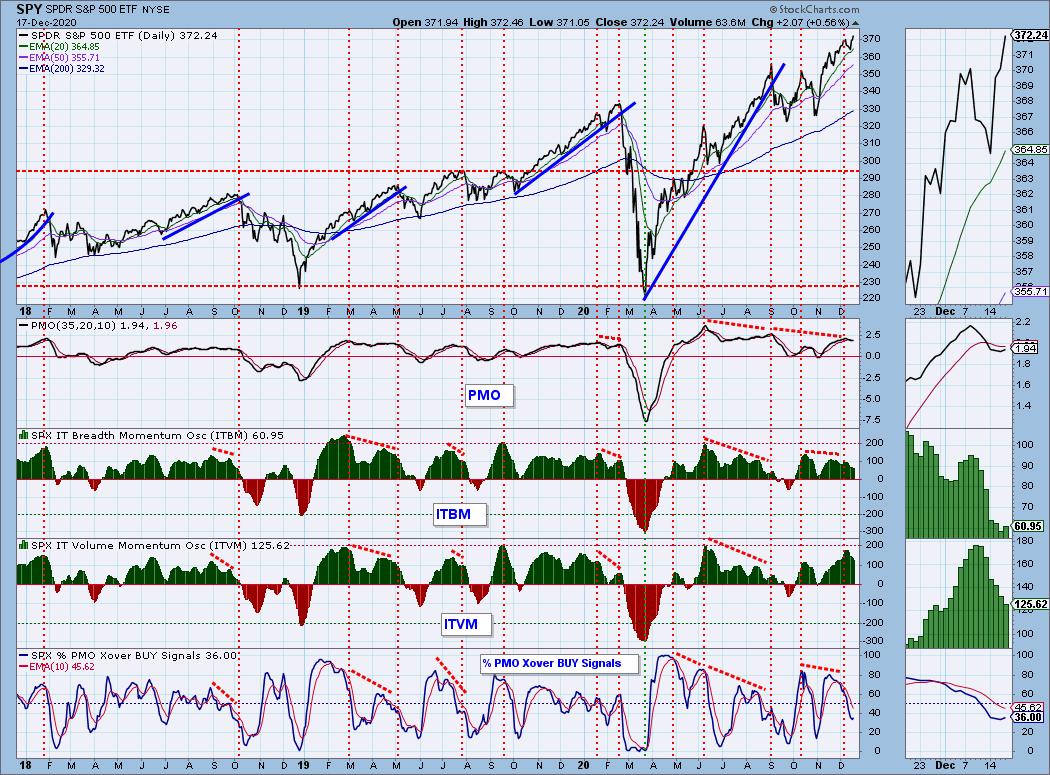
Intermediate-Term Market Indicators: The intermediate-term market trend is UP and the condition is OVERBOUGHT. The market bias is BULLISH.
These indicators took different paths today with the ITBM rising and the ITVM falling. Looking in the thumbnail I am struck by the negative divergence of declining indicators and rising prices.
CONCLUSION: Dr. Fauci may want to cancel Christmas, but Santa is delivering for the market. Price is now headed to test the top of a bearish rising wedge. The STOs are rising and the PMO is about to trigger a BUY signal. Participation is increasing as more stocks are seeing rising momentum with a few new BUY signals appearing. Santa and holiday trading will likely hold up the market until January given the improvement on our indicators. Remember that tomorrow is options expiration so expect high volume and limited price movement. While this isn't always the case, a pause right now makes sense.
Have you subscribed the DecisionPoint Diamonds yet? DP does the work for you by providing handpicked stocks/ETFs from exclusive DP scans! Add it with a discount! Contact support@decisionpoint.com for more information!
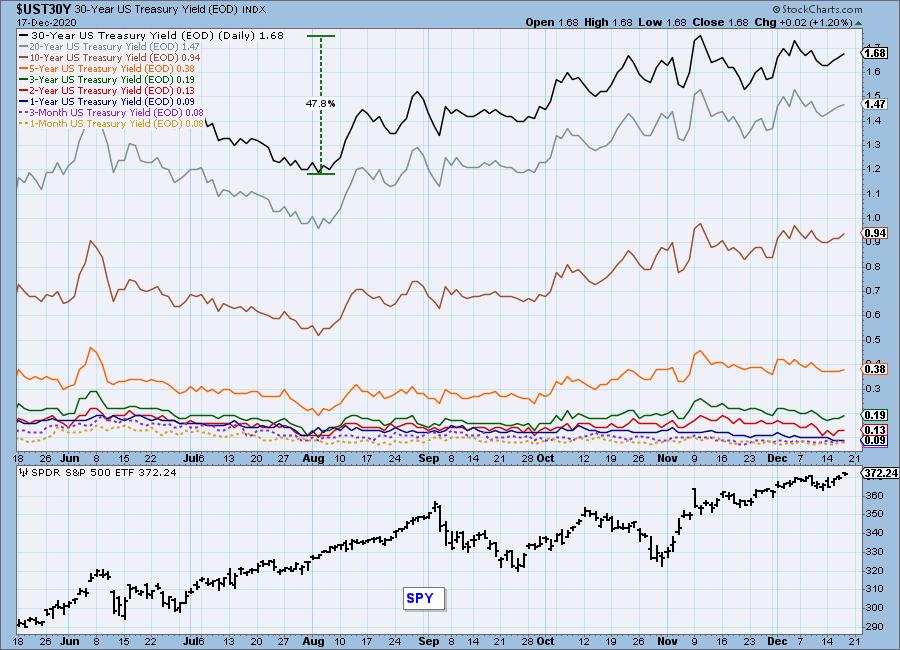
INTEREST RATES
This chart is included so we can monitor rate inversions. In normal circumstances the longer money is borrowed the higher the interest rate that must be paid. When rates are inverted, the reverse is true.
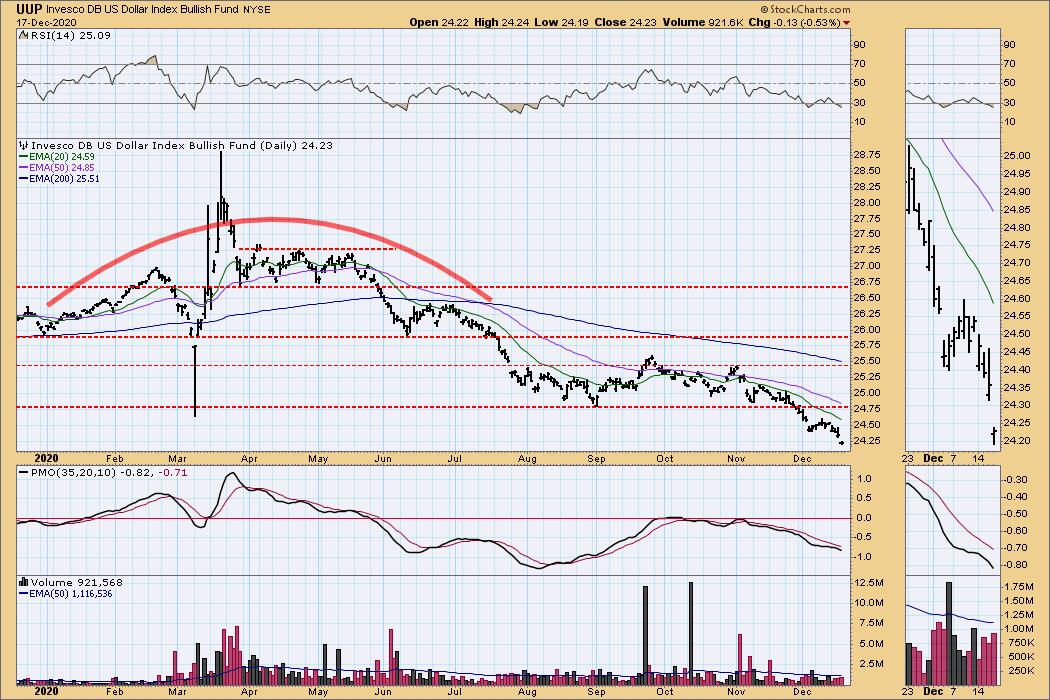
DOLLAR (UUP)
IT Trend Model: NEUTRAL as of 5/28/2020
LT Trend Model: SELL as of 7/10/2020
UUP Daily Chart: The Dollar (UUP) gapped down today. The RSI and price are very oversold, but the PMO can certainly move lower. The PMO's acceleration downward suggests we will continue to see an oversold RSI and lower prices.
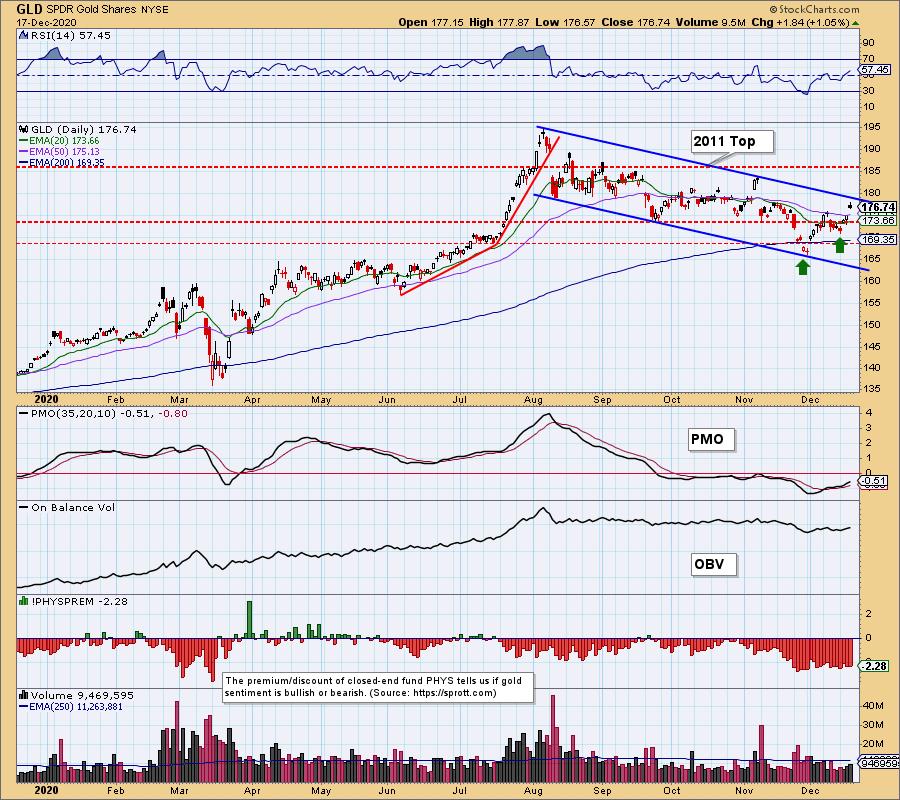
GOLD
IT Trend Model: NEUTRAL as of 10/14/2020
LT Trend Model: BUY as of 1/8/2019
GOLD Daily Chart: A weakening Dollar is helping out Gold. It was up over 1% today. I do note that on the daily chart for GLD, it is still in a declining trend channel. Price is about ready to test the topside. Given the major improvement on the RSI and PMO, a breakout is highly likely--especially when you consider the Dollar is so weak. Discounts remain very high on PHYS and that is a signal that traders are still very bearish on Gold. That will change soon.
Full disclosure: I own GLD.
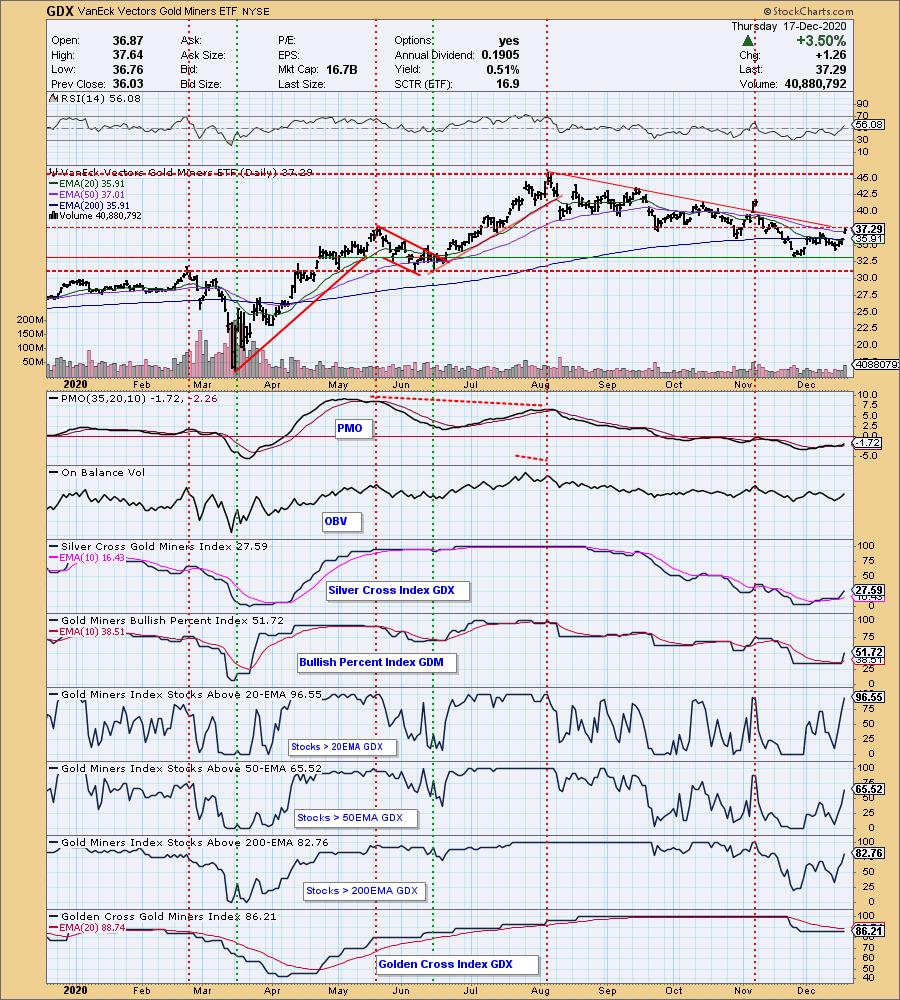
GOLD MINERS Golden and Silver Cross Indexes: Miners are headed to test the declining trend. Price managed to breakout above both the 20/50-EMAs today which is very positive. The PMO is rising and on a BUY signal and the RSI has just hit positive territory. The indicators are all rising. The %Stocks > 20-EMA is very overbought which tells me there could be a pullback that would keep it in a declining trend. Overall it is a very bullish chart. I've been telling Diamonds subscribers for the past two weeks that Miners would begin to outperform. I've offered a few of my favorite Miner stocks in the Diamonds Reports. (If you aren't a Diamonds subscriber, you may want to give it a try so you can take advantage of our 15% off holiday sale)
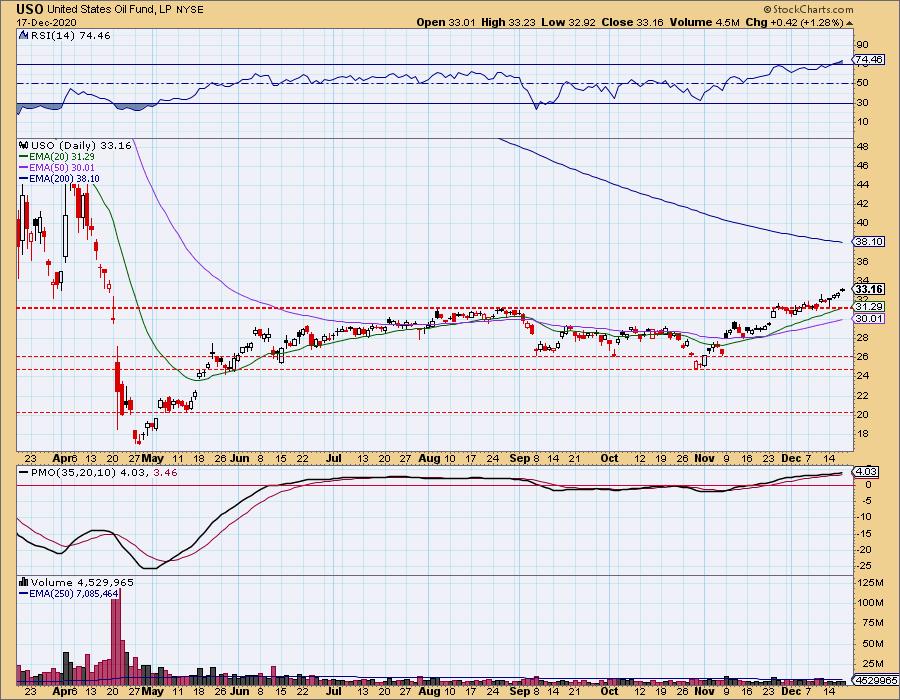
CRUDE OIL (USO)
IT Trend Model: BUY as of 10/20/2020
LT Trend Model: SELL as of 2/3/2020
USO Daily Chart: Yesterday's comments still apply:
"Oil continues to rally and that has pushed the RSI into overbought territory. The PMO is still rising. Now that the RSI is in overbought territory and the PMO is overbought, we should prepare for a pause or pullback soon."
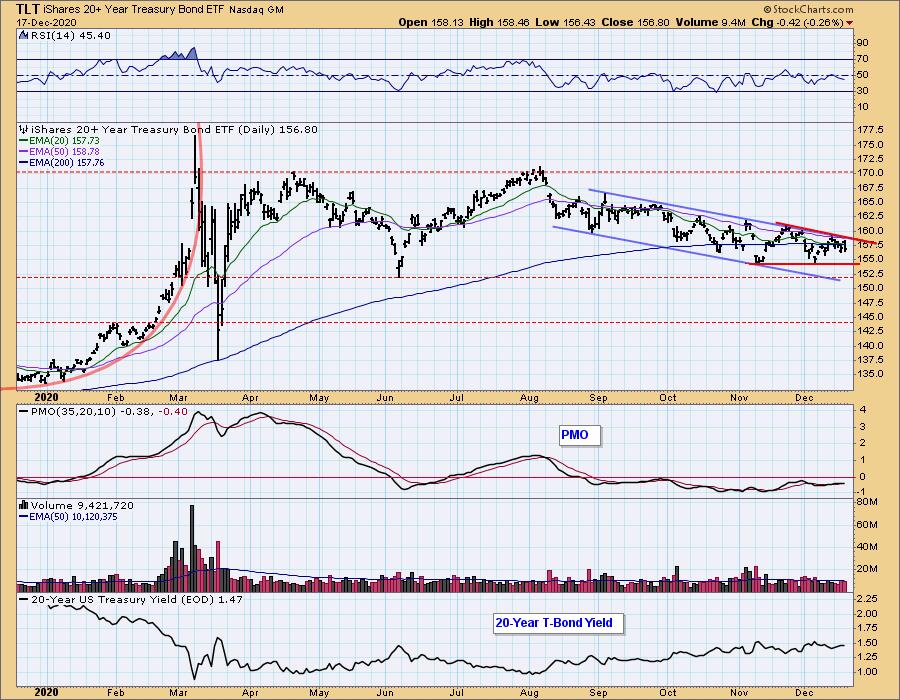
BONDS (TLT)
IT Trend Model: NEUTRAL as of 8/27/2020
LT Trend Model: BUY as of 1/2/2019
TLT Daily Chart: Yields are rising and that is causing problems for TLT. Price hit the top of the declining trend channel and was stopped. I can make out a short-term descending triangle. That's a bearish pattern that should resolve with a breakdown below support.
Full Disclosure: I own TLT
Technical Analysis is a windsock, not a crystal ball.
Happy Charting! - Erin
Disclaimer: This blog is for educational purposes only and should not be construed as financial advice. The ideas and strategies should never be used without first assessing your own personal and financial situation, or without consulting a financial professional. Any opinions expressed herein are solely those of the author, and do not in any way represent the views or opinions of any other person or entity.
NOTE: The signal status reported herein is based upon mechanical trading model signals, specifically, the DecisionPoint Trend Model. They define the implied bias of the price index based upon moving average relationships, but they do not necessarily call for a specific action. They are information flags that should prompt chart review. Further, they do not call for continuous buying or selling during the life of the signal. For example, a BUY signal will probably (but not necessarily) return the best results if action is taken soon after the signal is generated. Additional opportunities for buying may be found as price zigzags higher, but the trader must look for optimum entry points. Conversely, exit points to preserve gains (or minimize losses) may be evident before the model mechanically closes the signal.
Helpful DecisionPoint Links:
DecisionPoint Alert Chart List
DecisionPoint Golden Cross/Silver Cross Index Chart List
DecisionPoint Sector Chart List
Price Momentum Oscillator (PMO)
Swenlin Trading Oscillators (STO-B and STO-V)
DecisionPoint is not a registered investment advisor. Investment and trading decisions are solely your responsibility. DecisionPoint newsletters, blogs or website materials should NOT be interpreted as a recommendation or solicitation to buy or sell any security or to take any specific action.