
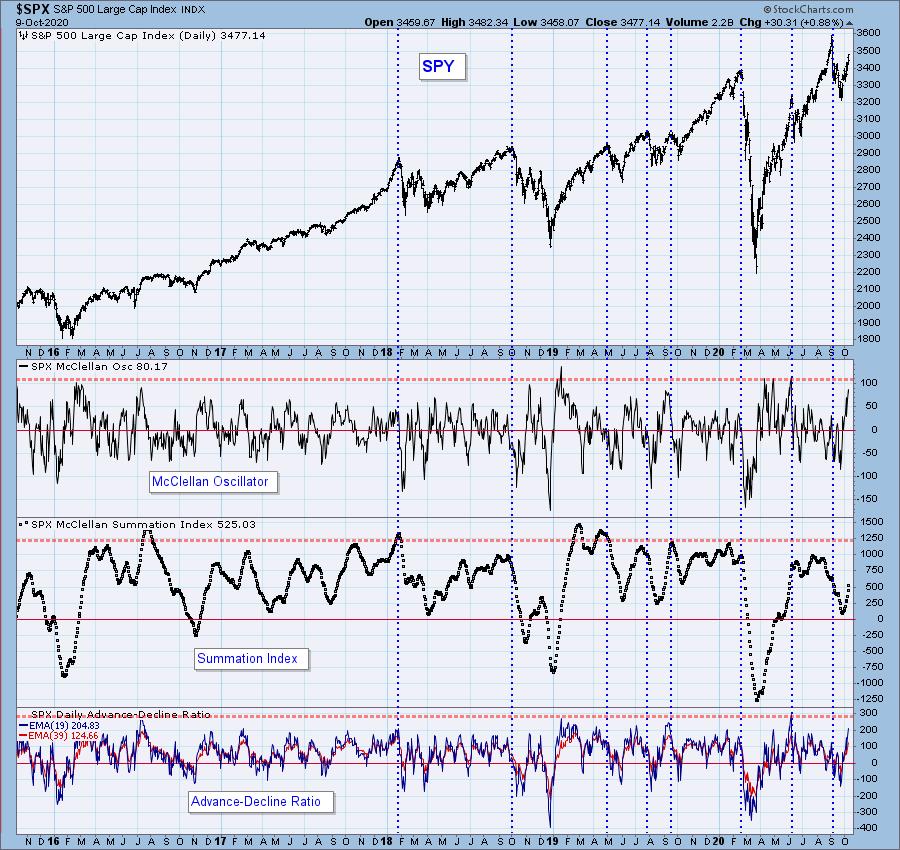
The market is running on all cylinders right now with a strong bullish bias. The indicators were enlightening today. I decided to look at the McClellan Oscillator chart. The McClellan Oscillator is extremely overbought, but looking at cardinal tops, that isn't really the problem. The Summation Index is the more accurate measure of critical market tops in the longer term as its overbought conditions are a warning sign. Currently the Summation Index is not overbought. On the contrary it is strongly rising in neutral territory.
The DecisionPoint Alert Weekly Wrap presents an end-of-week assessment of the trend and condition of the Stock Market, the U.S. Dollar, Gold, Crude Oil, and Bonds. The DecisionPoint Alert daily report (Monday through Thursday) is abbreviated and gives updates on the Weekly Wrap assessments.
Watch the latest episode of DecisionPoint on StockCharts TV's YouTube channel here!
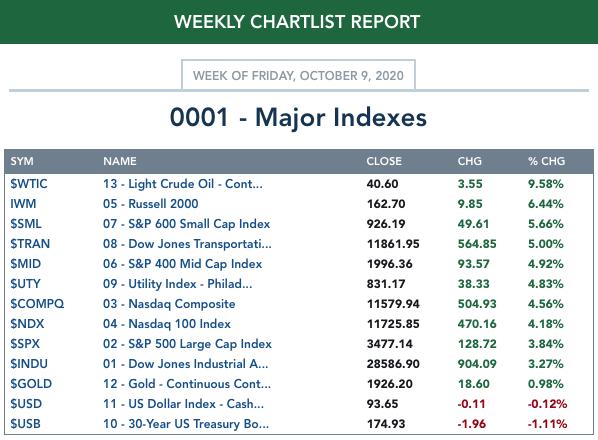
MAJOR MARKET INDEXES
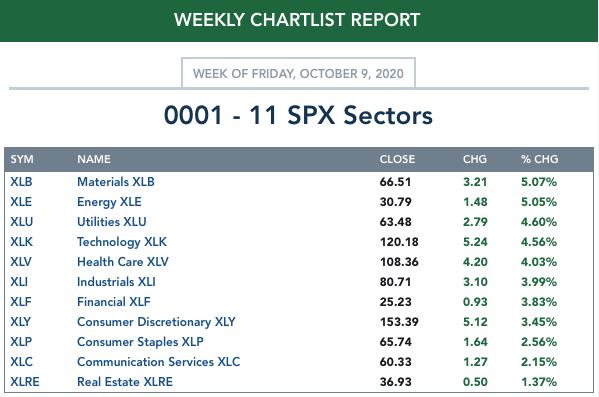
SECTORS
Each S&P 500 Index component stock is assigned to one, and only one, of 11 major sectors. This is a snapshot of the Intermediate-Term (Silver Cross) and Long-Term (Golden Cross) Trend Model signal status for those sectors.

THE MARKET (S&P 500)
IT Trend Model: BUY as of 5/8/2020
LT Trend Model: BUY as of 6/8/2020
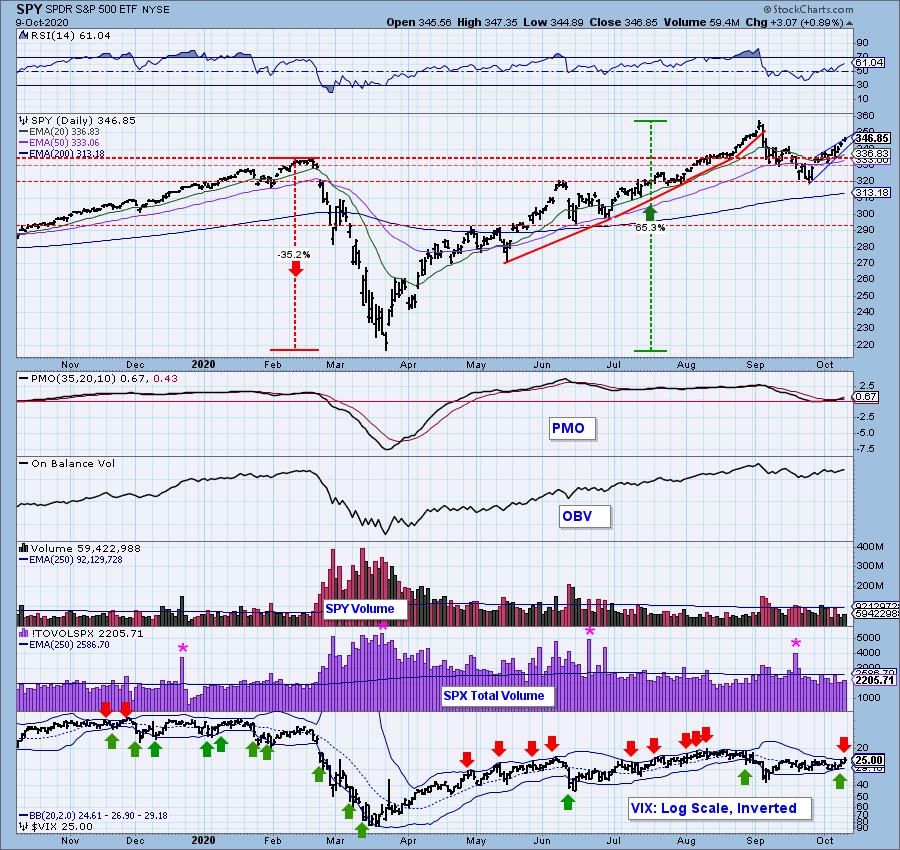
SPY Daily Chart: I've annotated two chart patterns, one bearish and one bullish. The reverse head and shoulders triggered when price broke out above the neckline (annotated in purple). It's minimum upside target would bring us back to all-time highs. However, we also have a bearish rising wedge. The good news is that price actually had an upside breakout from the bearish pattern. I would have no problem adjusting the top of the wedge should we see a decline. The indicators are bullish. The RSI is positive, the PMO is on a BUY signal and rising out of oversold territory and OBV bottoms are rising to confirm the short-term rising trend. There is a problem, but I'll talk about that in the climactic indicators section.
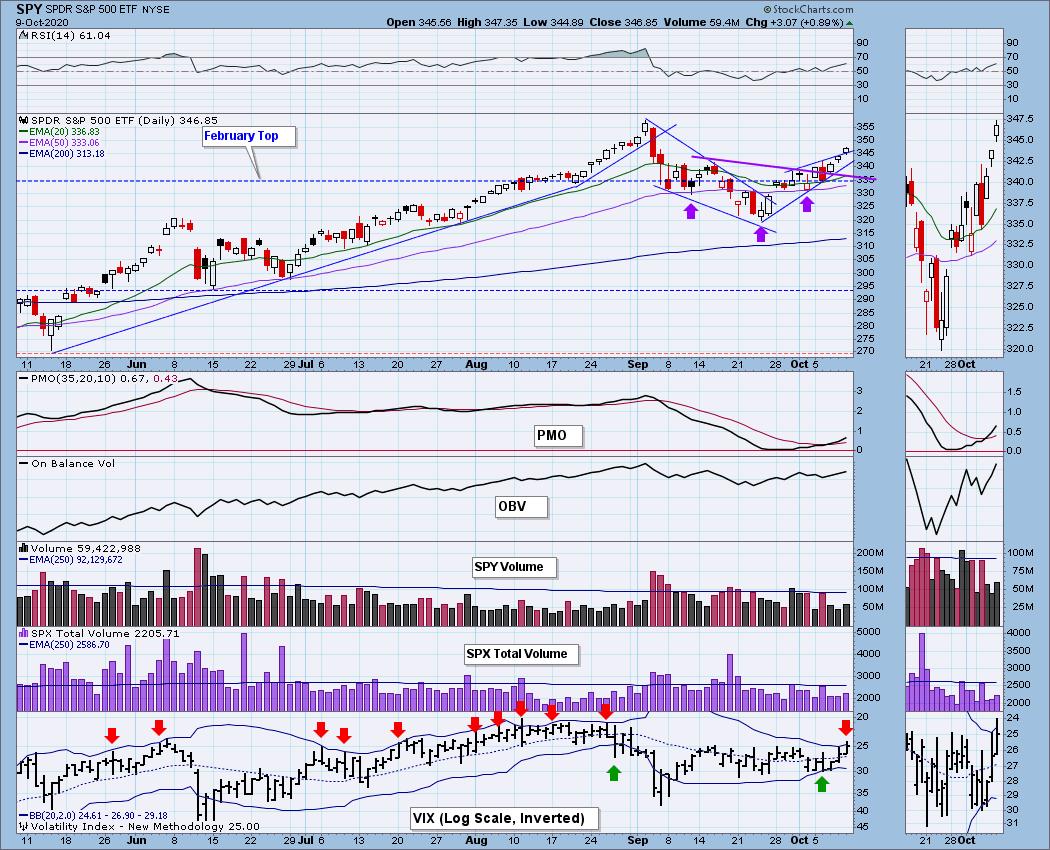
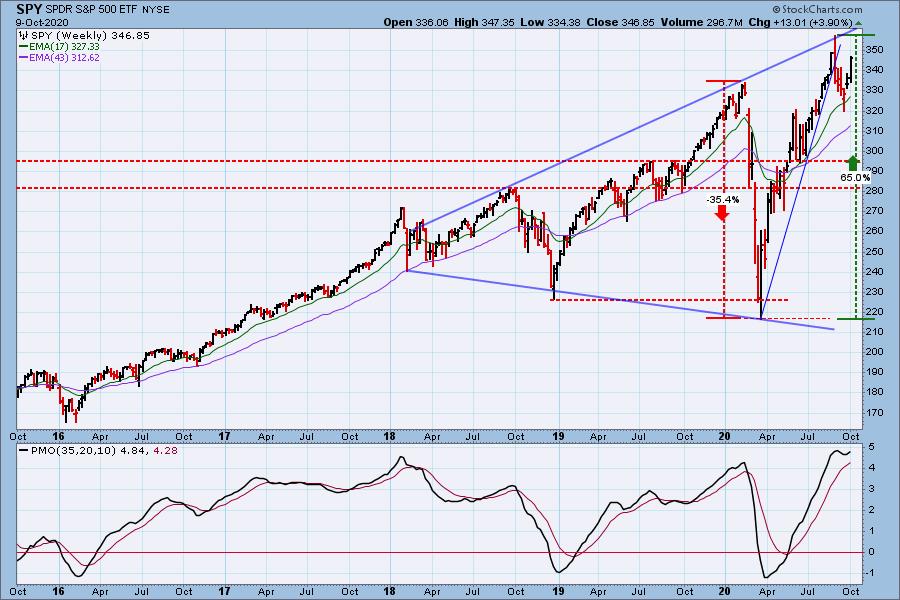
The rising wedge is visible on the one-year daily chart.

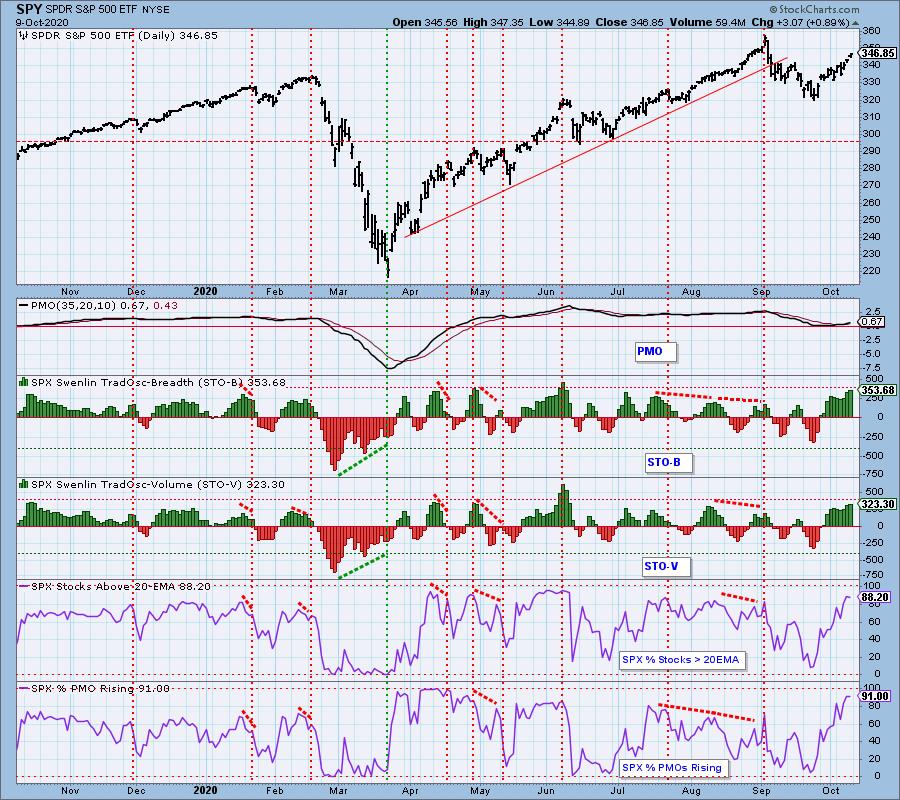
SPY Weekly Chart: The weekly chart is bullish with a PMO bottoming above its signal line. It is still very overbought.
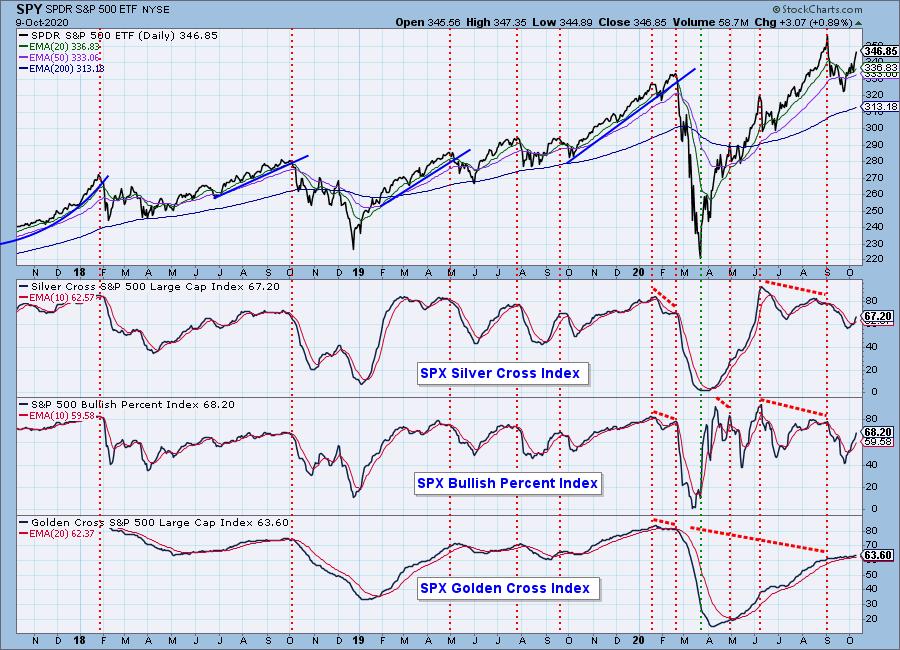
Participation: The following chart uses different methodologies for objectively showing the depth and trend of participation for intermediate- and long-term time frames.
- The Silver Cross Index (SCI) shows the percentage of SPX stocks on IT Trend Model BUY signals (20-EMA > 50-EMA).
- The Golden Cross Index (GCI) shows the percentage of SPX stocks on LT Trend Model BUY signals (50-EMA > 200-EMA).
- The Bullish Percent Index (BPI) shows the percentage of SPX stocks on Point & Figure BUY signals.
This week the SCI and GCI turned up to accompany the BPI which had already been rising. None of these indicators are overbought which is bullish in the intermediate term.
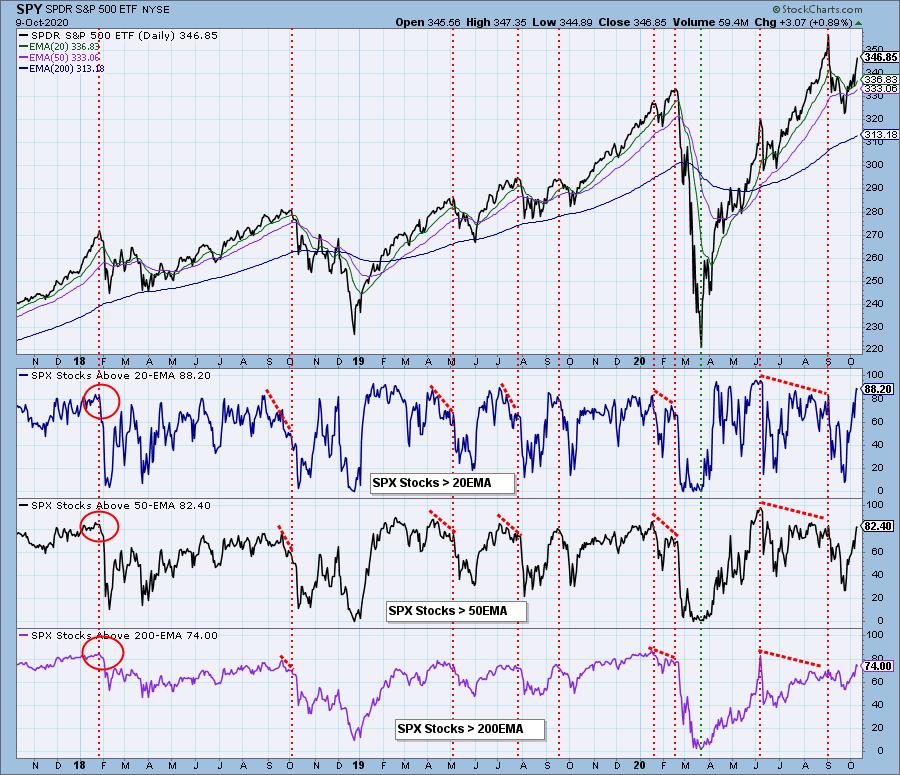
%Stocks indicators are overbought and in the case of %Stocks > 20-EMA, it is extremely overbought. While that can be a bearish situation, it also tells us that there is broad participation in this rally. Broad participation can keep a rally going.
Climactic Market Indicators: No climactic readings on Net A-D, but New Highs are overbought. Additionally, the VIX punctured the upper Bollinger Band on the inverted scale which generally leads to a decline in the very short term.
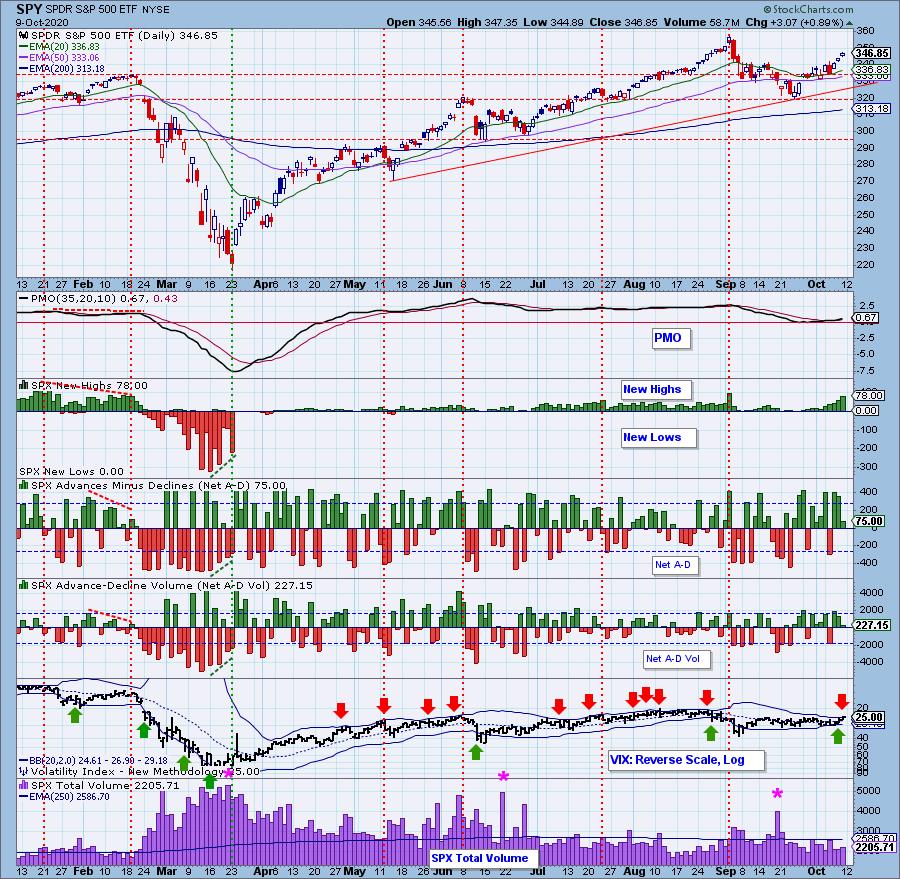
Short-Term Market Indicators: The short-term market trend is UP and the condition is OVERBOUGHT. We are nearing overbought extremes on the STOs, but they are still rising. %Stocks indicators are overbought, but as I mentioned earlier, can also be viewed as participation in the rally.
Intermediate-Term Market Indicators: The intermediate-term market trend is UP and the condition is slightly OVERBOUGHT. The market bias is bullish. As far as this summer goes, the ITBM and ITVM are definitely overbought. However, these indicators have plenty of upside head room before hitting extremes.
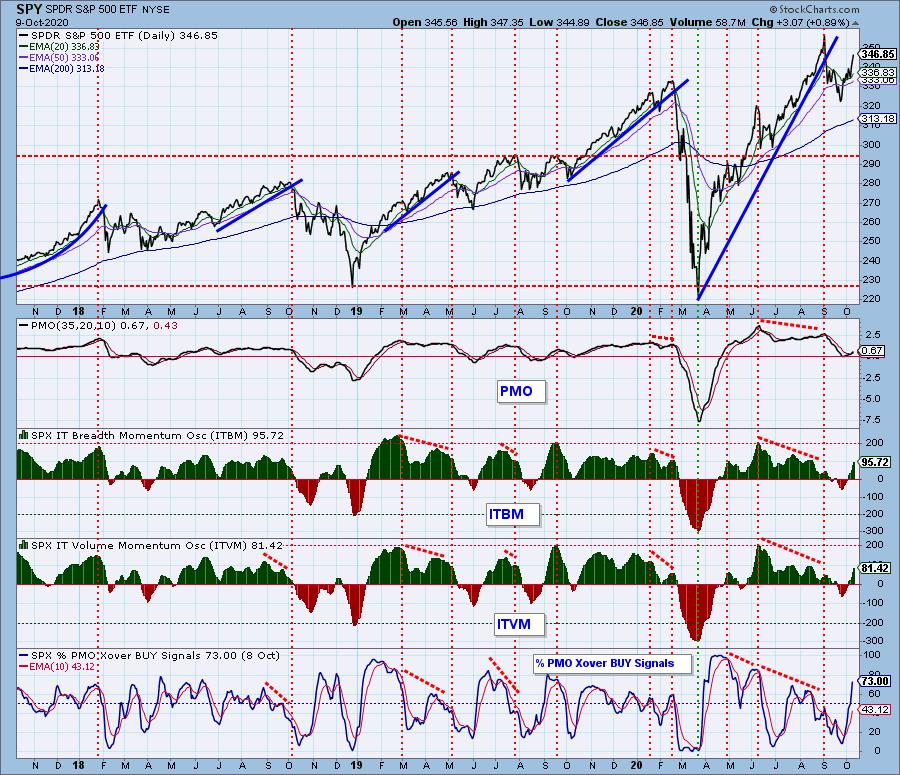
CONCLUSION: The bias is still quite bullish and we have a reverse head and shoulders that executed to the upside suggesting a challenge of all-time highs. At the same time, that bearish rising wedge isn't completely gone. No point in arguing with the bullish bias, but overbought conditions are increasing. When we start to see the STOs and/or ITBM and ITVM begin to decline, that would be warning flag.
Note: Next week is options expiration week. Expect low volatility toward the end of the week while positions are rolled and hedges adjusted.
Have you subscribed the DecisionPoint Diamonds yet? DP does the work for you by providing handpicked stocks/ETFs from exclusive DP scans! Add it with a discount! Contact support@decisionpoint.com for more information!
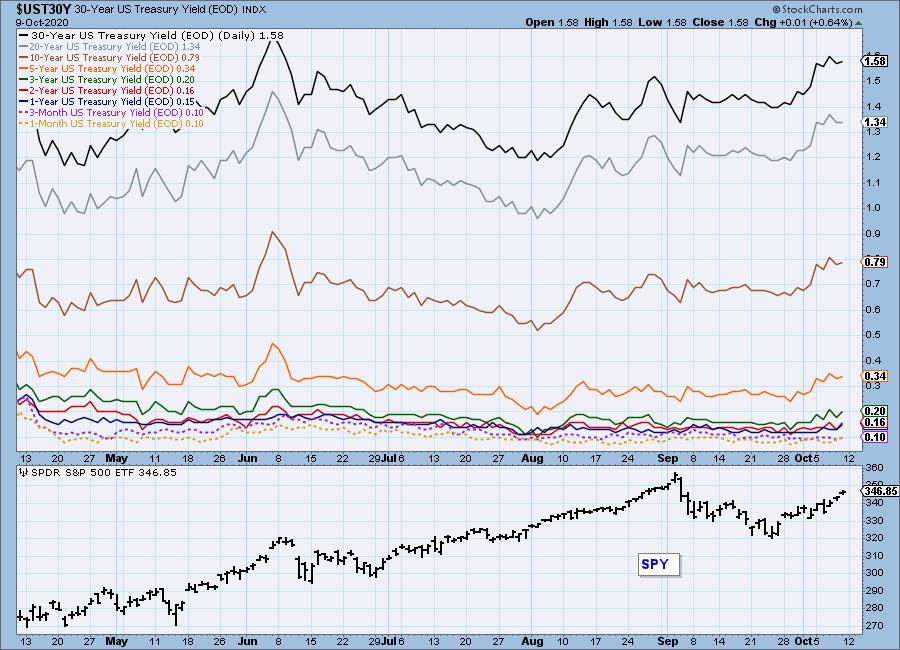
INTEREST RATES
This chart is included so we can monitor rate inversions. In normal circumstances the longer money is borrowed the higher the interest rate that must be paid. When rates are inverted, the reverse is true.
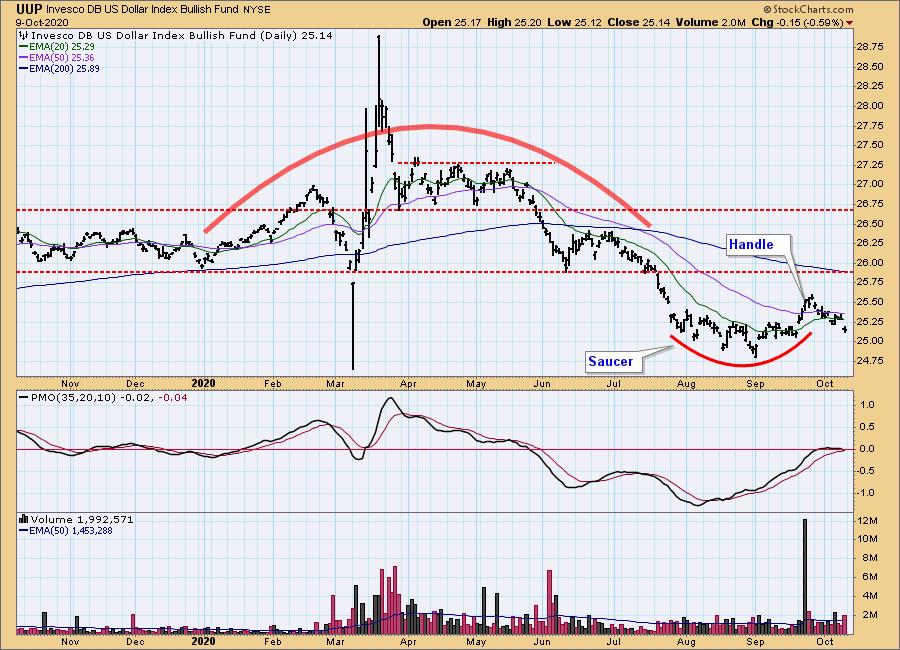
DOLLAR (UUP)
IT Trend Model: NEUTRAL as of 5/28/2020
LT Trend Model: SELL as of 7/10/2020
UUP Daily Chart: It appears that the bullish saucer with handle formation is breaking down, which changes the picture to bearish. The daily PMO is below the zero line and is about to cross down through the signal line, adding to the bearish outlook.
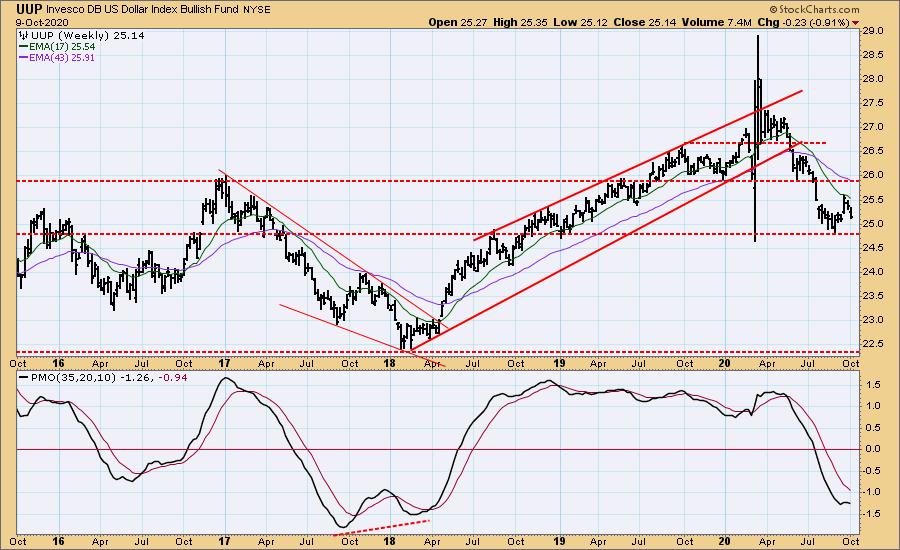
UUP Weekly Chart: The weekly PMO has topped well the zero line, so we should expect the July low to be retested.
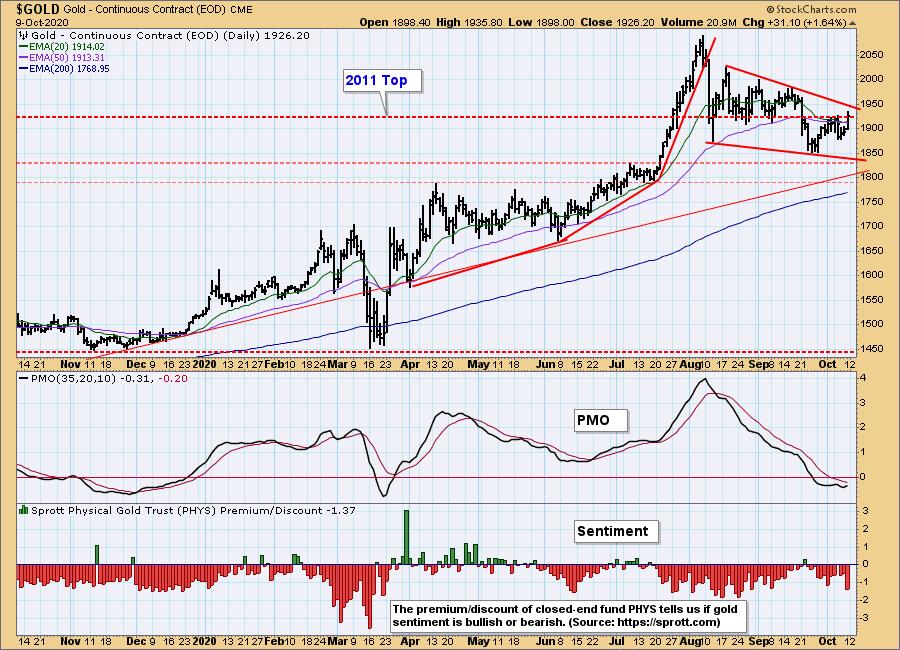
GOLD
IT Trend Model: BUY as of 10/9/2020
LT Trend Model: BUY as of 1/8/2019
GOLD Daily Chart: Because of dollar weakness gold rallied big time today, and the daily PMO turned up. Let's look for the rally to continue next week. Yesterday the IT Trend Model signal changed from BUY to NEUTRAL as the 20EMA crossed down through the 50EMA, but thanks to gold's sharp advance, today the signal reversed back to BUY. We'll need to keep an eye on it, because more price chop could cause more signal whipsaws.
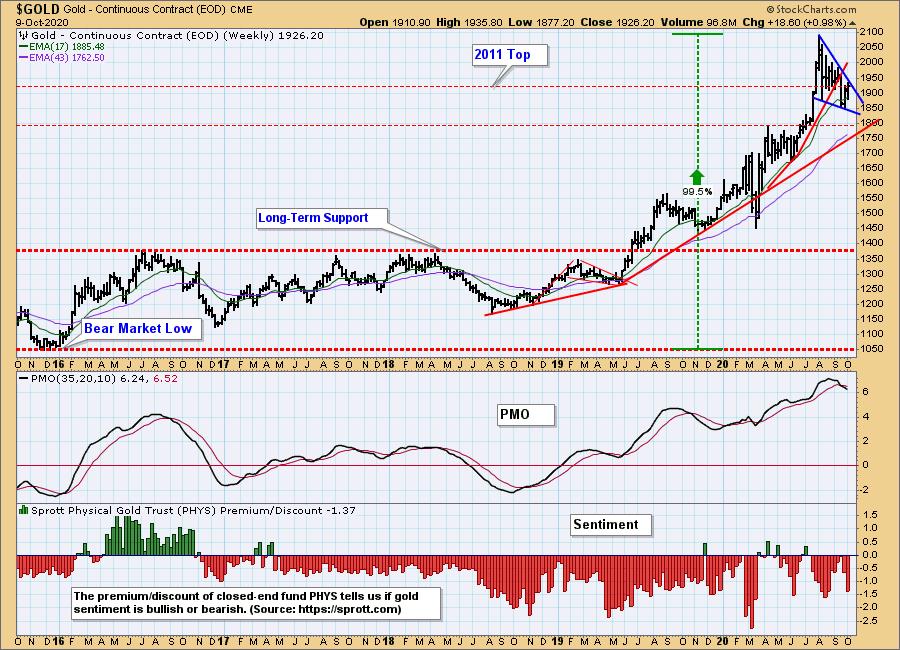
GOLD Weekly Chart: The weekly PMO has a negative crossover in extremely overbought territory. The declining trend continues. I'd give mixed reviews on price action. It's in a bullish falling wedge, but price wasn't able to breakout this week.
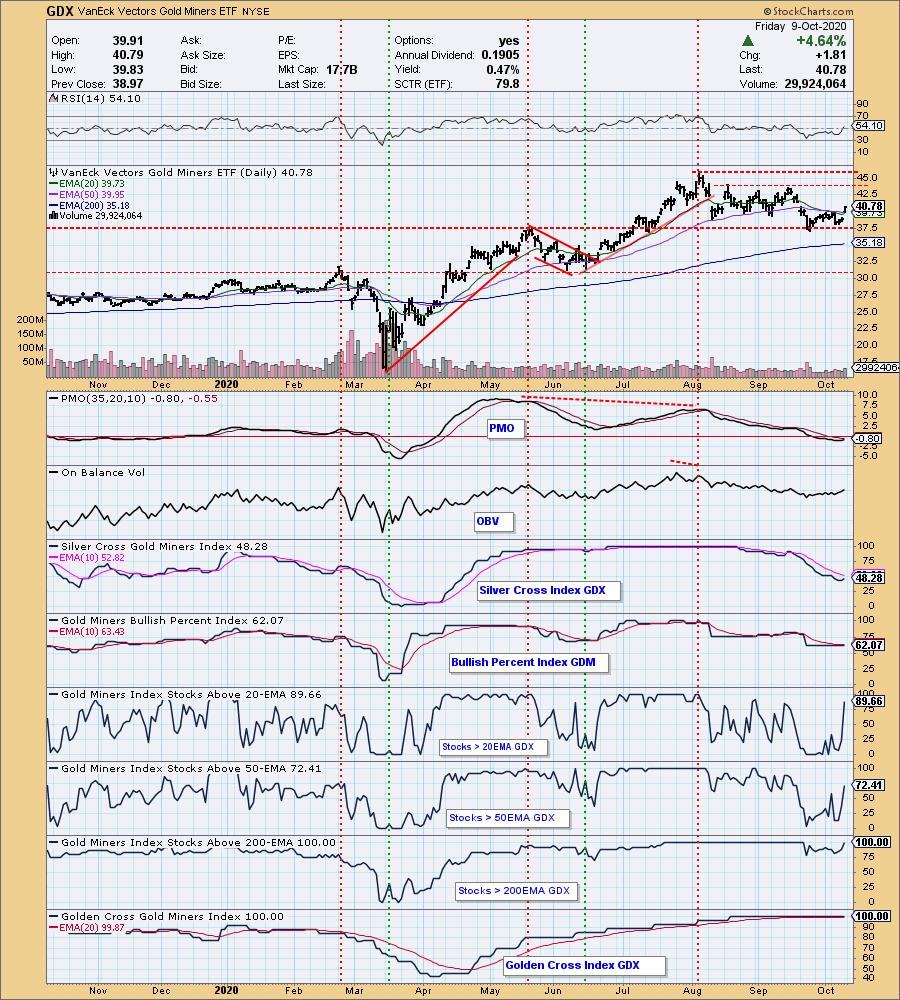
GOLD MINERS Golden and Silver Cross Indexes: Gold Miners woke up with the big rally in Gold today. Price stayed above the 20/50-EMAs all day and above the August lows. It could be an island reversal setting up, but given the internal strength of the Miners (90% have price > 20-EMAs, 100% have 50-EMA > 200-EMA and 100% have price > 200-EMAs), I think it might finally be time for them to retest resistance at the September top.
CRUDE OIL (USO)
IT Trend Model: SELL as of 9/8/2020
LT Trend Model: SELL as of 2/3/2020
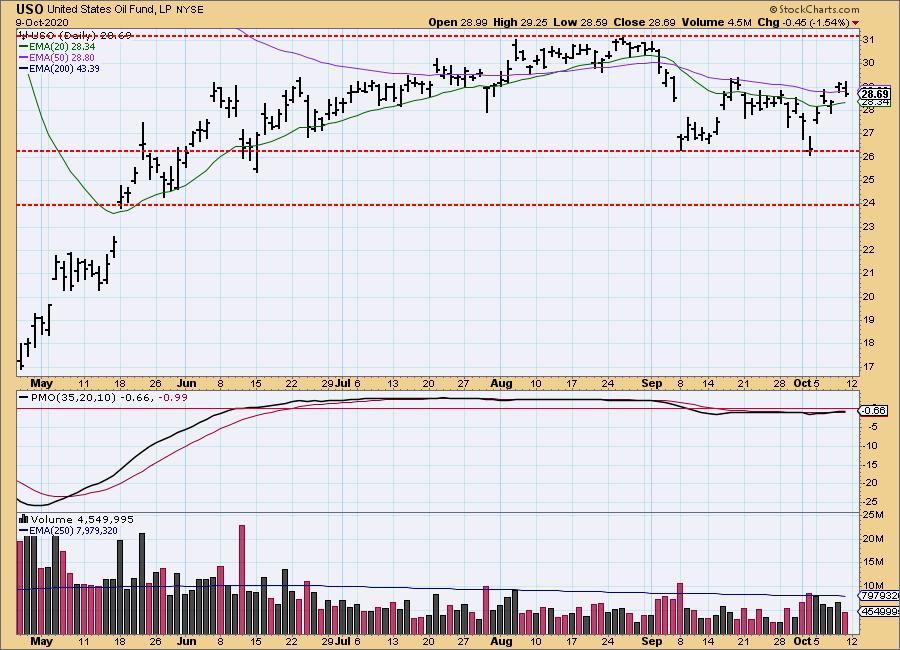
USO Daily Chart: A good week for Oil after testing support at the September low. It could be forming a bullish double-bottom. Problem is price failed at the mid-September top. Best case is a test of the top of the trading range.
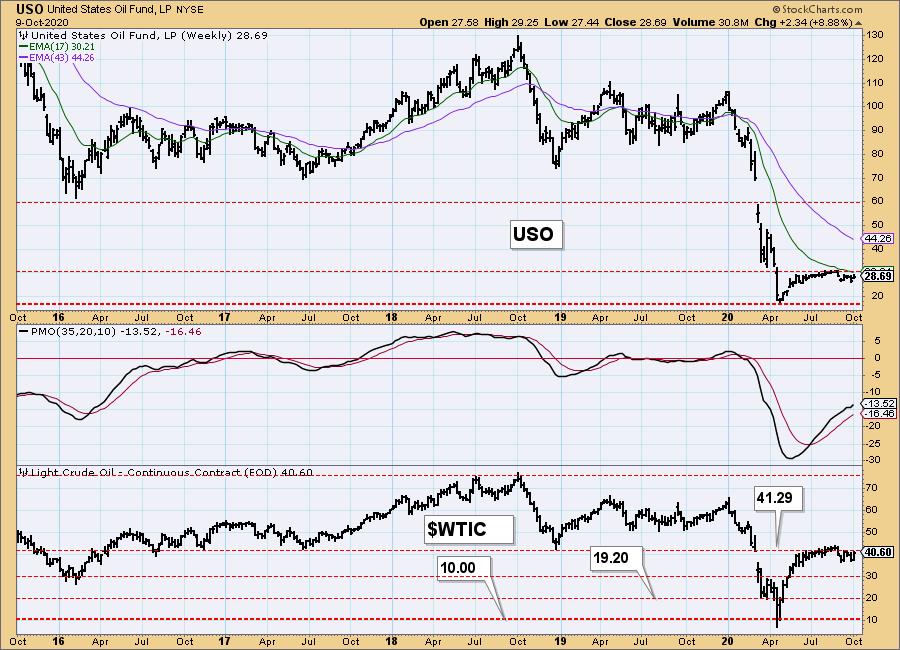
USO/$WTIC Weekly Chart: The weekly PMO is bullish, but price is stuck below resistance and the 17-week EMA.
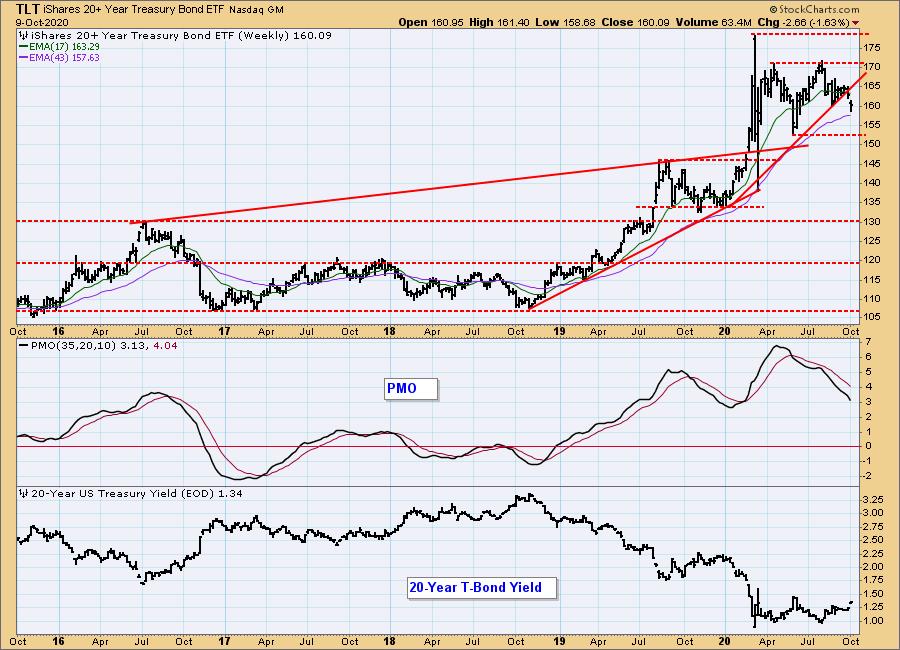
BONDS (TLT)
IT Trend Model: NEUTRAL as of 8/27/2020
LT Trend Model: BUY as of 1/2/2019
TLT Daily Chart: The 200-EMA continues to hold up, but so does overhead resistance. The PMO is declining. Best case is an island reversal.
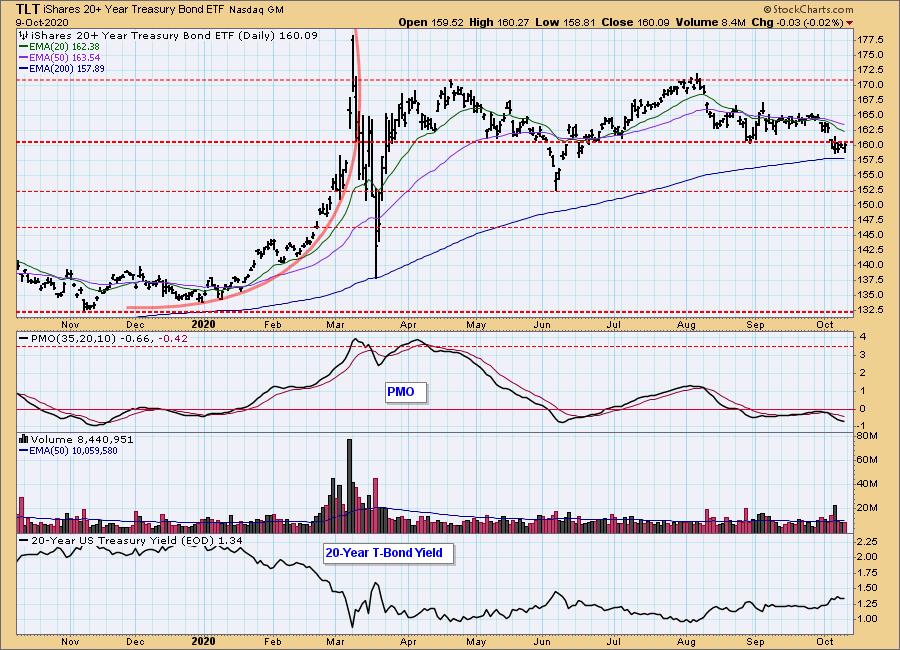
TLT Weekly Chart: The weekly chart looks especially bearish. The PMO is falling vertically lower. The past two weeks has seen a breakdown of the intermediate-term rising trend. If we see a breakdown below the 43-week EMA, we could be looking at a big double-top that would execute at the $152 area.
Technical Analysis is a windsock, not a crystal ball.
Happy Charting! - Carl & Erin
Disclaimer: This blog is for educational purposes only and should not be construed as financial advice. The ideas and strategies should never be used without first assessing your own personal and financial situation, or without consulting a financial professional. Any opinions expressed herein are solely those of the author, and do not in any way represent the views or opinions of any other person or entity.
NOTE: The signal status reported herein is based upon mechanical trading model signals, specifically, the DecisionPoint Trend Model. They define the implied bias of the price index based upon moving average relationships, but they do not necessarily call for a specific action. They are information flags that should prompt chart review. Further, they do not call for continuous buying or selling during the life of the signal. For example, a BUY signal will probably (but not necessarily) return the best results if action is taken soon after the signal is generated. Additional opportunities for buying may be found as price zigzags higher, but the trader must look for optimum entry points. Conversely, exit points to preserve gains (or minimize losses) may be evident before the model mechanically closes the signal.
Helpful DecisionPoint Links:
DecisionPoint Alert Chart List
DecisionPoint Golden Cross/Silver Cross Index Chart List
DecisionPoint Sector Chart List
Price Momentum Oscillator (PMO)
Swenlin Trading Oscillators (STO-B and STO-V)