
The Swenlin Trading Oscillators (STOs) are short-term indicators and not part of our "Climactic Indicator" suite. However that doesn't mean that they can't have climactic readings.
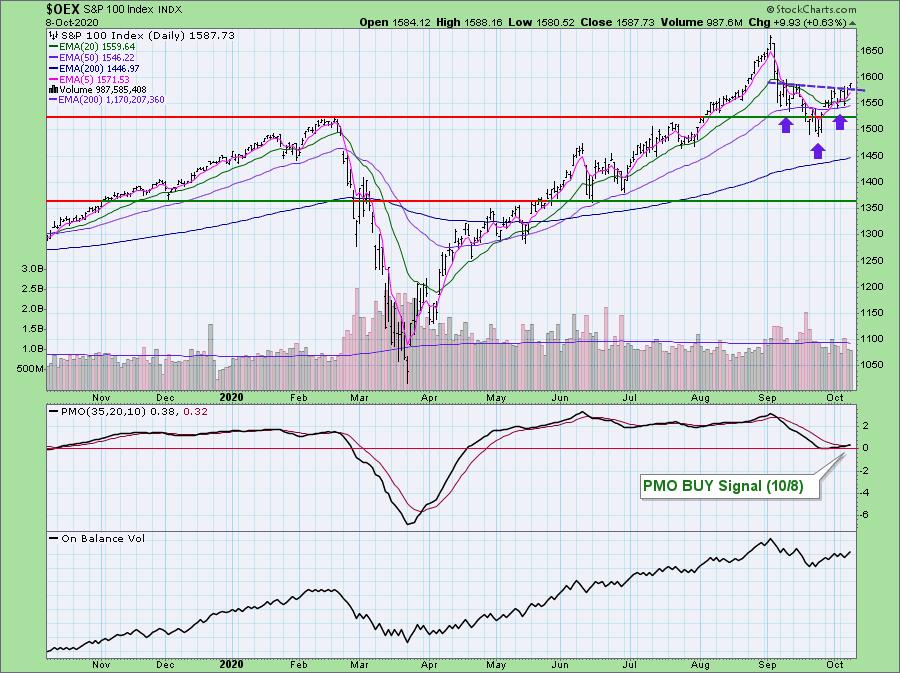
The OEX was the only DP Scoreboard index not to get a new PMO BUY signal yesterday. It triggered today. You'll note on the OEX there is a bullish reverse head and shoulders, similar to the SPY. Today price broke above the neckline of the pattern. The height of the pattern would suggest a minimum upside target at the all-time high.

It's Free!
***Click here to register for this recurring free DecisionPoint Trading Room on Mondays at Noon ET!***
Did you miss the 10/5 trading room? Here is a link to the recording (password: J942MF*c). For best results, copy and paste the password to avoid typos.
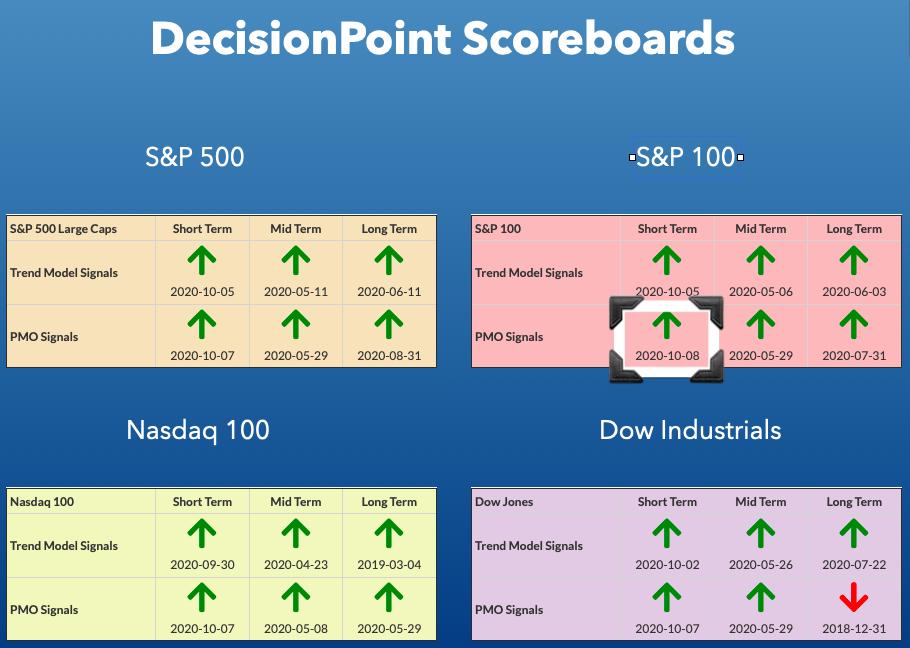
DP INDEX SCOREBOARDS:
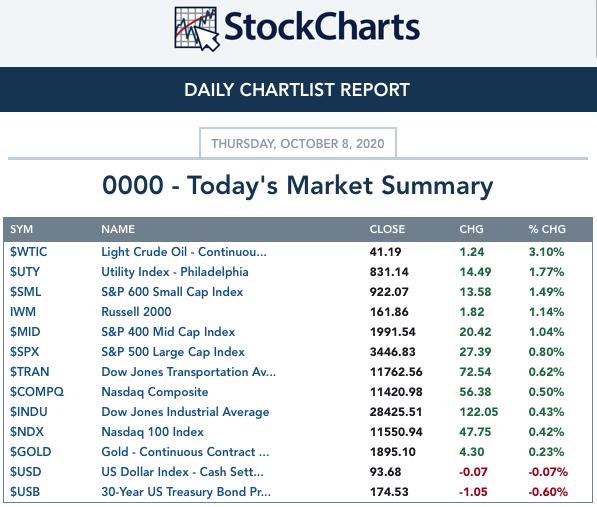
TODAY'S Broad Market Action:
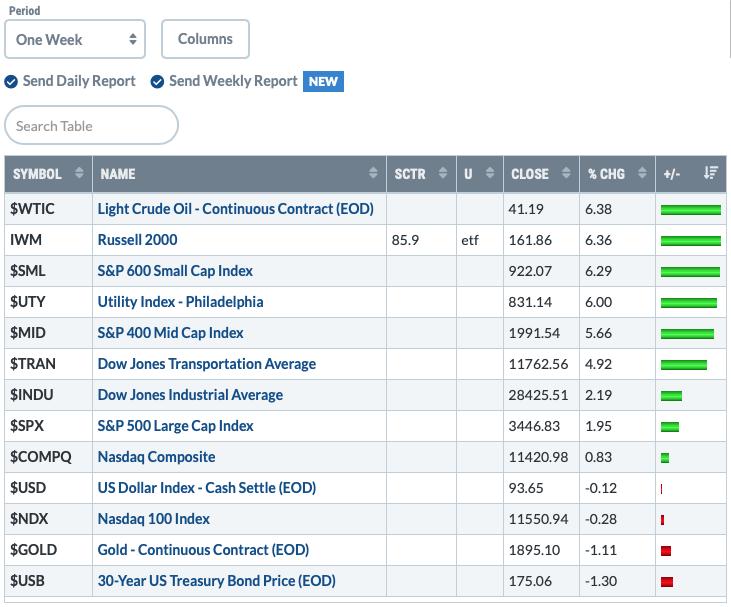
One WEEK Results:
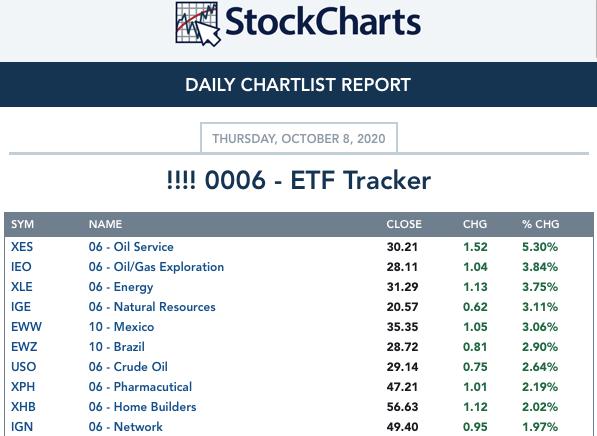
Top 10 from ETF Tracker:
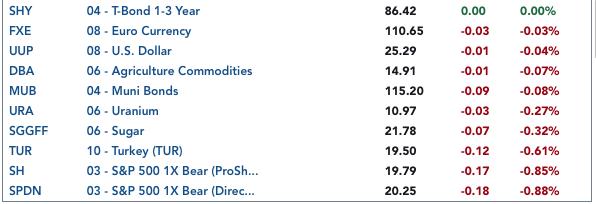
Bottom 10 from ETF Tracker:
On Friday, the DecisionPoint Alert Weekly Wrap presents an assessment of the trend and condition of the stock market (S&P 500), the U.S. Dollar, Gold, Crude Oil, and Bonds. Monday through Thursday the DecisionPoint Alert daily report is abbreviated and covers changes for the day.
Watch the latest episode of DecisionPoint on StockCharts TV's YouTube channel here!
SECTORS
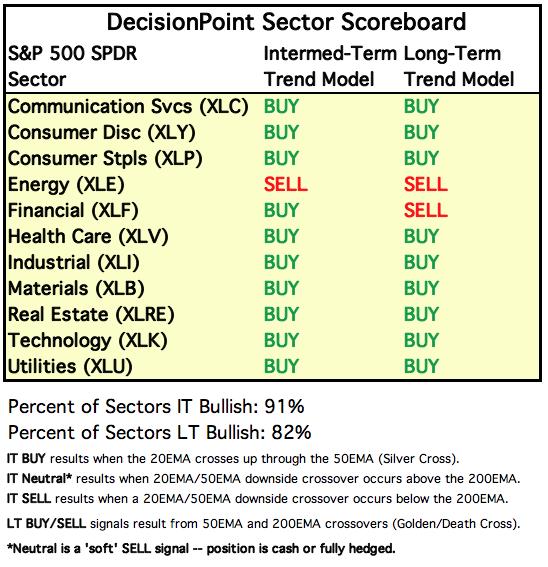
SIGNALS:
Each S&P 500 Index component stock is assigned to one, and only one, of 11 major sectors. This is a snapshot of the Intermediate-Term (Silver Cross) and Long-Term (Golden Cross) Trend Model signal status for those sectors.
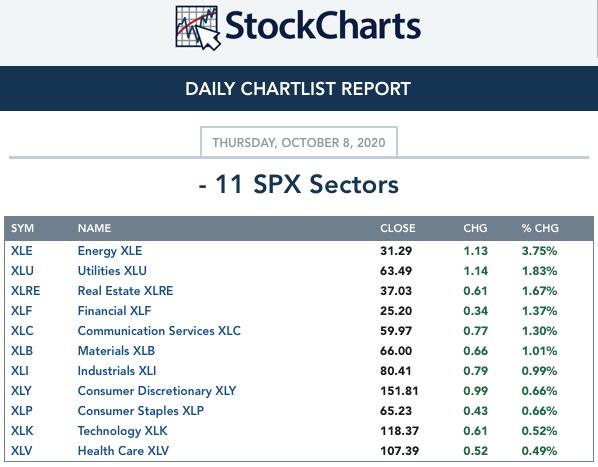
TODAY'S RESULTS:
One WEEK Results: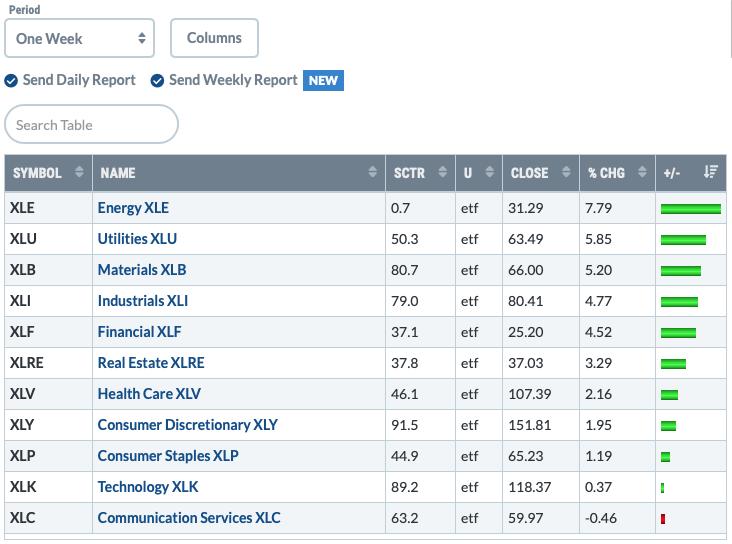
STOCKS
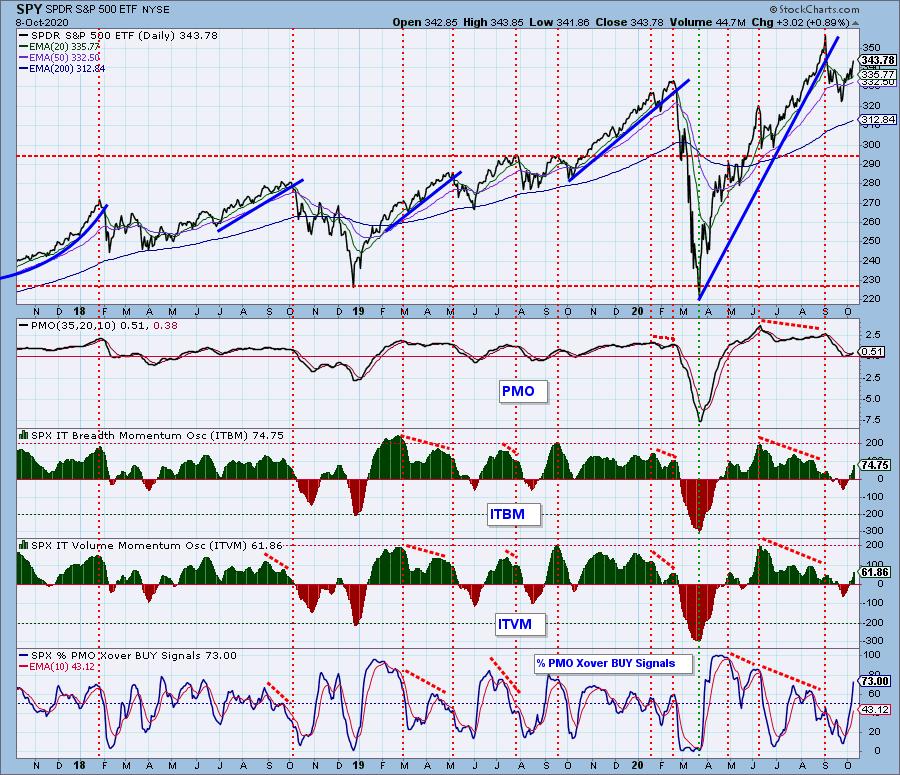
IT Trend Model: BUY as of 5/8/2020
LT Trend Model: BUY as of 6/8/2020
SPY Daily Chart: You'll see a similar bullish reverse head and shoulders on the SPY. The neckline was broken yesterday. We have a recent PMO BUY signal and the RSI is staying in positive territory.
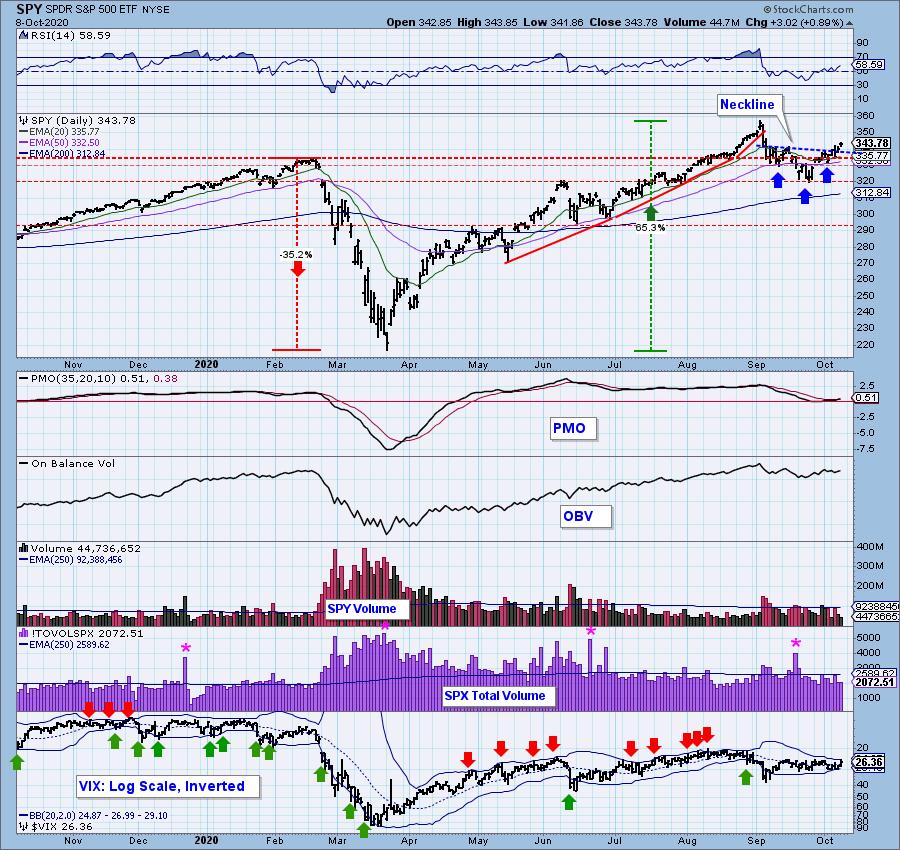
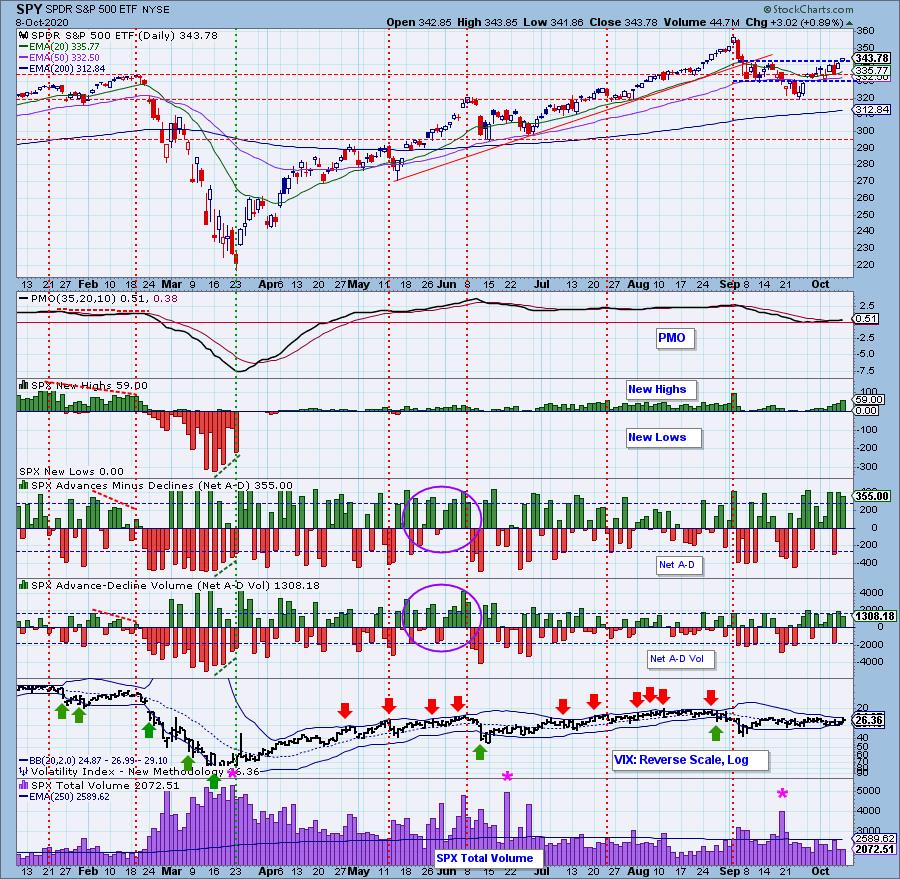
Climactic Market Indicators: Again with the climactic readings! They dropped slightly, but New Highs continue to gain. As I've been noting, the VIX has been squeezed so tightly by the Bollinger Bands, that it isn't particularly helpful. But, we did see readings nearly puncture the upper Band which we consider bearish for the next day or two. Given the bullish bias, I'm not going to look at this as an exhaustion. I'm not going to look at it as an initiation impulse as we've been on a rising trend. I consider it a sign of strength for the time being. Breadth looks very similar to the end of May and beginning of June which did lead up to a big decline so stay alert.
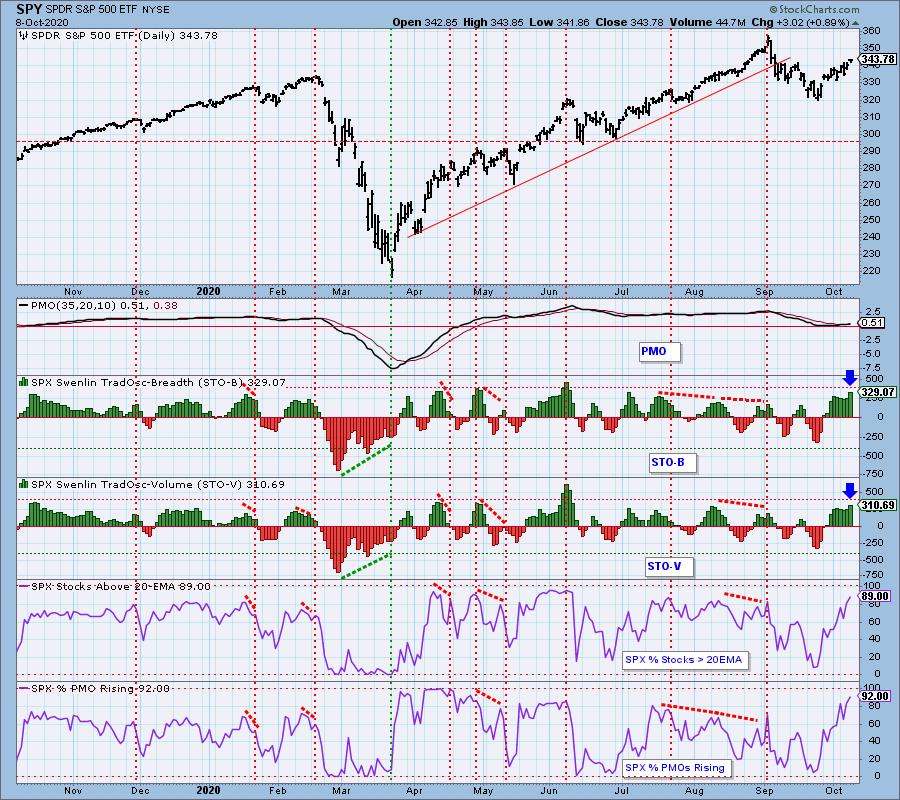
Short-Term Market Indicators: The short-term market trend is UP and the condition is OVERBOUGHT. Based upon the STO ranges, market bias is BULLISH.
I did a double-take when I saw this chart. We already were looking at readings on both these indicators that were overbought, and now we have an even higher spike. We've seen price tops after these types of pops on the STOs. However, we usually get a day or two of decline on them before the drop. %Stocks indicators are getting quite overbought too.
Intermediate-Term Market Indicators: The following chart uses different methodologies for objectively showing the depth and trend of participation for intermediate- and long-term time frames.
- The Silver Cross Index (SCI) shows the percentage of SPX stocks on IT Trend Model BUY signals (20-EMA > 50-EMA).
- The Golden Cross Index (GCI) shows the percentage of SPX stocks on LT Trend Model BUY signals (50-EMA > 200-EMA).
- The Bullish Percent Index (BPI shows the percentage of SPX stocks on Point & Figure BUY signals.
All of these indicators are rising which is bullish for the intermediate term.
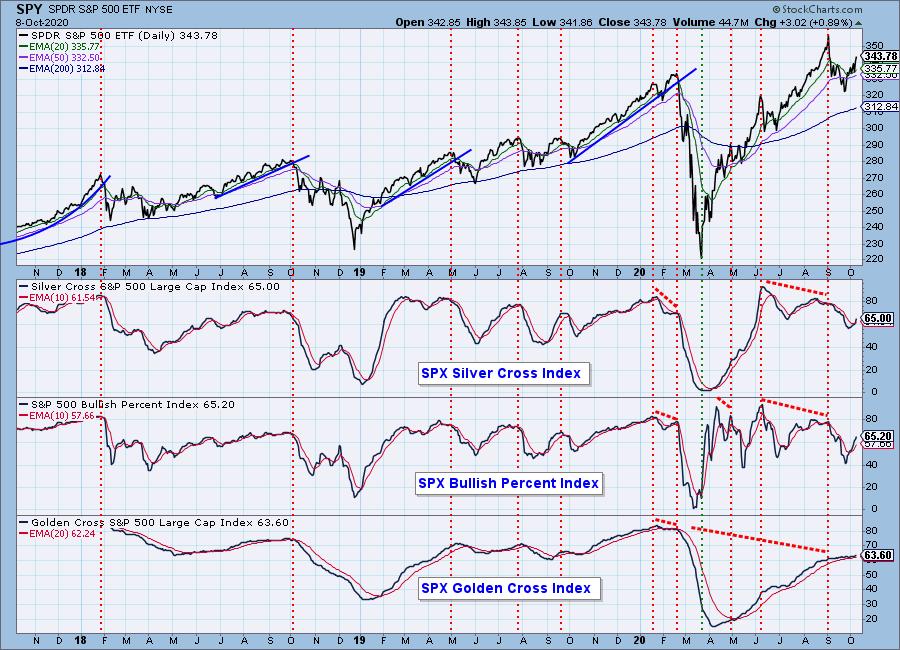
The intermediate-term market trend is DOWN and the condition is NEUTRAL. The market bias is BULLISH.
Nice upside move on these indicators. They are not overbought yet and rising strongly. %Stocks with PMO crossover BUY signals is rising strongly which tells us that almost 3/4 of the SP500 have positive momentum.
CONCLUSION: Climactic readings continue and so does the strong bullish bias. The pop on the STOs is very positive, for now. When these indicators begin to back off, consider it a warning.
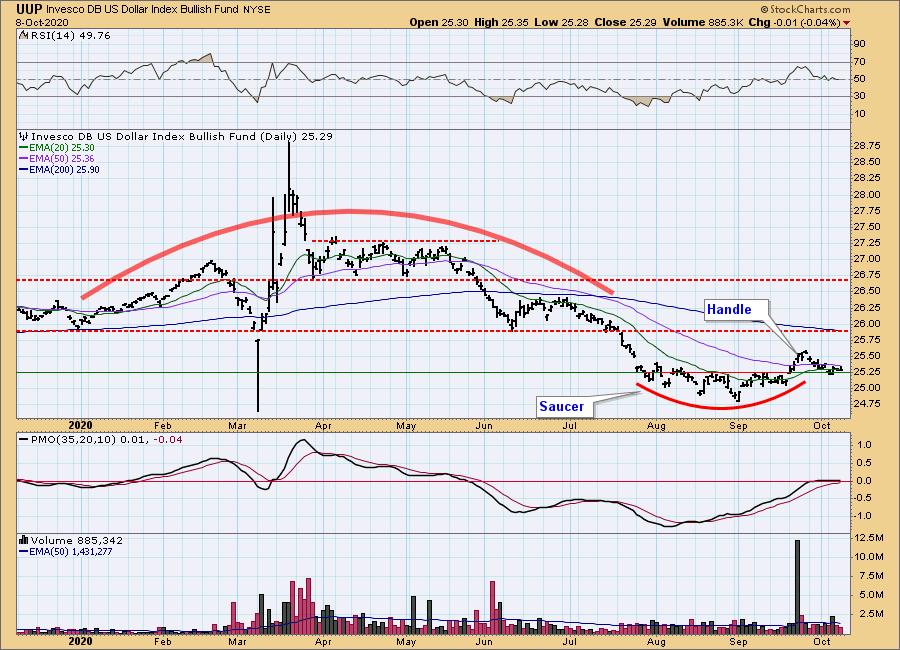
DOLLAR (UUP)
IT Trend Model: NEUTRAL as of 5/28/2020
LT Trend Model: SELL as of 7/10/2020
UUP Daily Chart: Yesterday's comments still apply:
"The cup and handle pattern continues to mature. The expectation is an upside breakout. The PMO has reached positive territory and the RSI is back in positive territory. I'll be watching to see if the declining tops trendline that forms the "handle" in the pattern is penetrated. That could finally trigger this pattern."
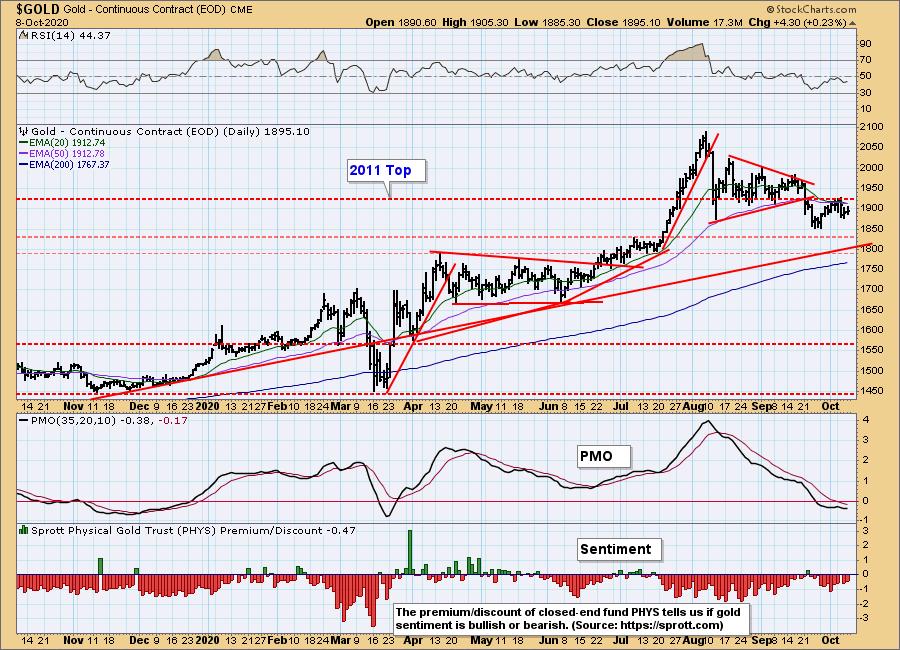
GOLD
IT Trend Model: BUY as of 3/24/2020
LT Trend Model: BUY as of 1/8/2019
GOLD Daily Chart: Gold remains underneath overhead resistance at the 2011 top. We are still seeing discounts on PHYS and that is bullish for Gold. However, given the bullish pattern on the Dollar, I'm not expecting Gold to breakout here.
Full Disclosure: I own GLD.
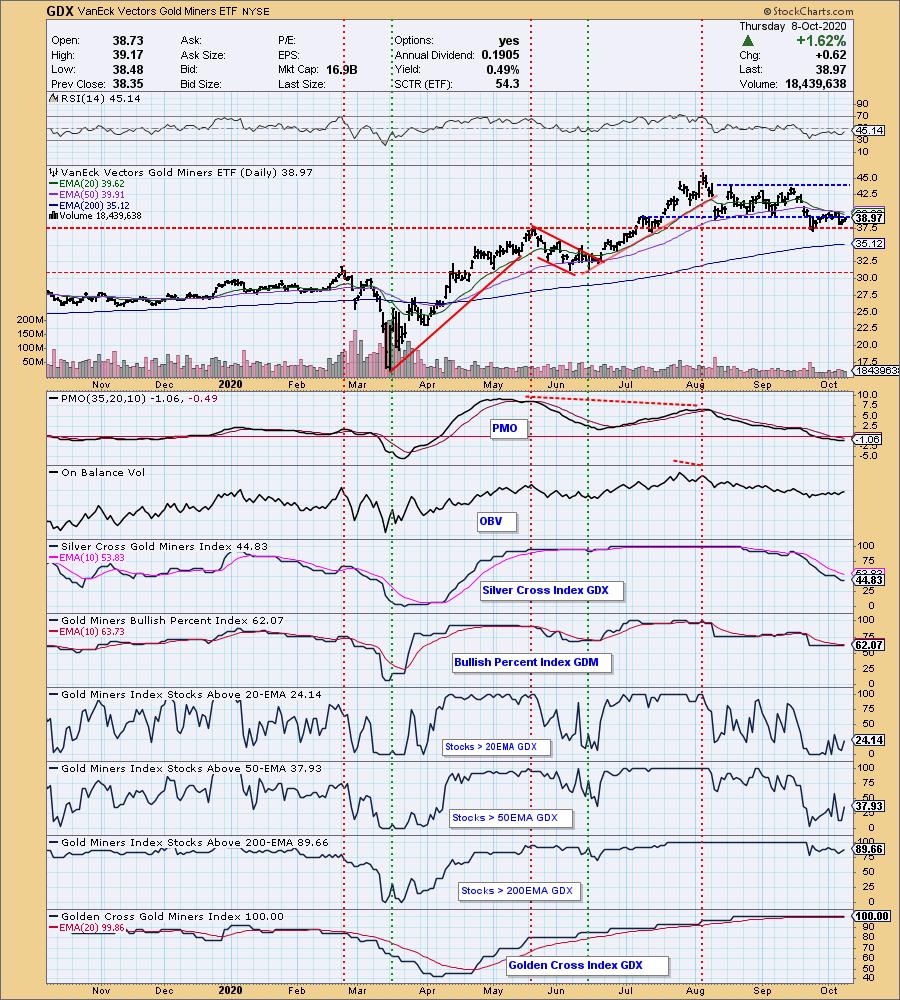
GOLD MINERS Golden and Silver Cross Indexes: Miners rallied again today, but can't overcome resistance yet. Long-term indicators (GCI and %Stocks > 200-EMAs) are still positive. The good news is this is a very strong area of support. We have very oversold readings on %Stocks > 20/50-EMAs and they are now rising.
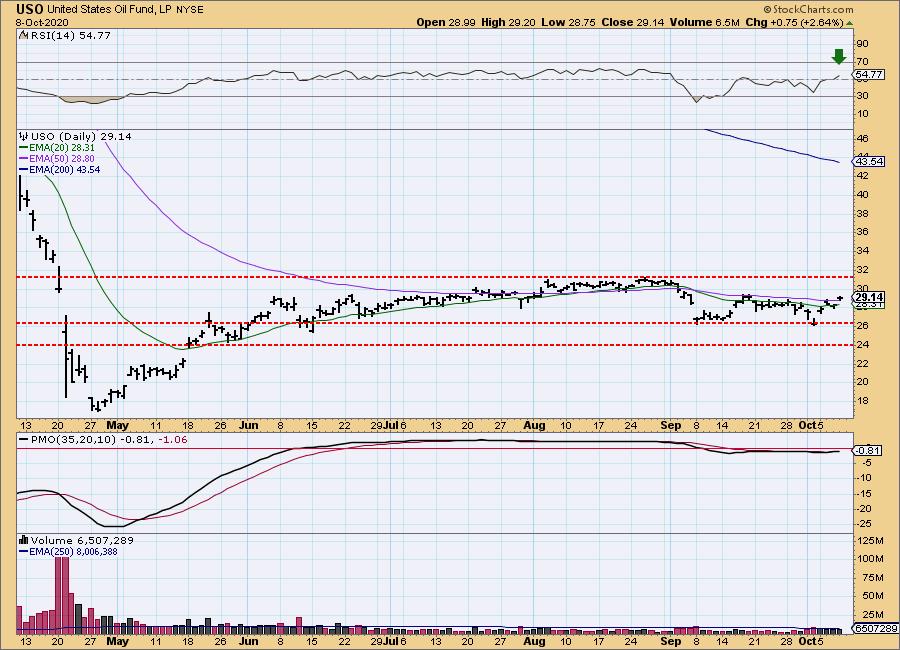
CRUDE OIL (USO)
IT Trend Model: SELL as of 9/8/2020
LT Trend Model: SELL as of 2/3/2020
USO Daily Chart: Oil continues to rally, but it hasn't quite overcome resistance at the September top. It did get above the 50-EMA and we are finally seeing a positive RSI.
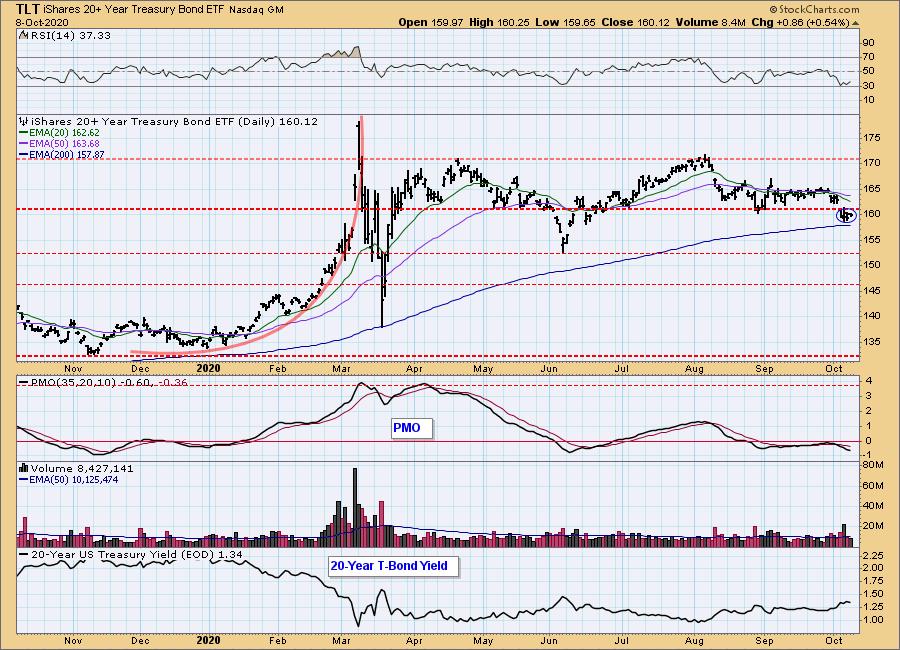
BONDS (TLT)
IT Trend Model: Neutral as of 8/27/2020
LT Trend Model: BUY as of 1/2/2019
TLT Daily Chart: Bonds have formed an island which is a reversal pattern. Price did hold the 200-EMA as support, but the PMO and RSI are very negative.
Full disclosure: I own TLT.
Have you subscribed the DecisionPoint Diamonds yet? DP does the work for you by providing handpicked stocks/ETFs from exclusive DP scans! Get in on the new "DecisionPoint Diamond Mine" trading room that is part of that subscription! Contact support@decisionpoint.com for more information!
Technical Analysis is a windsock, not a crystal ball.
Happy Charting! - Erin
Email: erin@decisionpoint.com
NOTE: The signal status reported herein is based upon mechanical trading model signals, specifically, the DecisionPoint Trend Model. They define the implied bias of the price index based upon moving average relationships, but they do not necessarily call for a specific action. They are information flags that should prompt chart review. Further, they do not call for continuous buying or selling during the life of the signal. For example, a BUY signal will probably (but not necessarily) return the best results if action is taken soon after the signal is generated. Additional opportunities for buying may be found as price zigzags higher, but the trader must look for optimum entry points. Conversely, exit points to preserve gains (or minimize losses) may be evident before the model mechanically closes the signal.
Helpful DecisionPoint Links (Can Be Found on DecisionPoint.com Links Page):
DecisionPoint Shared ChartList and DecisionPoint Chart Gallery
Price Momentum Oscillator (PMO)