
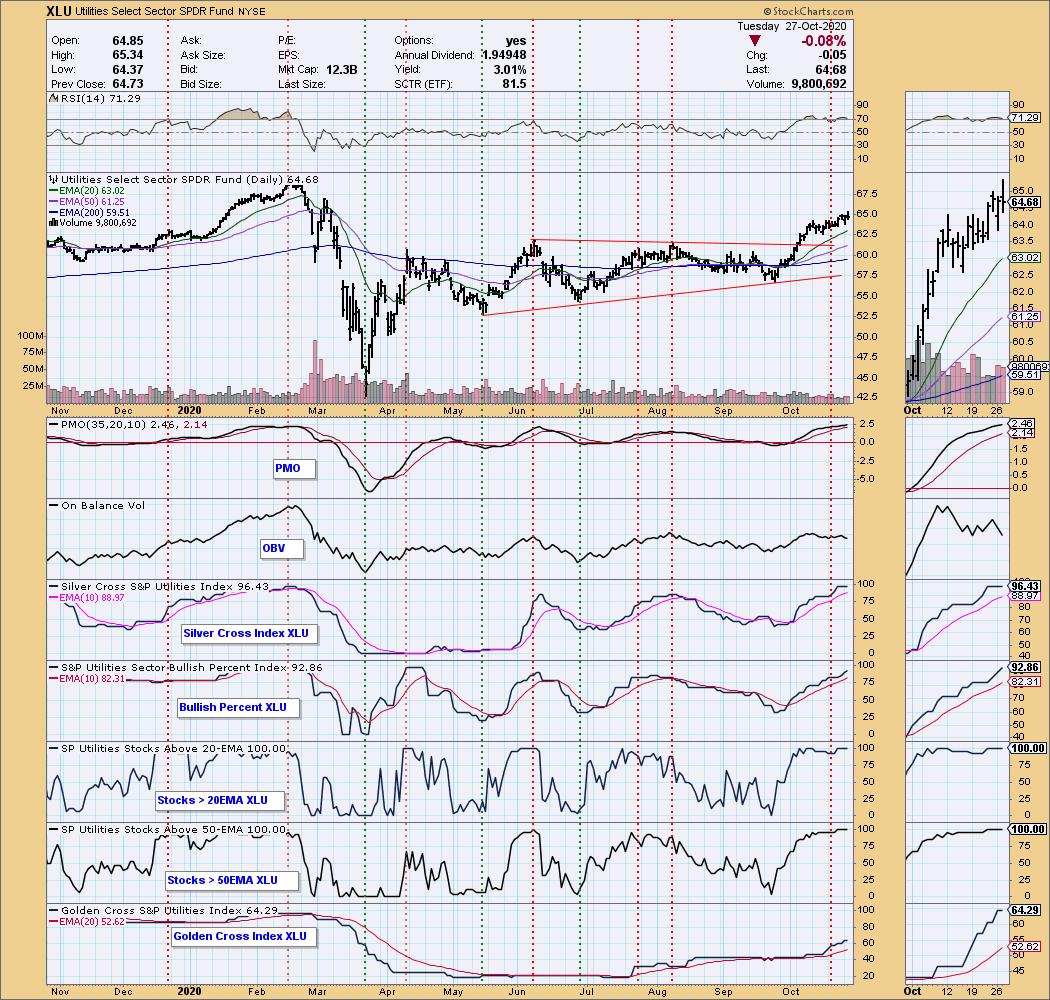
As our Bundle subscribers know, I write the DP Diamonds Report before I write the DP Alert because the calculation-intense indicators take longer to update. I do find it helpful to identify where strength is building in the market by running my Diamond scans and analyzing the results. Today, the Utilities Sector SPDR (XLU) appeared on one of my scans. Looking at the DP sector chart, we can see the strength behind that sector. 100% have price above their 20-EMA and 100% have price above their 50-EMA. You need that kind of strength to fuel a rally. However, the SCI, BPI, RSI and PMO are all very overbought. I still like this sector, just be aware that its indicators are extremely overbought and it could turn.
The DecisionPoint Alert Weekly Wrap presents an end-of-week assessment of the trend and condition of the Stock Market, the U.S. Dollar, Gold, Crude Oil, and Bonds. The DecisionPoint Alert daily report (Monday through Thursday) is abbreviated and gives updates on the Weekly Wrap assessments.
Watch the latest episode of DecisionPoint on StockCharts TV's YouTube channel here!
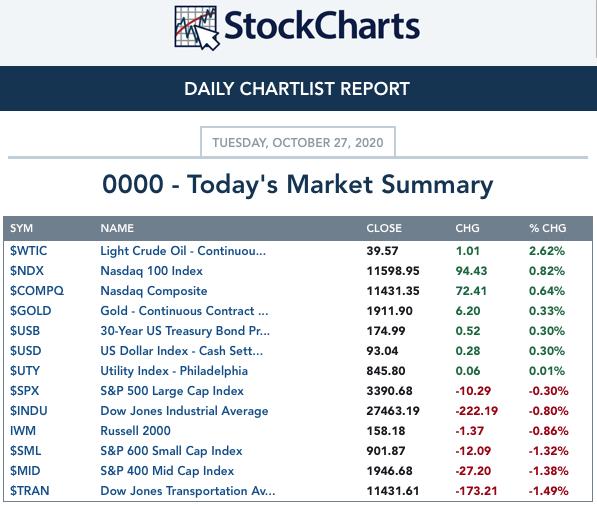
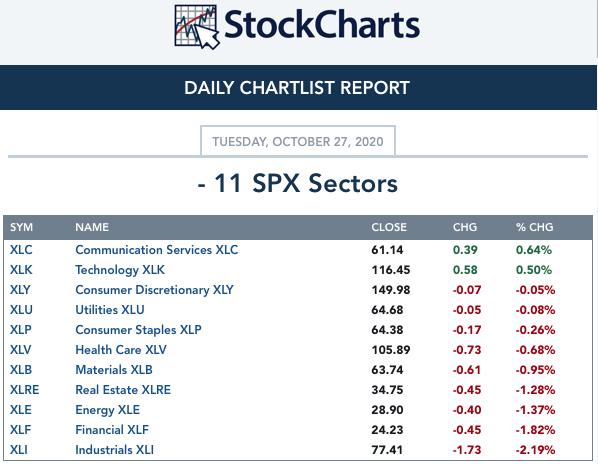
MAJOR MARKET INDEXES
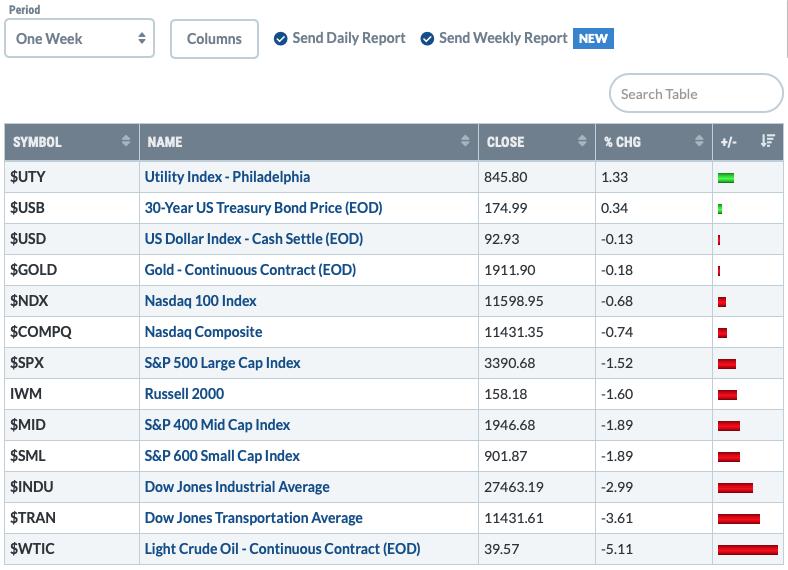
One Week Results:
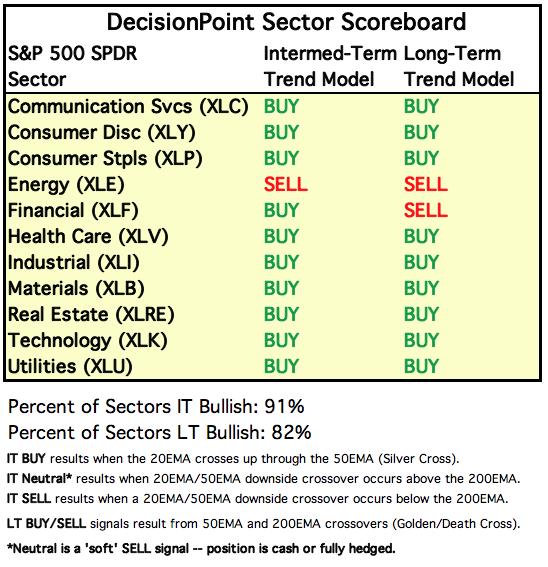
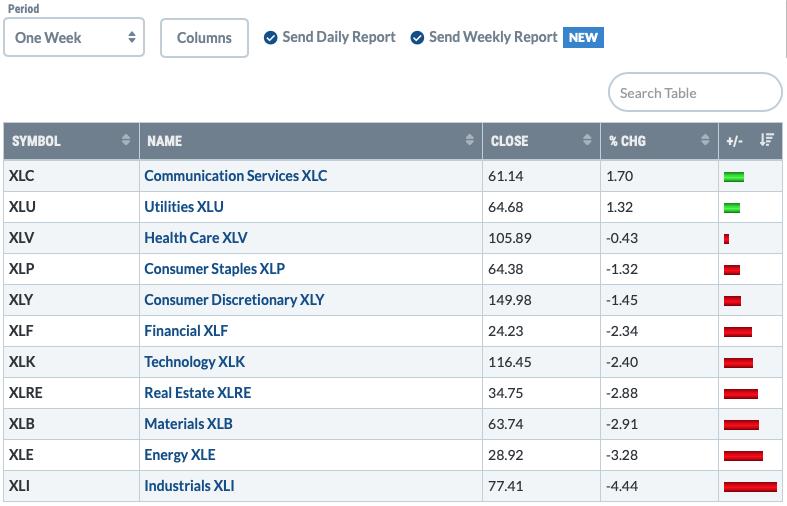
SECTORS
Each S&P 500 Index component stock is assigned to one, and only one, of 11 major sectors. This is a snapshot of the Intermediate-Term (Silver Cross) and Long-Term (Golden Cross) Trend Model signal status for those sectors.
One Week Results:
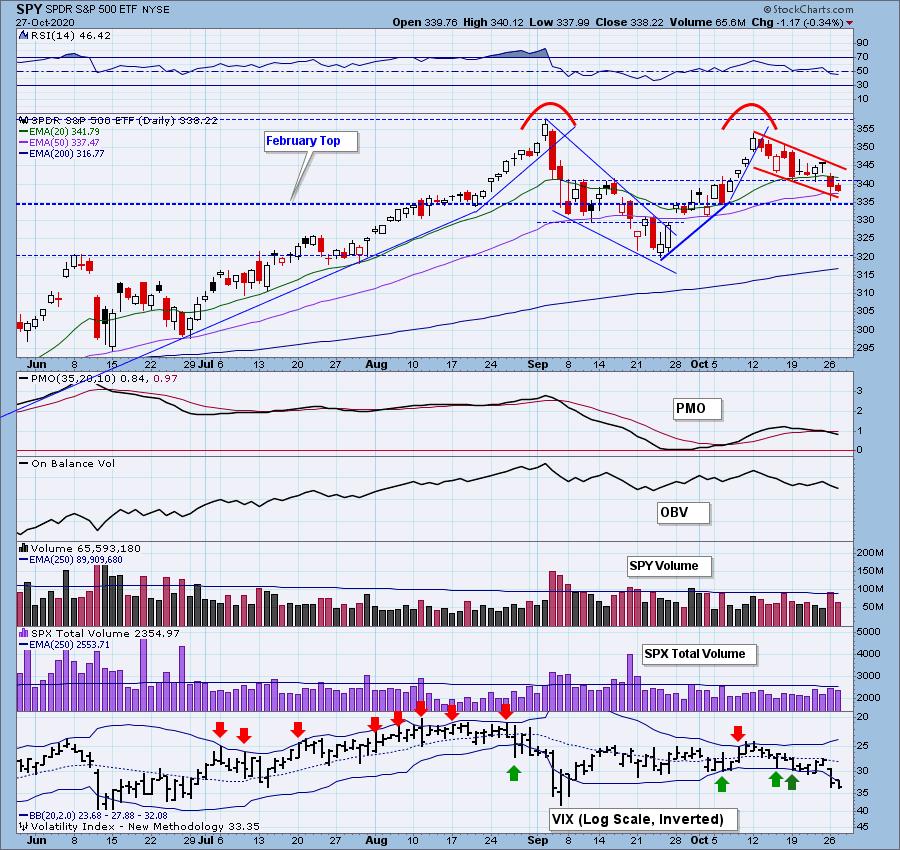
THE MARKET (S&P 500)
IT Trend Model: BUY as of 5/8/2020
LT Trend Model: BUY as of 6/8/2020
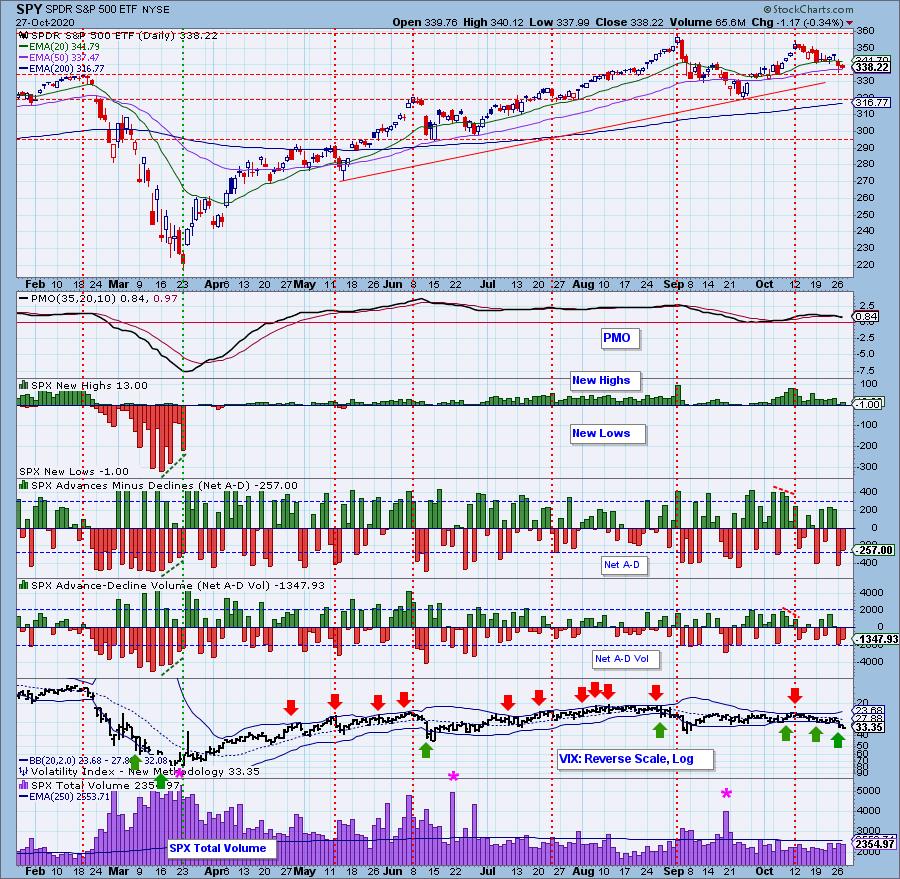
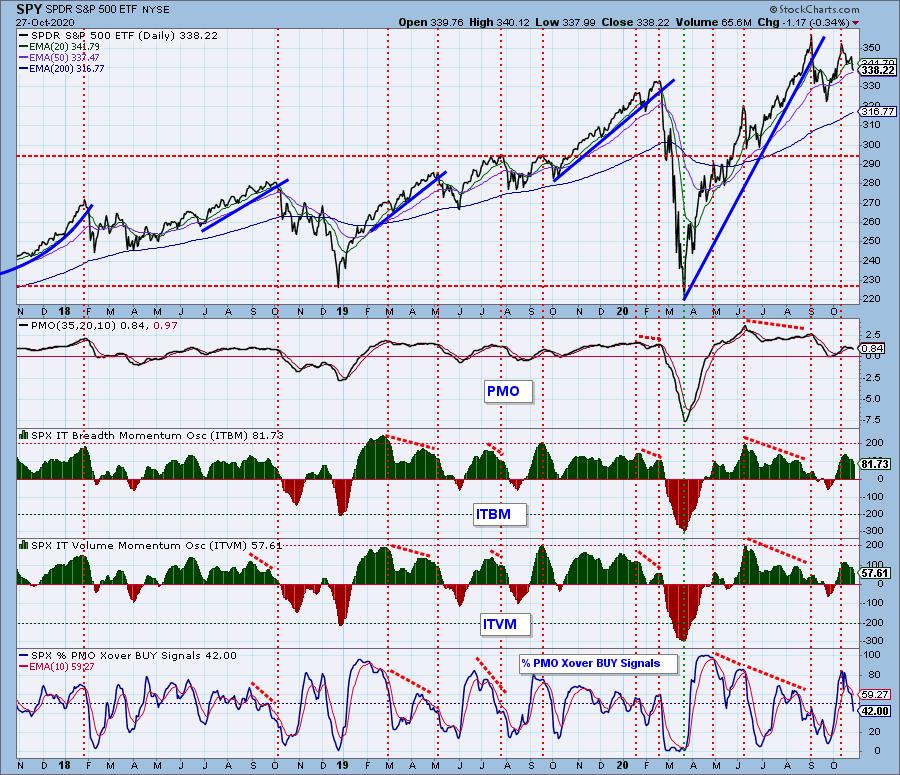
SPY Daily Chart: The declining trend channel remains but support at the February top continues to hold. The RSI is now negative and the PMO is on a SELL signal. The VIX is stretching those Bollinger Bands as we saw increased readings again. It's generally positive for the VIX to puncture the lower Bollinger Band on our inverted scale, but our other indicators have me bothered. Total volume was slightly lower than yesterday, but it is still on the high side.
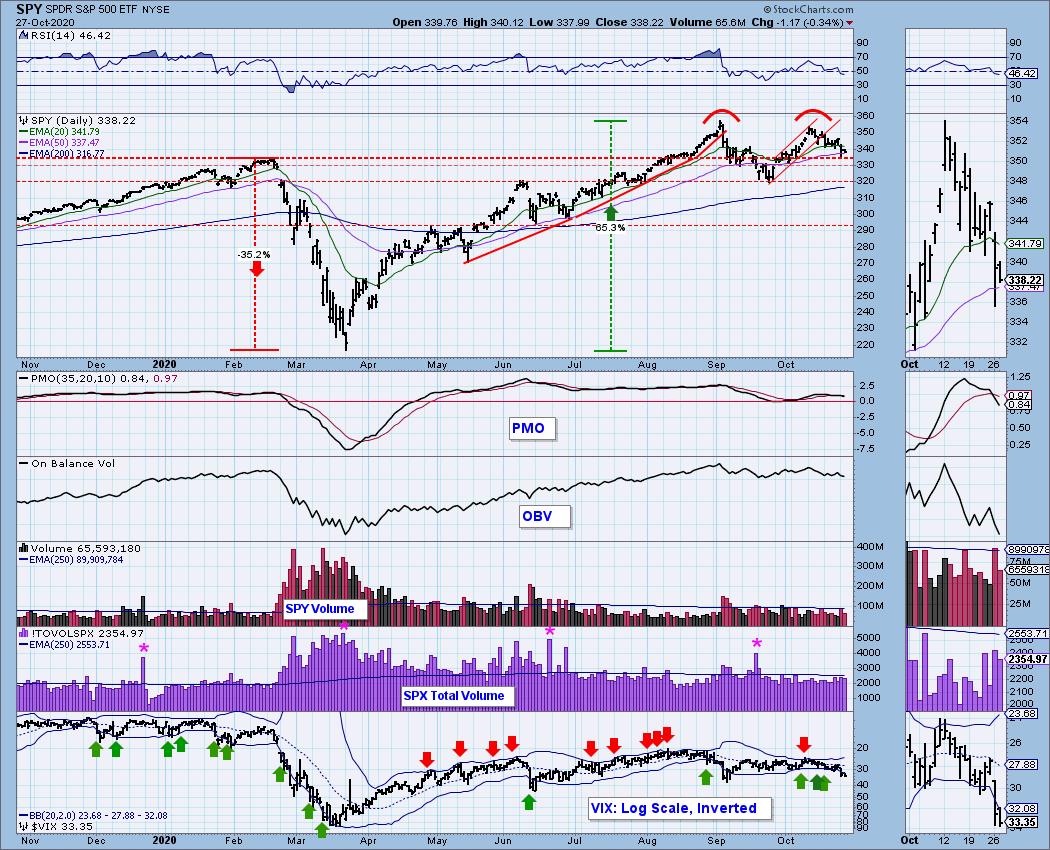
The possible double-top is very concerning when viewed on the 1-year daily chart.

It's Free!
***Click here to register for this recurring free DecisionPoint Trading Room on Mondays at Noon ET!***
Did you miss the 10/26 trading room? Here is a link to the recording (access code: X+2gJfpd).
For best results, copy and paste the access code to avoid typos.
Participation: The following chart uses different methodologies for objectively showing the depth and trend of participation for intermediate- and long-term time frames.
- The Silver Cross Index (SCI) shows the percentage of SPX stocks on IT Trend Model BUY signals (20-EMA > 50-EMA).
- The Golden Cross Index (GCI) shows the percentage of SPX stocks on LT Trend Model BUY signals (50-EMA > 200-EMA).
- The Bullish Percent Index (BPI) shows the percentage of SPX stocks on Point & Figure BUY signals.
Both the BPI and SCI have had negative crossovers. Today the GCI began to pull back slightly.
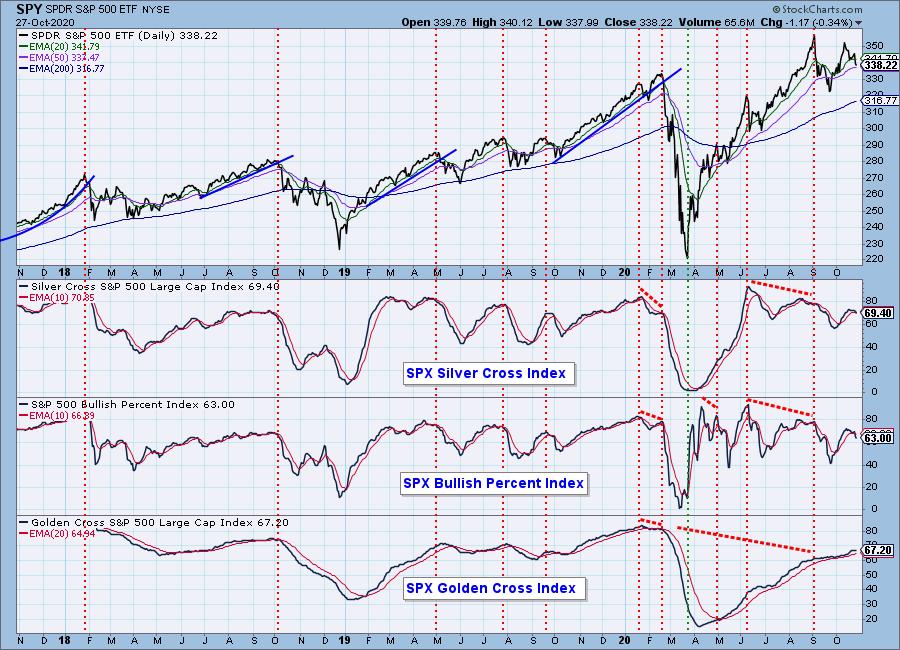
We saw hefty pullbacks on these indicators yesterday and today, but they aren't THAT oversold yet.
Climactic Market Indicators: Net A-D numbers were somewhat climactic even though they contracted today. The VIX suggests a rally pop and very negative readings on Net A-D could also be implying this. I suggested a possible selling initiation yesterday, but overall we are in a declining trend and highly negative numbers matched with a stretched out VIX generally leads to higher prices. Unfortunately, the Swenlin Trading Oscillators (STOs) are not looking good....
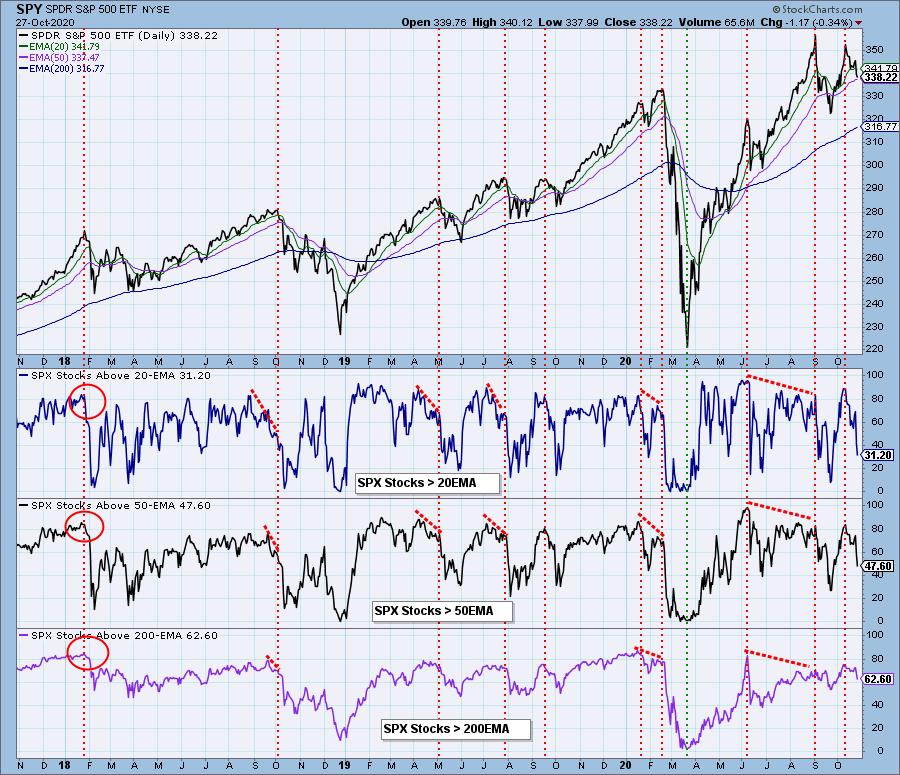
Short-Term Market Indicators: The strong reversal on the STOs indicates to me that we will see lower prices. The good news is that %Stocks indicators are now entering oversold territory.
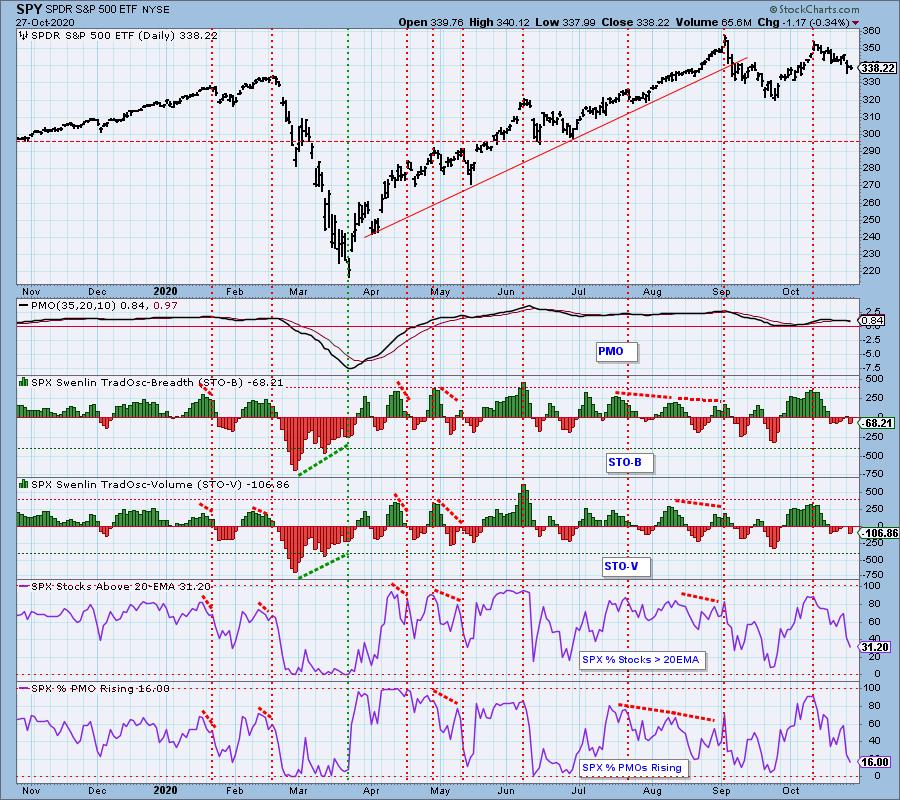
Intermediate-Term Market Indicators: The intermediate-term market trend is UP and the condition is OVERBOUGHT. The market bias is BULLISH. Yesterday's comments still apply:
"These indicators are pulling back which does could confirm the double-top that is forming."
CONCLUSION: The reversing STOs have me bothered but it could be those are climactic spikes that indicate a selling exhaustion. Given the stretched out VIX, contracting of Net A-D negative readings and price's arrival at February top support, I would look for a possible rally pop. I do NOT think that will be the beginning of a giant bull run, I see it as a mechanism in response to climactic conditions.
Have you subscribed the DecisionPoint Diamonds yet? DP does the work for you by providing handpicked stocks/ETFs from exclusive DP scans! Add it with a discount! Contact support@decisionpoint.com for more information!
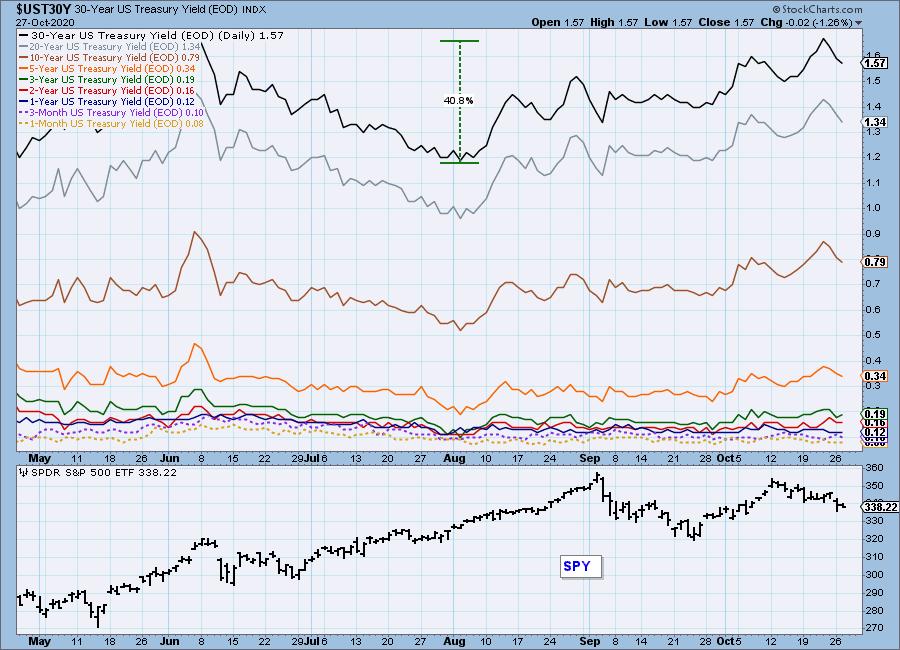
INTEREST RATES
This chart is included so we can monitor rate inversions. In normal circumstances the longer money is borrowed the higher the interest rate that must be paid. When rates are inverted, the reverse is true.
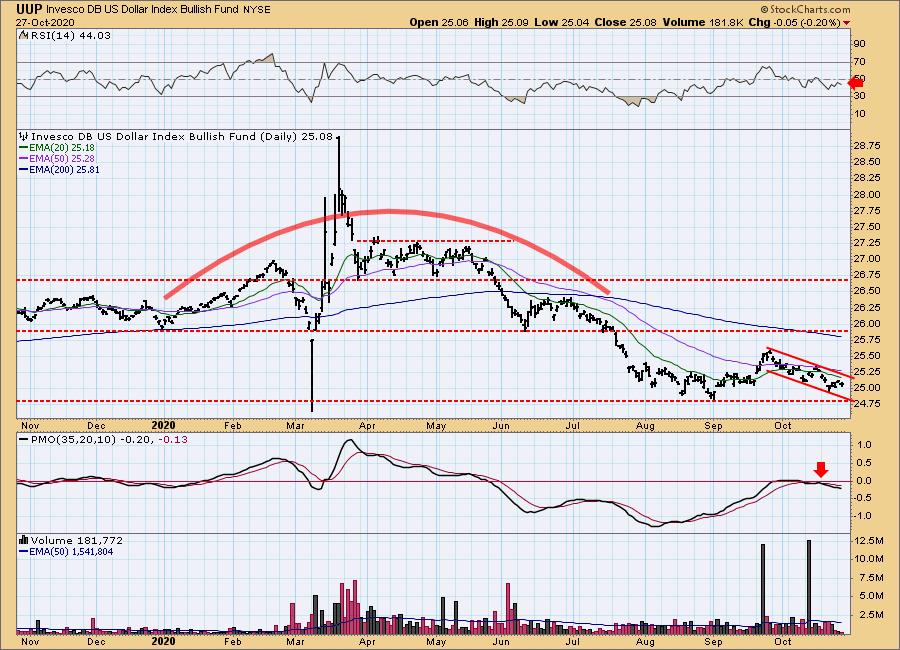
DOLLAR (UUP)
IT Trend Model: NEUTRAL as of 5/28/2020
LT Trend Model: SELL as of 7/10/2020
UUP Daily Chart: Yesterday's comments still apply:
"There is a defined declining trend channel. Currently price is making its way back toward the top of the channel where it will find resistance in the form of the 20/50-EMAs. The PMO is on a SELL signal and the RSI remains in negative territory. I am looking for a test of $24.75 once it is turned away at resistance."
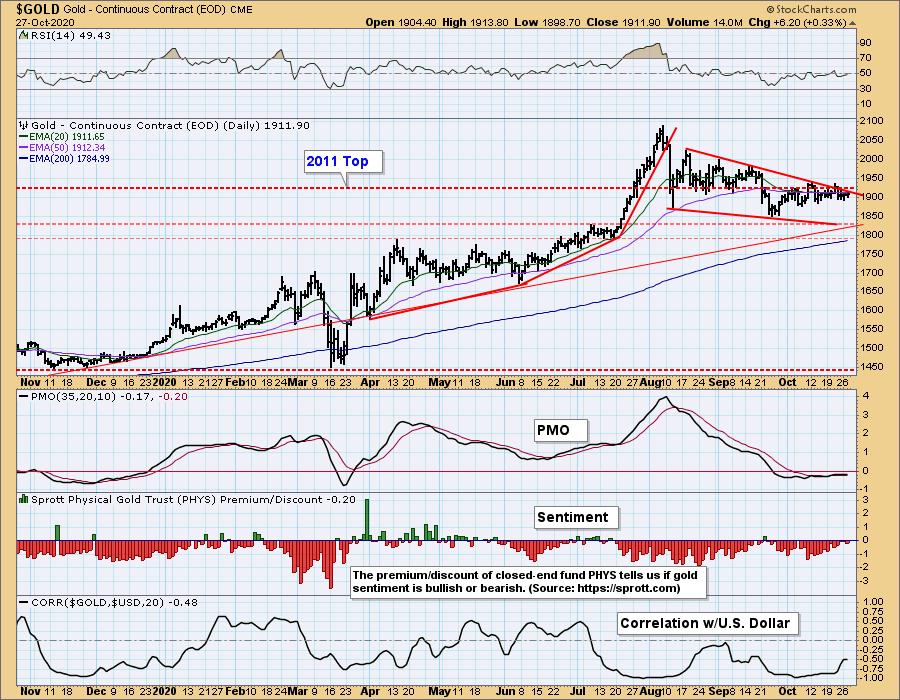
GOLD
IT Trend Model: NEUTRAL as of 10/14/2020
LT Trend Model: BUY as of 1/8/2019
GOLD Daily Chart: Yesterday's comments still apply:
"Before I get into the price action on Gold, I want to point out the correlation between Gold and the Dollar. It is typical to see a -1.00 or reverse correlation between Gold and the Dollar. That correlation is moving toward zero. If it gets close to zero, that implies no correlation, meaning they can travel together despite Gold being denominated in the Dollar. I expect the Dollar to decline and therefore, I should expect Gold to rise. When the correlation nears zero, that thinking doesn't work. Consequently, I am reviewing this chart not in the context of a declining Dollar, but simply based on its price action and sentiment.
The bullish falling wedge continues to be the dominant feature on the Gold chart. It looked like it might trigger last week as price briefly popped above the declining trendline that forms the top of the wedge. The PMO is clinging to a BUY signal and the RSI is negative to neutral. Dropping discounts suggests more interest in Gold so I'm expecting a breakout. This won't be easy given the convergence of the wedge's declining tops trendline, the 2011 top and 20/50-EMAs which are all acting as resistance."
Full disclosure: I own GLD.
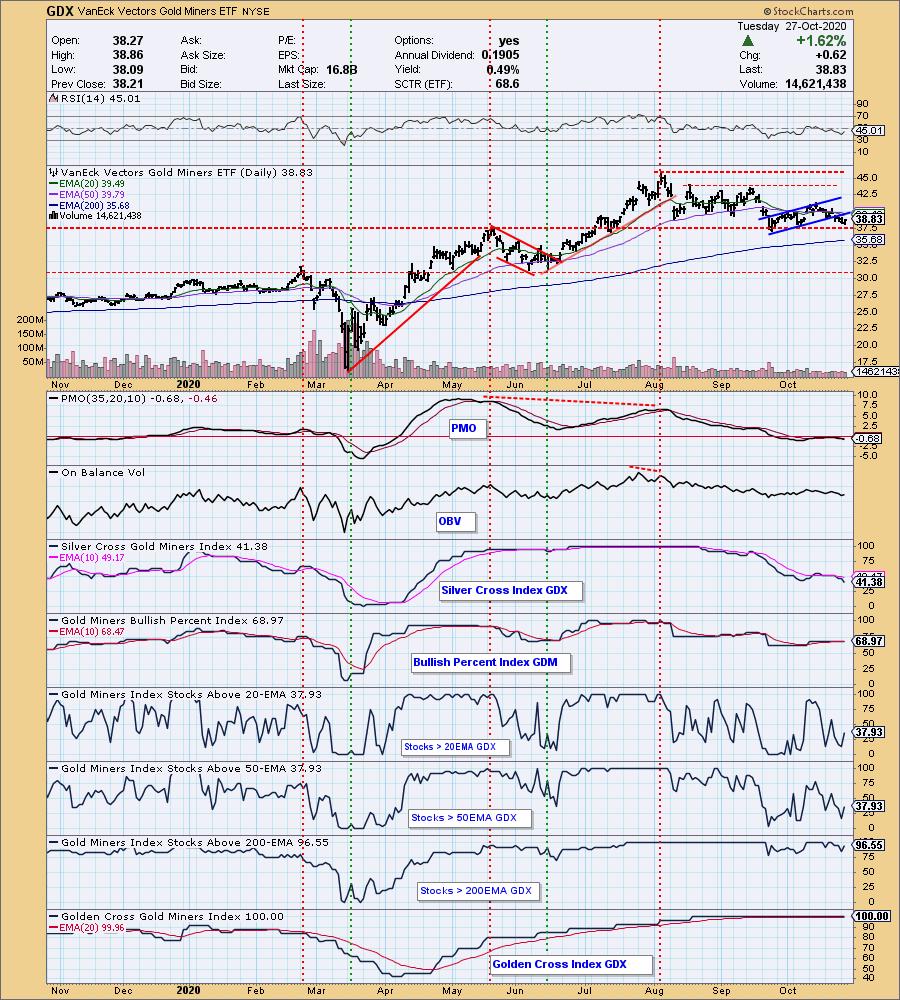
GOLD MINERS Golden and Silver Cross Indexes: Nice rebound on Miners today. Price is nearing important support at the May top since losing its short-term rising trend. The pullback relieved overbought indicators and they are now starting to show some improvement. I'm not thrilled with the movement of the SCI or the PMO on a SELL signal below the zero line. Just consider that warning to watch that support at $37.50 all the more closely.
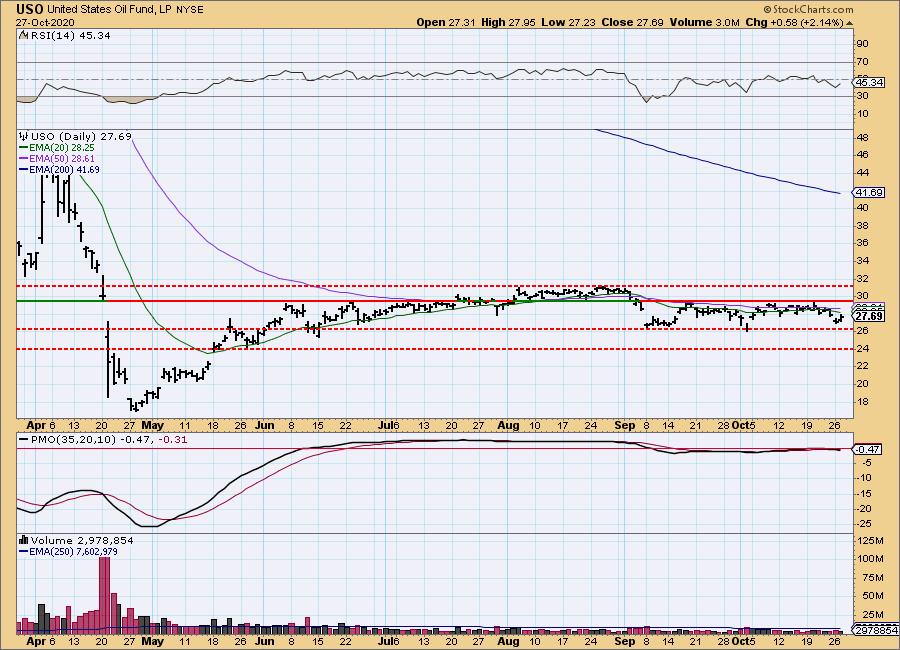
CRUDE OIL (USO)
IT Trend Model: SELL as of 9/8/2020
LT Trend Model: SELL as of 2/3/2020
USO Daily Chart: Great rally for Oil today but overall it remains steady within its current trading range. If and when we see demand improve with air travel etc, Oil will likely remain stuck in this trading range.
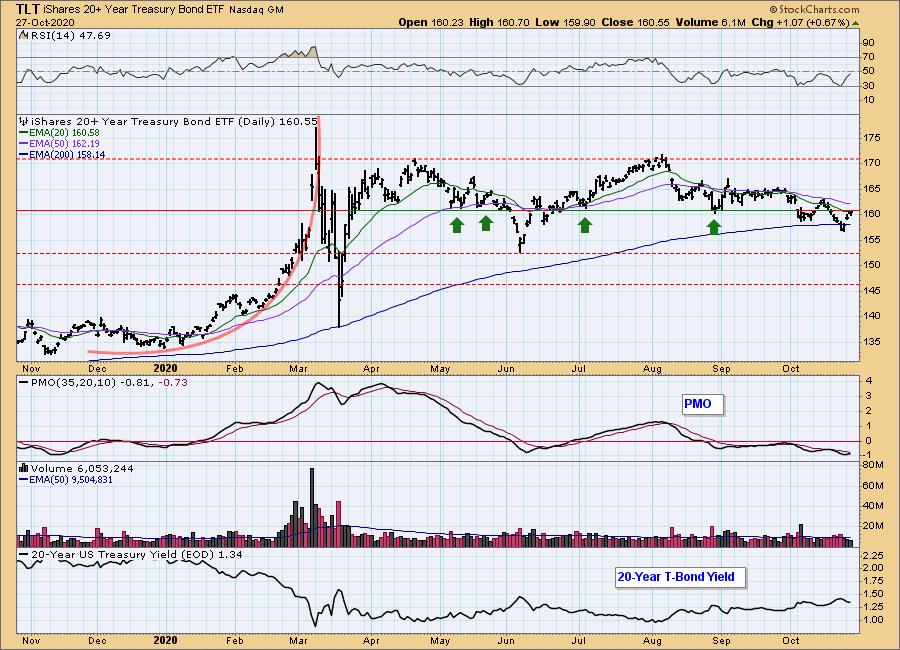
BONDS (TLT)
IT Trend Model: NEUTRAL as of 8/27/2020
LT Trend Model: BUY as of 1/2/2019
TLT Daily Chart: TLT did what it had to...bounce at the 200-EMA. Now it is coming up against dual resistance of the 20-EMA and horizontal resistance just above $160. That line has many "touches" which tells you it will require some energy to overcome. Note that it hasn't been able to break cleanly above the 20/50-EMAs since mid-August. The PMO and RSI are improving, but the RSI is still in negative territory and the PMO is well-below the zero line.
Full Disclosure: I own TLT.
Technical Analysis is a windsock, not a crystal ball.
Happy Charting! - Erin
Disclaimer: This blog is for educational purposes only and should not be construed as financial advice. The ideas and strategies should never be used without first assessing your own personal and financial situation, or without consulting a financial professional. Any opinions expressed herein are solely those of the author, and do not in any way represent the views or opinions of any other person or entity.
NOTE: The signal status reported herein is based upon mechanical trading model signals, specifically, the DecisionPoint Trend Model. They define the implied bias of the price index based upon moving average relationships, but they do not necessarily call for a specific action. They are information flags that should prompt chart review. Further, they do not call for continuous buying or selling during the life of the signal. For example, a BUY signal will probably (but not necessarily) return the best results if action is taken soon after the signal is generated. Additional opportunities for buying may be found as price zigzags higher, but the trader must look for optimum entry points. Conversely, exit points to preserve gains (or minimize losses) may be evident before the model mechanically closes the signal.
Helpful DecisionPoint Links:
DecisionPoint Alert Chart List
DecisionPoint Golden Cross/Silver Cross Index Chart List
DecisionPoint Sector Chart List
Price Momentum Oscillator (PMO)